If This Line for Bonds Breaks It Would Be Bearish — And Not Just for Bonds
As we search for patterns in a spikey market, let's also look at Bitcoin, silver, bonds, AMD, Alibaba, Robinhood, Cava and so much more.
You've reached your free article limit
You've read 0 of 1 free Pro articles.
The Market
Now we got a pullback so we’ll see if we can get that "one more rally" into the short-term overbought condition I expect by the end of this week.
Everyone is obviously watching Bitcoin again. I wish I didn’t have to, but I suppose every time it tanks it comes on our radar screen. I will say this: the DSI is 12 (it was 13 at the recent low). So it is possible we get that elusive single-digit reading in the next few days.
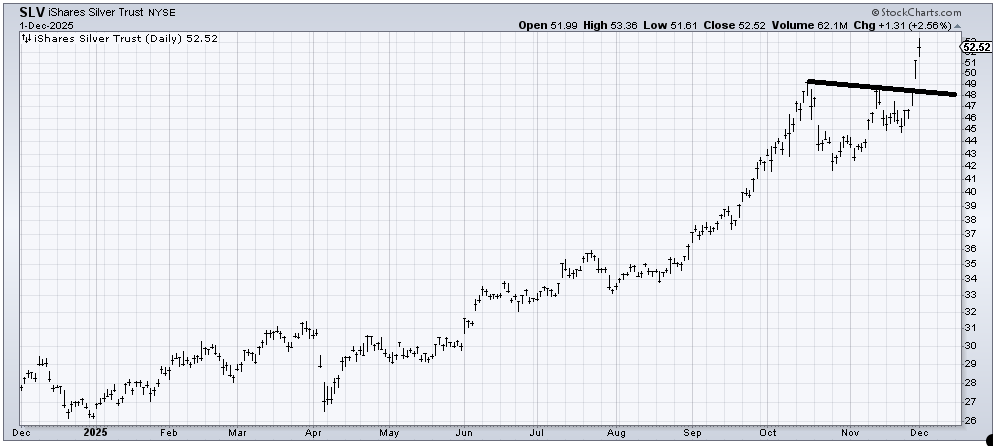
Then there is silver (SLV) , which seems to have gotten everyone excited. I missed this recent runup in silver. There is a measured target in the $53-55 area so it’s getting close. The DSI here is 83.
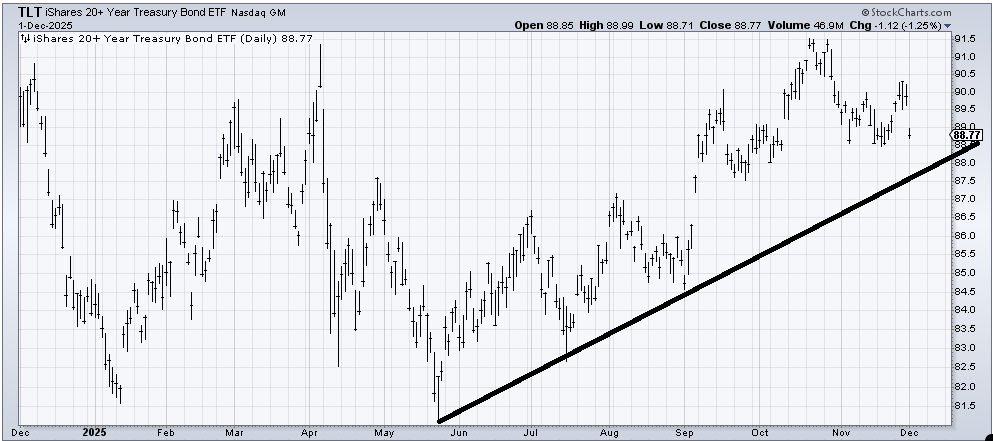
Then there are the bonds. That possible head-and-shoulders top I drew in on the (TLT) chart a few weeks ago may get some attention. Right now my inclination is to think that uptrend line holds and does not break. If I am wrong and it does, that would be bearish, not just for bonds but for stocks as well.
Sentiment-wise, I don’t have any firm data to share, but I can tell you folks seemed downright angry with me when I showed this chart (in yield terms). Does that mean they are banking heavily on the Fed cutting rates in December?
In any event, none of the indicators changed. The intermediate-term indicators are still not (and never got) oversold. It would be nice if charts could build some patterns, but lately we seem to get a lot of spikey moves, which is not helpful.
New Ideas
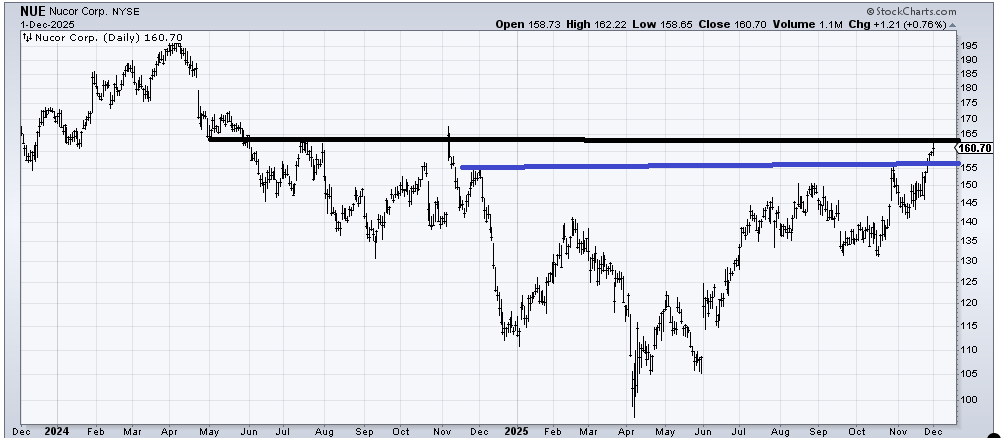
I have had several requests for a follow up on Nucor (NUE) , which I recommended a few weeks ago. It’s got a great base it is working on, but it is at resistance and has been green for six straight days so it is over-extended in the near term. I would love to see a pullback toward that $155 area (blue line) to give it a better launch pad to get over the resistance at $162.
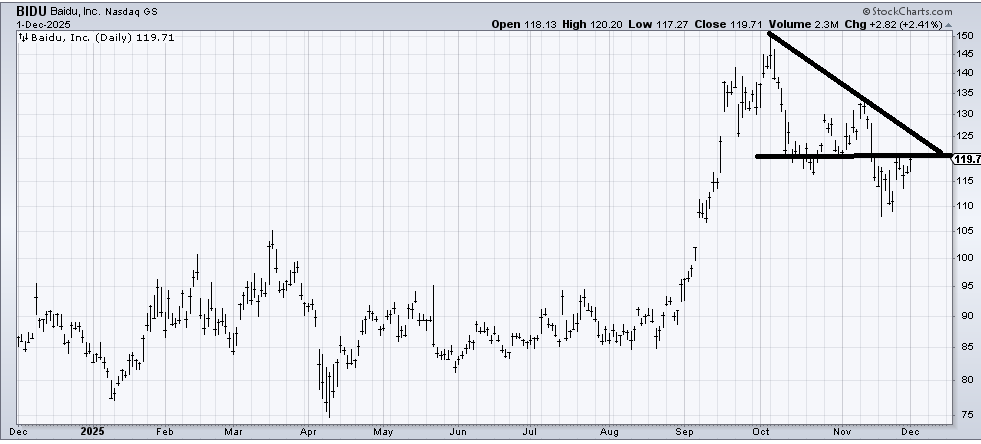
When I say I want to see a pattern shape up I look at a chart like Baidu (BIDU) . It’s got resistance here ($120), but this is the second time up here so it ought to be able to chew through it and get into that $125 area. It‘s spikey but that spike low at $108 was retested.
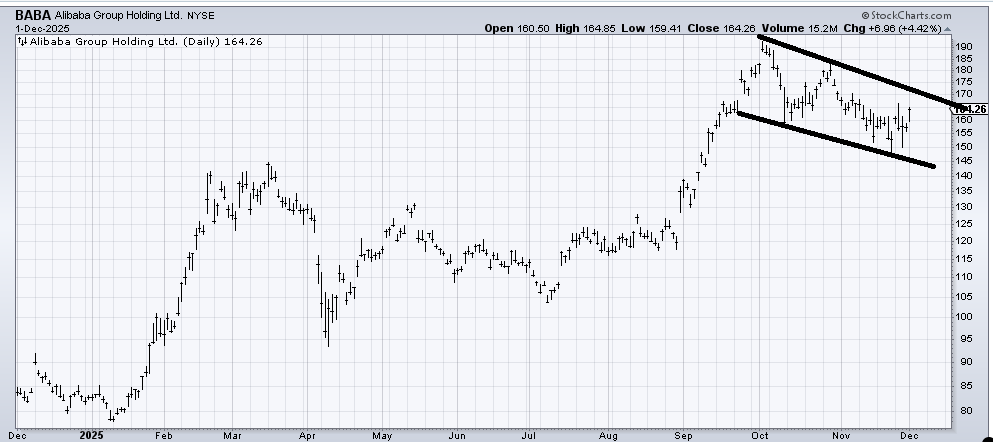
Or look at Alibaba (BABA) and see the way it has been working on rounding under for three, almost four weeks now. And it has been correcting for two months. It should make a try for $170, and with any luck cross it.
Today’s Indicator
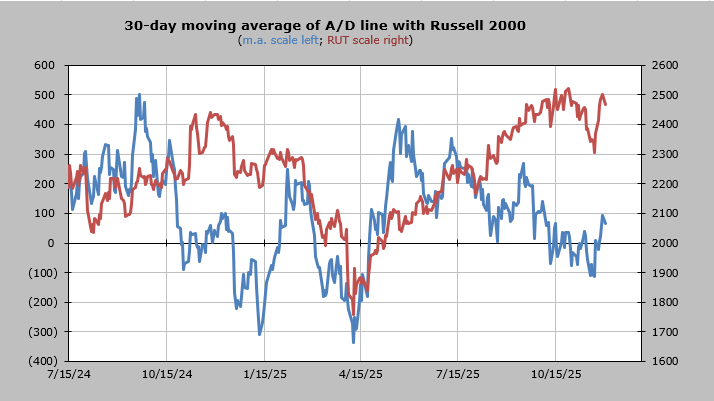
The 30-day moving average of the advance/decline line never got fully oversold. I suspect it works its way back down over the next few weeks.
Q&A/Reader’s Feedback
Helene welcomes your questions about Top Stocks and her charting strategy and techniques. Please send an email directly to Helene with your questions. However, please remember that TheStreet.com Top Stocks is not intended to provide personalized investment advice. Email Helene here.
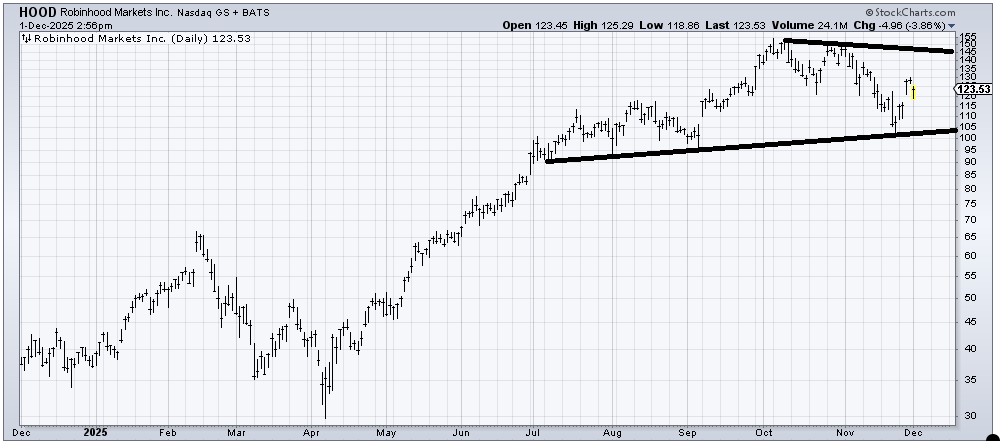
Robinhood (HOOD) managed to get up and over $120 but it still has plenty of resistance overhead. I suppose that a gap fill at $115 would lead to another rally but resistance is quite heavy at $130-132. Step back and the big picture says that lower line at $100 had better hold.
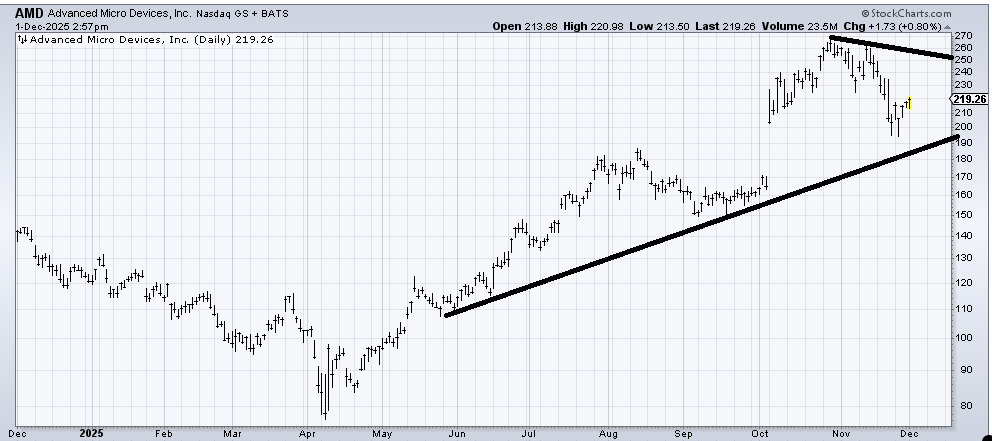
I have no view on Advanced Micro Devices (AMD) in the near term. Seems like a coin flip here. If AMD cannot get over $230 by the time we are fully short-term overbought I’d get concerned on a near-term basis.
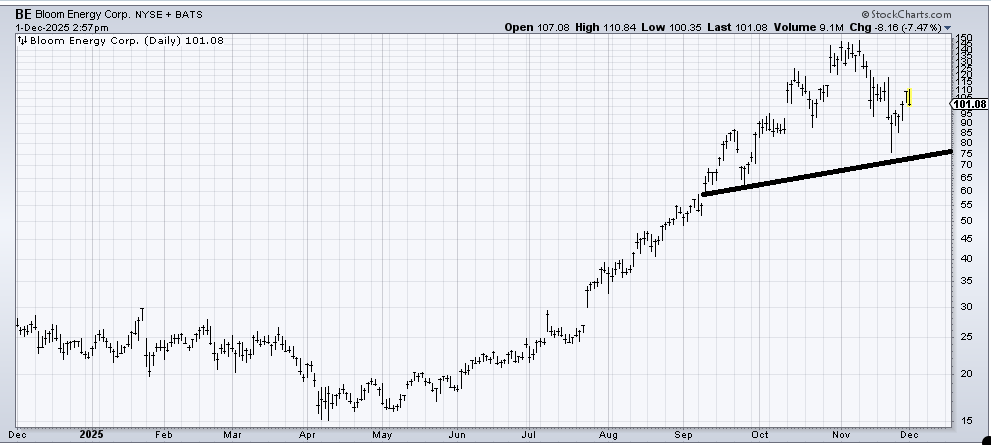
Bloom Energy (BE) is not a chart I have liked for months and I still do not like it. It trades too spikey and creates no discernable pattern that says "buy." If it comes back down to $75-ish it would probably hold on the first trip down (spike lows tend to hold on the first test).
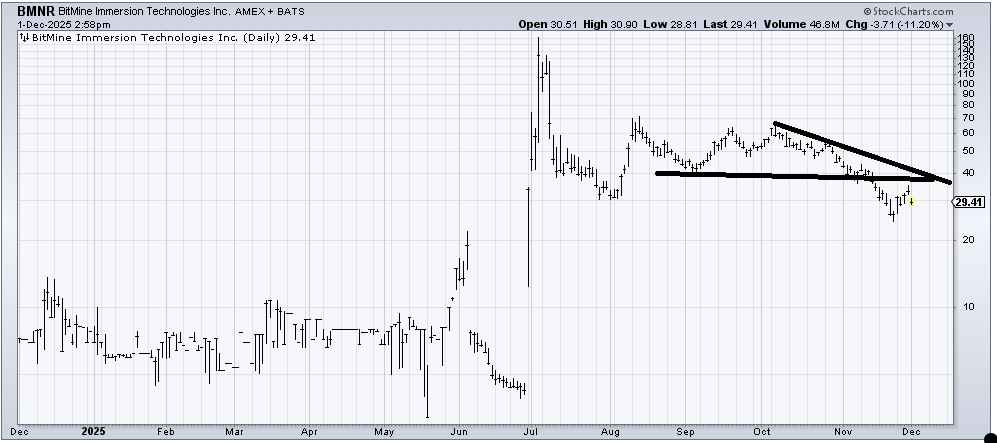
Bitmine Immersion Technologies (BMNR) had a nice rally and now hit resistance (at $40). If the DSI for Bitcoin itself gets low again I’d look for it to rally again.
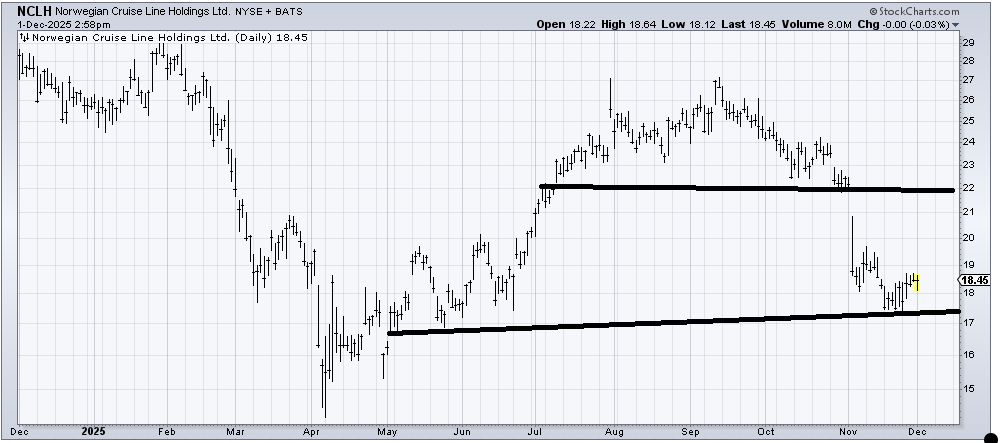
Norwegian Cruise Line (NCLH) had a measured target around $17 so this is probably the area that it starts to hold and build a base. It’s the type of stock that tends to rally late in the year/early in the new year.
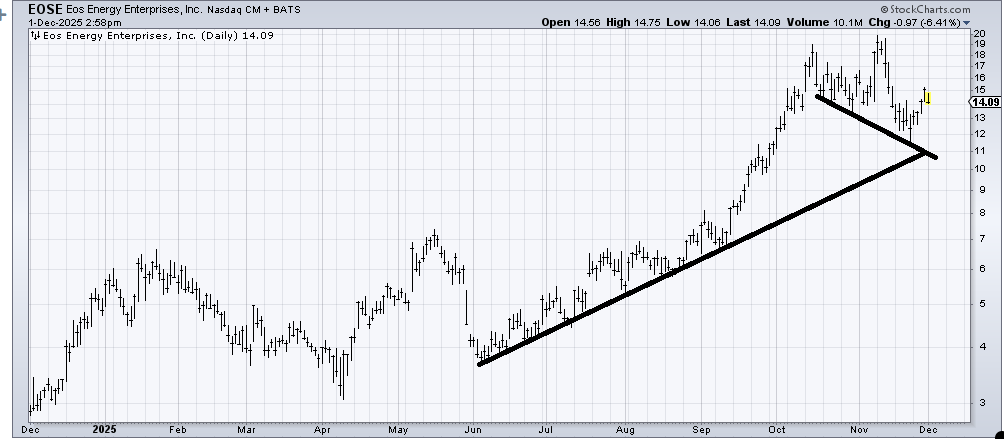
Eos Energy (EOSE) is yet another stock that has been a winner and has begun to trade so wild. That will rarely be the kind of chart I like. I just need a pattern to set up and none of these charts have the pattern. By that I mean they need to spend a little time scooping under, not spiking.
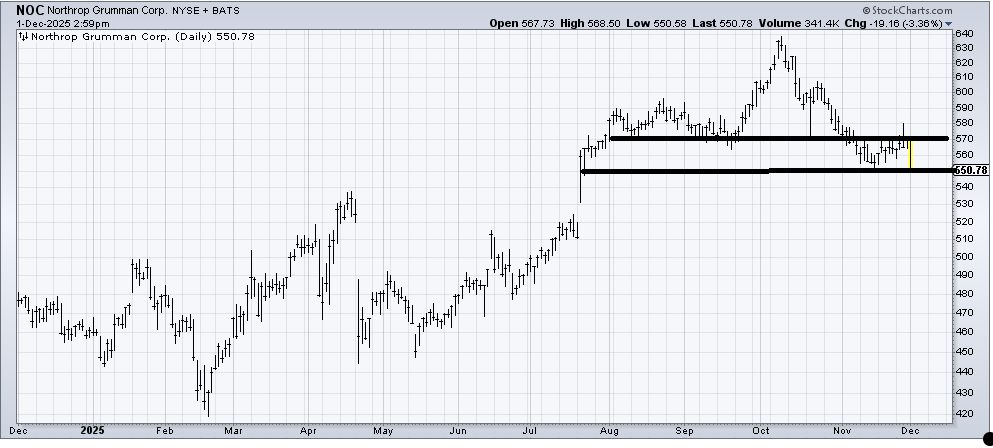
I do not like the break in Northrop Grumman (NOC) because it rallied to resistance and failed. If $550 breaks, my next downside target is around $210-520.
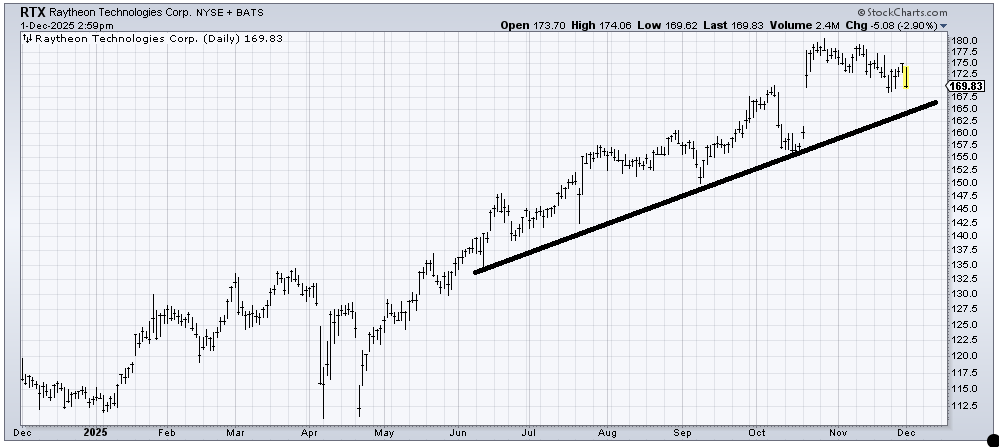
Raytheon (RTN) should find some support in the $160-165 area but I am terrible at liking charts that are up so much. Breaking $160 would make me cautious.
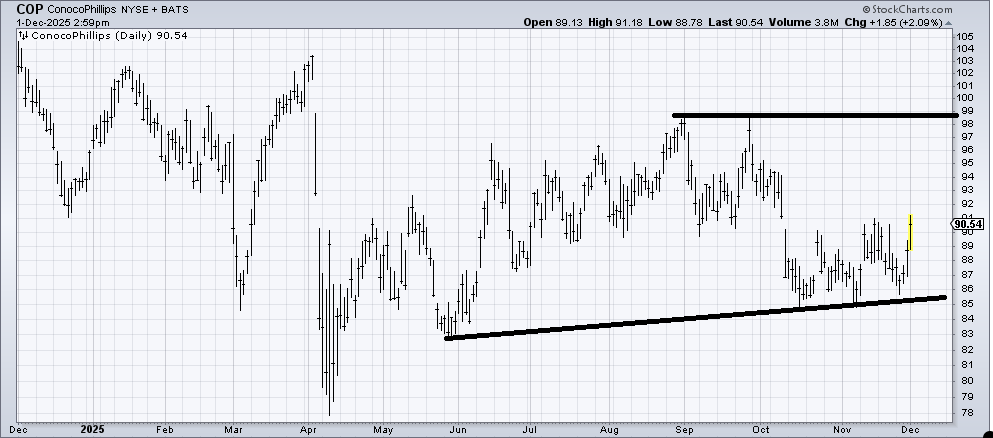
Every time an oil energy stock rallies it seems to last a day or two before that’s it. ConocoPhillips (COP) is no different but as long as it holds that $85 area I’d be willing to give it a try.
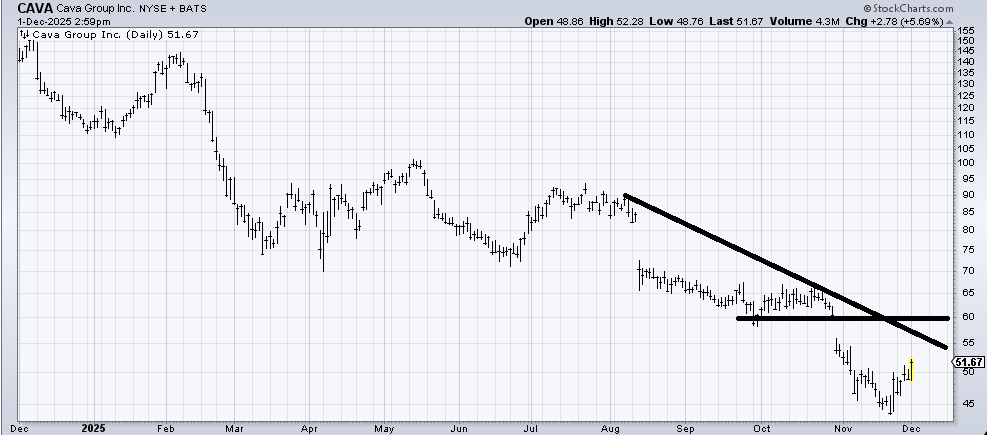
Cava (CAVA) is one of those "Dogs of the Dow" stocks so it is enjoying a nice short-covering rally. I would say it should fill that gap at $60 but I will start with $55-ish because $60 might be too much. If it breaks back and heads under $47-ish I’d give up on that.
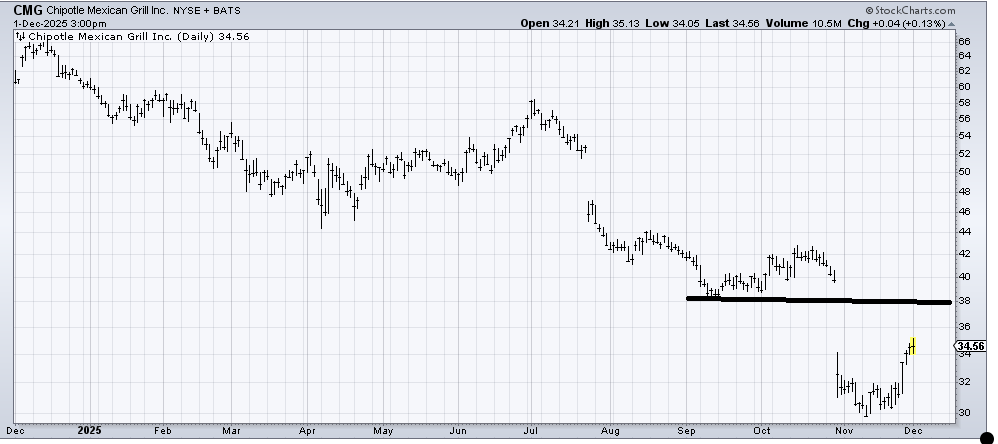
Chipotle (CMG) ought to fill that gap at $38 but my inclination is it will not do so in a straight line. It is likely to pull back toward $32 before it does that.