If Risk On is the Mood, Why Do Traders Sell On Friday?
People are bullish, but they're not acting like it.
You've reached your free article limit
You've read 0 of 1 free Pro articles.
The Market
Friday saw the S&P red. This was the third straight red Friday. In other words, since the Chair Powell speech at Jackson Hole a month ago that saw the market soar on that Friday, each Friday has been red. Oh, the market as a whole is up since then, but I find it interesting that we don’t seem to end the week on a strong note. Especially as we head into a Fed meeting that everyone knows the Fed will cut rates at.
When I noted that the S&P was red for the third straight Friday on Twitter, I was bombarded with folks screaming at me that Friday was a ‘risk on’ day. Aside from the fact that I hate that expression because every market comes with risk, so every day is a risk on day, I found it curious that the only areas that were up were tech (Nasdaq) and the Utes (yay!) and Bitcoin, and folks viewed that as ‘risk on’. I mean, breadth had its worst day in nearly two weeks, and that is considered ‘risk on’?
My only takeaway from that, is folks are still loaded up in the Mag 7 type names and all that ‘value’ stuff, the other 493, don’t matter to them. And that is probably why sentiment remains complacent and not giddy.
As you can imagine, the indicators did not change much on Friday. We have the FOMC meeting this week, which ought to be market-moving. I expect if the market is up heading into the Wednesday announcement, whatever it is, we’ll find a reason to sell off. If we’re choppy to down heading into the meeting, then it will be a coin toss.
As I was going through some longer-term charts this weekend, I found myself going back to the chart of Palladium that I highlighted here a few times in the last couple of weeks. I was a fan of the chart, having pulled back to support. But I wondered, are there any other charts with bases like that? Not many. In fact, very few.
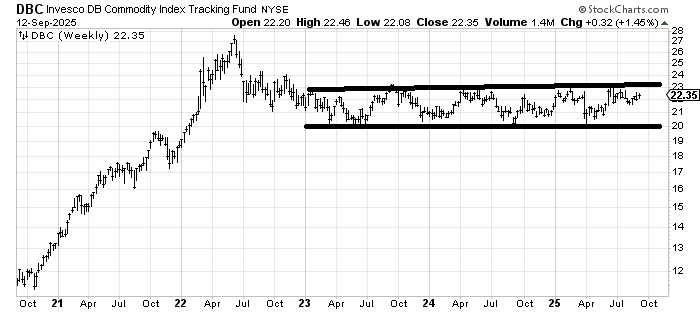
But I keep staring at the chart of DBC, which is a commodity index. The bad thing is it is 55% energy, so unless oil explodes to the upside, this ten percent range it has been in will stay with us. Yet as a base-picker, how can I ignore this now nearly three-year base?
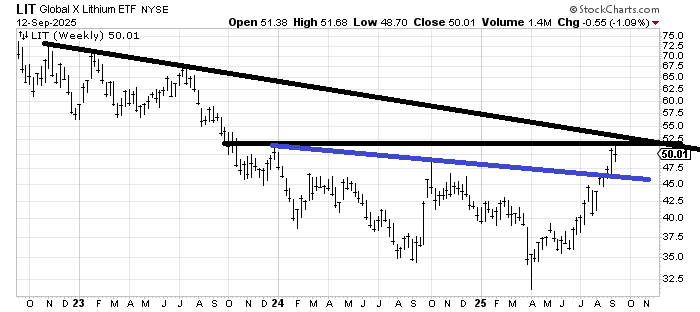
Then I look at the weekly chart of LIT, an ETF to be long Lithium, and I see a base forming. A pullback toward that blue line (45-ish) would make the chart much more interesting.
It’s possible those tech stocks will just keep ramping forever upward and never stop, but that’s not where the bases are.
New Ideas
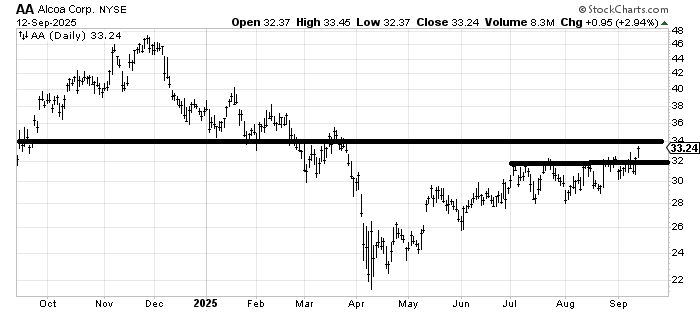
Alcoa AA is heading smack into a lot of resistance, but I want to highlight the fact that Friday, after two-plus months of trying to get through 32, it finally did so. And with that DBC chart in my head, I think I as long as AA stays over 30-32 it ought to keep chewing through resistance.
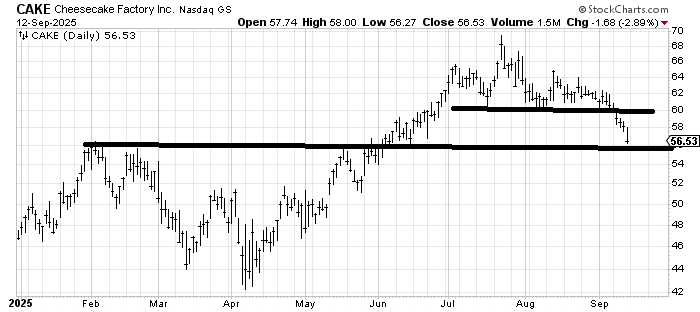
Cheesecake Factory CAKE has been red for seven straight days now. It’s rare these days that a short works so well, but it is coming into support, and while there is a measured target around 54, I don’t want to look a gift horse in the mouth.
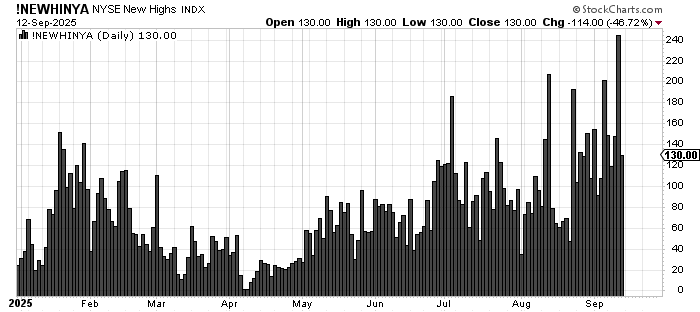
Today’s Indicator
The new highs backed off on Friday because most stocks did.
Q&A/Reader’s Feedback
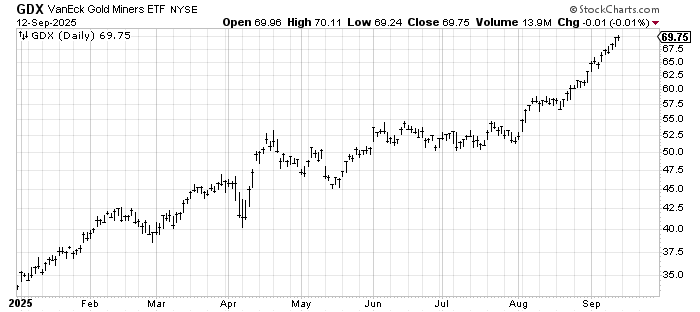
GDX is over-extended and vulnerable to a correction. It is not my kind of chart. But I keep waiting for the DSI to get over 90 for gold, and it hasn’t done so. It just keeps knocking on the door at 88. I’ll call it a hold until it does something wrong or the DSI gets over 90.
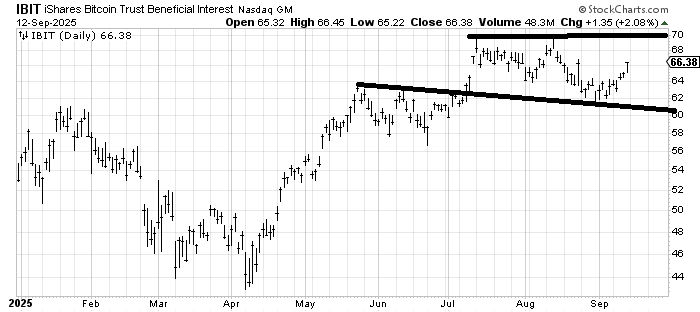
IBIT, an ETF to be long bitcoin, has a little resistance from that mid-August spike, but after a pullback, it ought to make another try at the high near 70. Then I would reassess if there is a better target or if it should be sold.
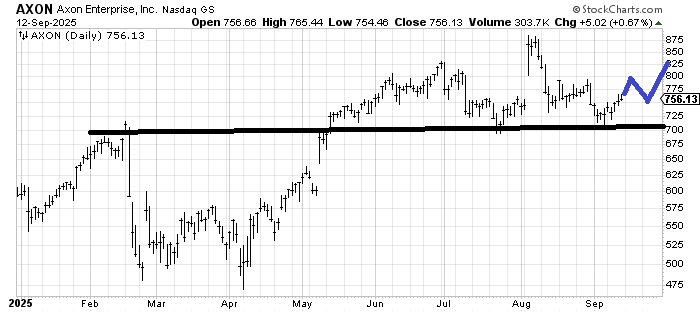
If Axon Enterprises AXON can map out something like I have drawn in blue (doesn’t need to be exact, but that general pattern), then I’d be willing to take a stab at it. So, a pullback to the 755-760 area, should it happen, could improve the chart and give it some oomph to get through that resistance at 800.
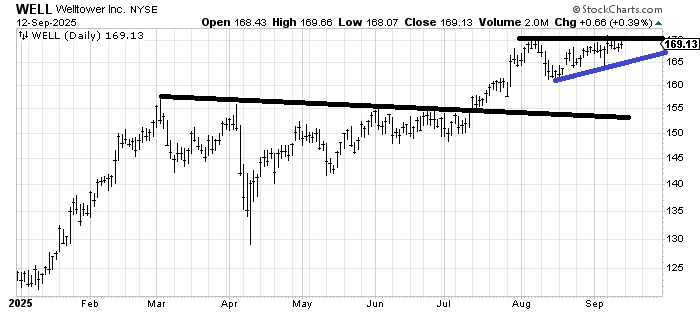
Welltower WELL had a measured target at 170, and you can see how it corrected off that level when it got there in early August. I don’t have a strong sense of whether it wants to break out over 170 now, but I will give it the chance as long as it doesn’t break that blue line (currently 165-ish).
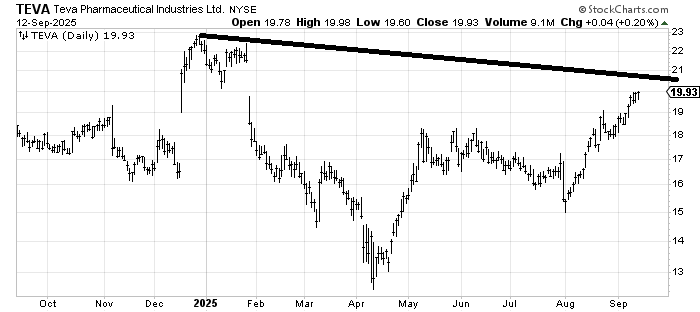
Teva TEVA ought to fill that gap near 21, which also happens to be where that downtrend line and resistance come in. There is a measured target around 23 (the old high) so I’d say I think that 21-23 area is going to be tough for this stock to get through on the first trip up there.
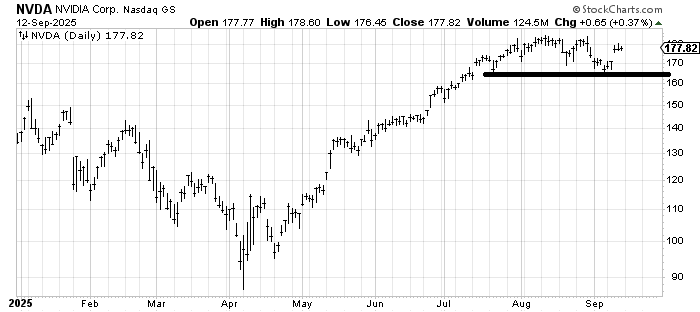
I don’t love the chart of NVIDIA NVDA right here, but if it falls back to 170-ish to close that gap, I’d look for a bounce from there, and the risk/reward is better there because if it falls under 164, you know you are wrong.
Helene welcomes your questions about Top Stocks and her charting strategy and techniques. Please send an email directly to Helene with your questions. However, please remember that TheStreet.com Top Stocks is not intended to provide personalized investment advice. Email Helene here.
