Hunting for a Pattern in Palantir
The company has a stellar balance sheet, and we know the fundamentals, but after that software selloff, things get a bit tricky.
You've reached your free article limit
You've read 0 of 1 free Pro articles.
I covered Palantir Technologies (PLTR) just a week ago after it reported fourth-quarter earnings that ripped the cover off of the ball. But since the stock's pre-earnings pop, the shares suffered as much as any during the following beat down in AI, software and growth stocks. I have received more requests for a follow-up to last week's piece than I could possibly count, and my answer has been consistent.
I have had to explain that losing the 200-day simple moving average is a big problem, and that I did not yet see a new trading pattern. Seeing something new that made sense would be key to any new interpretation of technical conditions that allow us to adjust target prices, add levels and panic points. In the meantime, this is another case that illustrates why I always harp on the necessity to take action at target prices, and panic points. "Add" levels can be a little more fluid in how one behaves, but targets and panics require discipline at a level that offers no quarter.
Let's Not Forget...
In the press release a week ago, Palantir CEO Alex Karp said, “Palantir’s Rule of 40 score is now an incredible 127%. Last quarter, our U.S. revenue grew 93% year-over-year, and U.S. commercial revenue grew 137% year-over-year. We are also announcing a 2026 revenue growth guide of 61% year-over-year. We are an n of 1, and these numbers prove it. Palantir is alone in choosing to exclusively focus on scaling the operational leverage made possible by the rapid advancements of AI models, a trend that we first called ‘commodity cognition’ well before others started repeating it."
Reminder: The "growth" stock "Rule of 40" is, this is a measure that helps investors determine if a growth company is growing efficiently or being too sloppy with its cash flows or if a company moving into profitability is showing the kind of net income it needs to maintain. The formula is straight forward.... Revenue growth in percentage terms + Profit margin in percentage terms must be equal to or greater than 40. Yes, 40 is considered outstanding and anything close to 40 is not to be taken lightly. Now, glace above, 137 is a bit more than 40. I do not think I have ever seen any growth stock crush the rule of 40 the way Palantir has.
More to Remember...
I also don't think any corporation can even approach the quality of Palantir's balance sheet. Again, the company is in a group of one when it comes to the fundamentals of business management. Palantir ended the quarter with a cash position of $7.177 billion and current assets of $8.358 billion. Current liabilities added up to $1.176 billion, including deferred revenues of $409 million (which are not true financial obligations) and no short-term debt.
That left the headline current ratio at 7.11 and its adjusted (for that deferred revenue) current ratio of 10.89. These ratios quadruple and quintuple what other top tech companies often consider to be simply outstanding.
Total assets amount to $8.9 billion, every cent of which is tangible. There's no baloney in that number. Nobody else is this sharp. Total liabilities less equity comes to $1.412 billion. This does include some more deferred revenue (a net positive) and again, there is no longer-term debt. The company is completely debt free. Let that sink in. Palantir is executing its business at levels unheard of in the annals of economic and operational history.
Oh, and the company blew Wall Street away with its forward-looking guidance as well.
The Charts
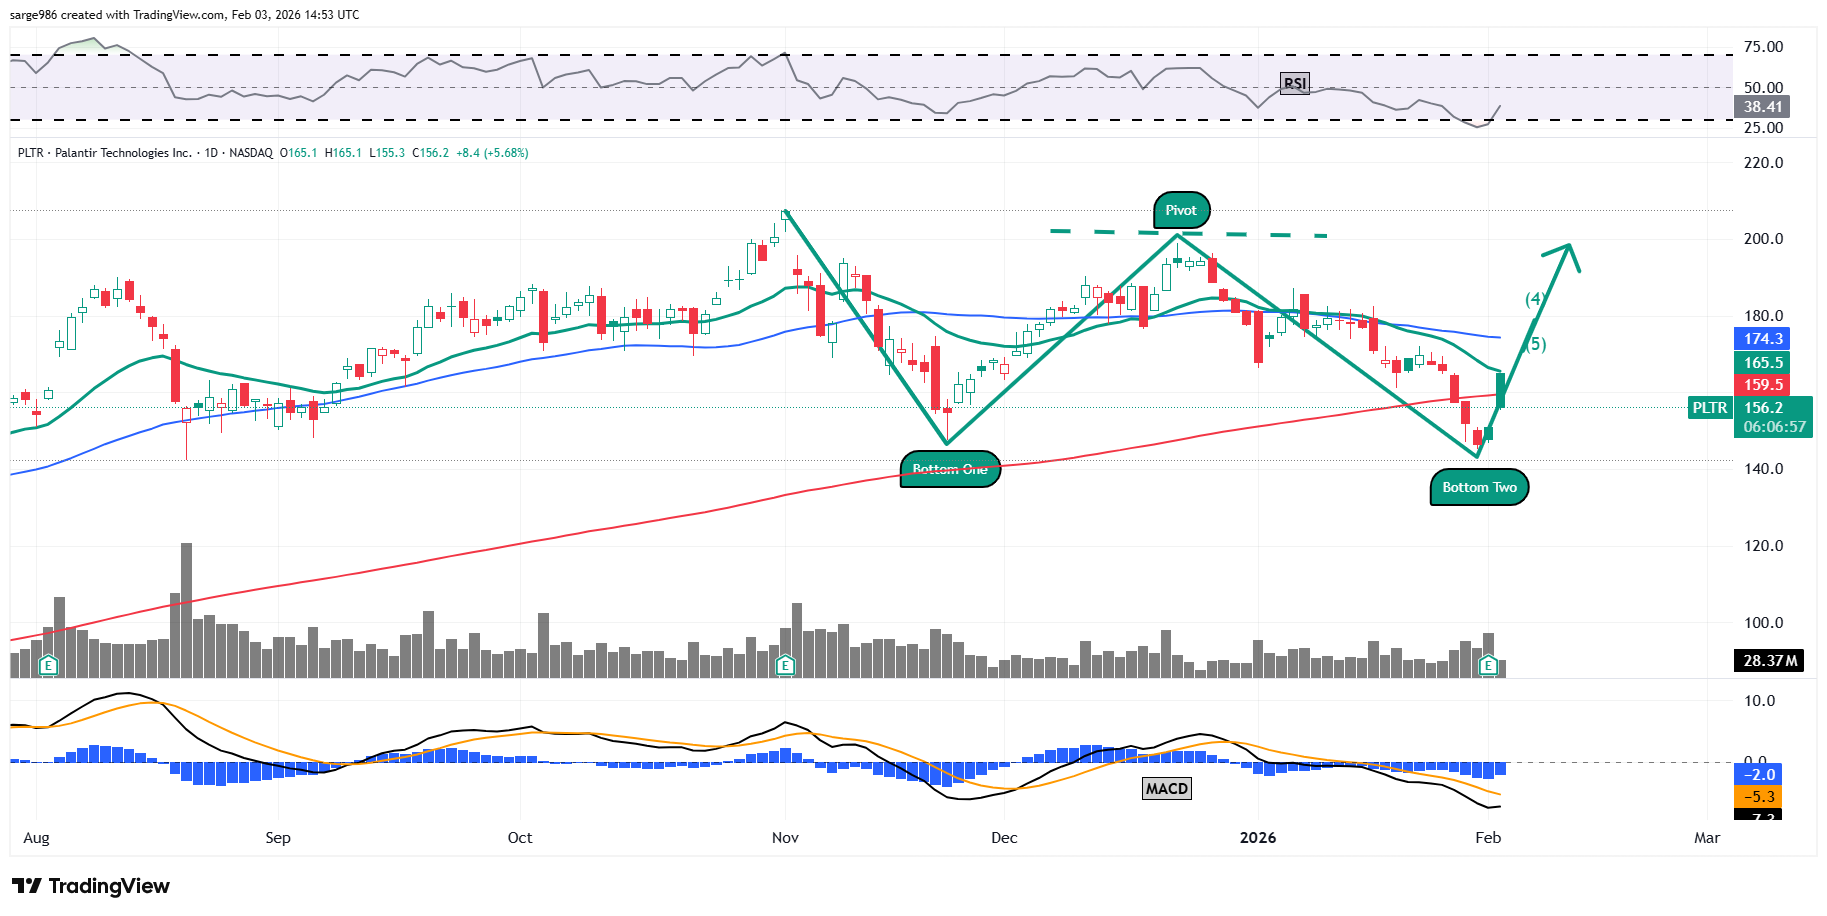
Just to jog some memories, this is what I saw and what I showed you before the events of the past week unfolded.
Now, I see two patterns, neither of which is especially positive, but a lot of that negativity may have already played out.
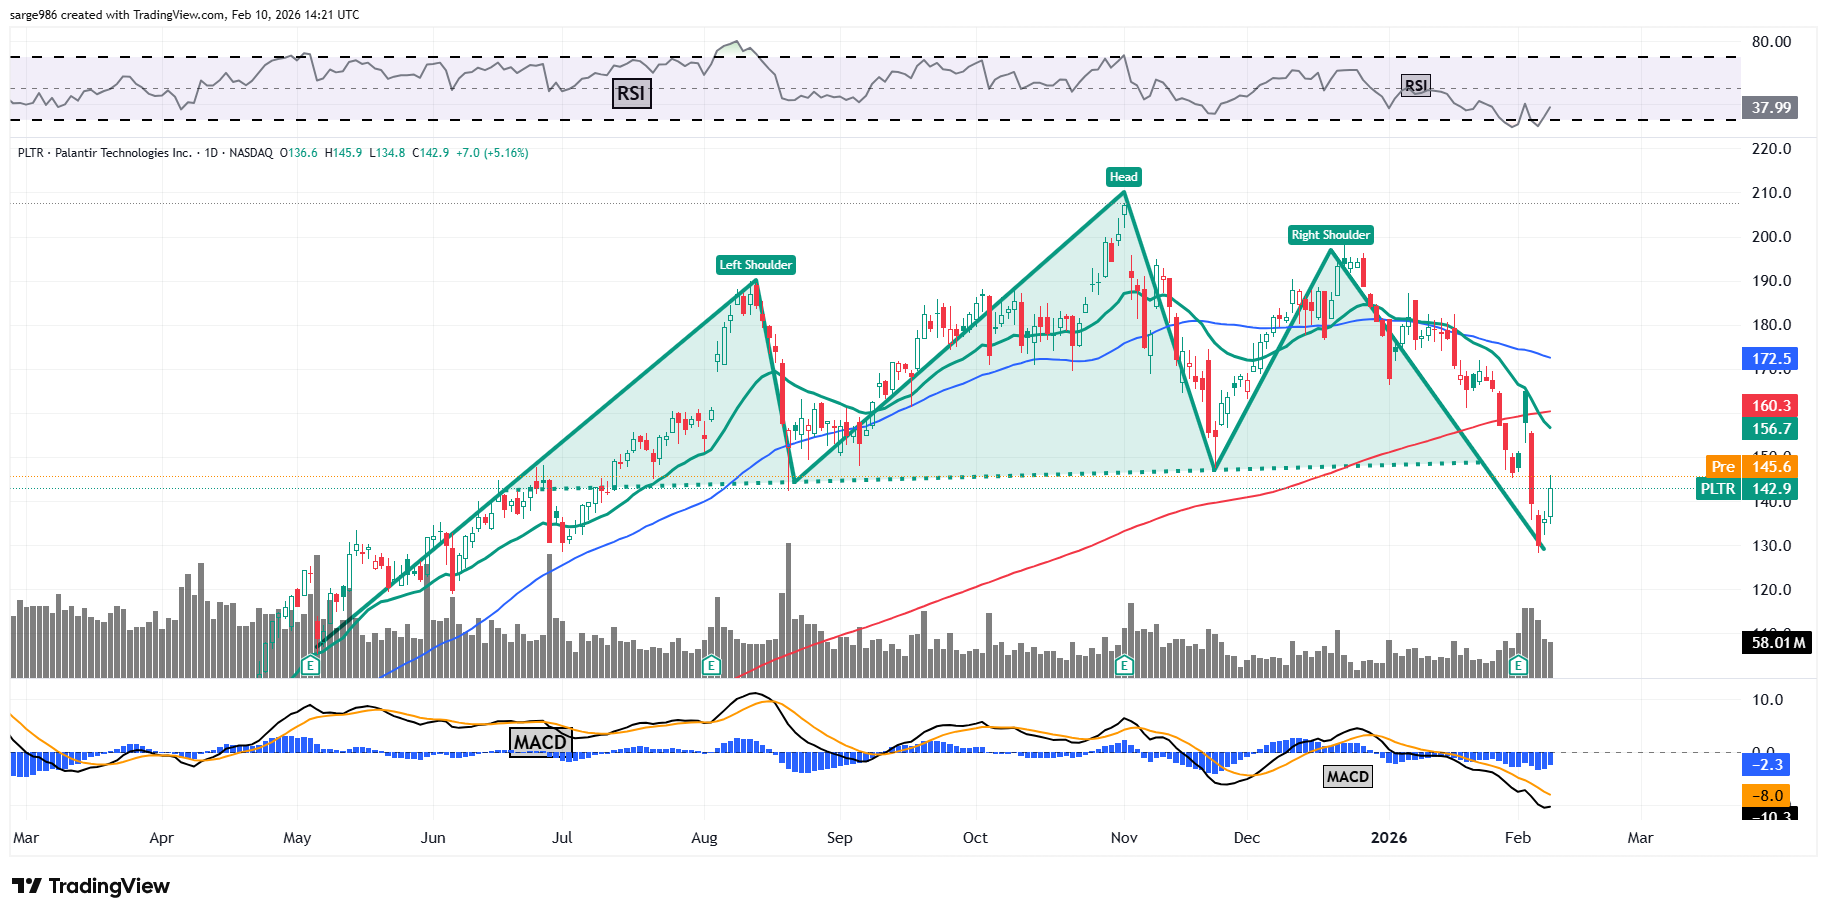
One... we have a head & shoulders pattern visible, which is bearish, that bore a $148 pivot. According to my model, that implies an add level in the $126 area. The stock bottomed at $128. The damage may have been done.
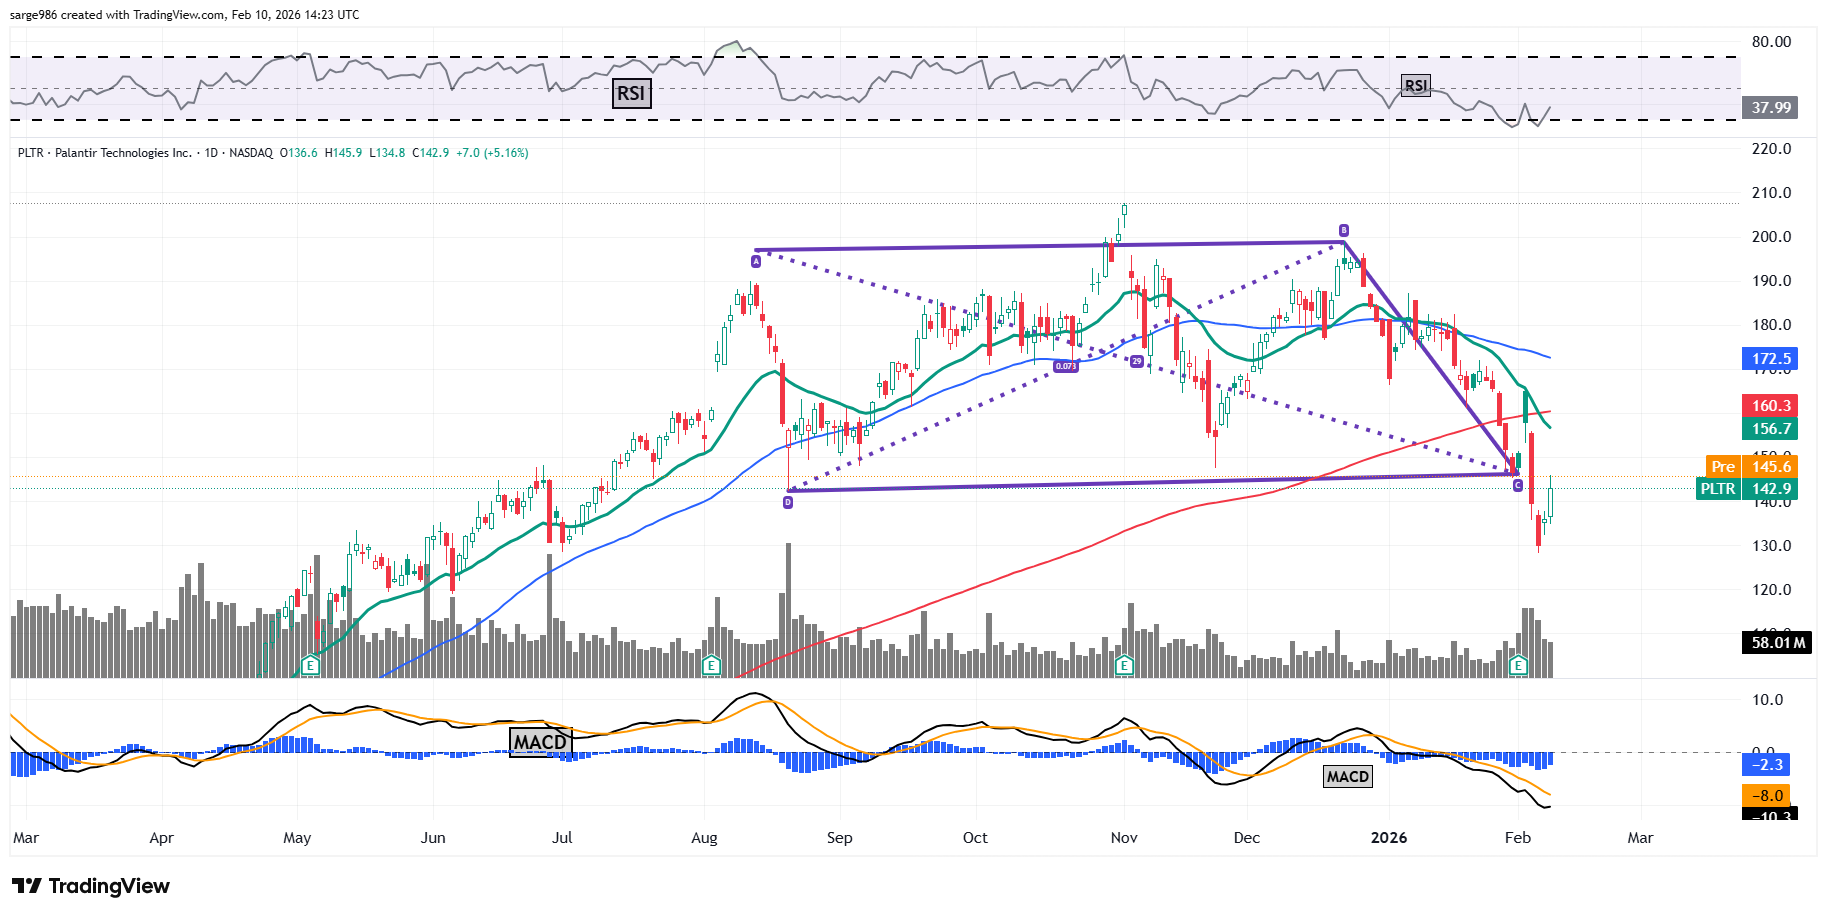
We could also interpret the above as a basing period of consolidation that suffered a downside breakout. This is a less aggressive bearish occurrence. The pivot here would be $146, placing the add level at around $132. Again, the stop bottomed, if that is the bottom at $128 and change.
My Thoughts
It's always difficult to initiate or add to a long position when a stock is running below both its 50-day and 200-day simple moving averages. My target price was and is $217. Now, if I see a bullish pattern with a definable pivot, I will change that, so $217 is by no means, written in stone.
The stock's daily moving average convergence divergence is still really bullish looking, despite that relative strength has pulled itself out of the abyss. Another positive: The 21-day exponential moving average did cross below the 200-day SMA, which is never good, but -- and this is a big but -- the 200-day SMA was rising when this happened. That greatly diminishes any negative algorithmic impact. It's just how many of them are designed. (Psst... they probably had not figured that out. I shouldn't have written it. Ahh, those guys don't read anyway.)
At the time of publication, Guilfoyle was long PLTR equity.
