How to React After 'Death Cross' Hits S&P 500, Nasdaq
Will the death cross indicator lead stocks lower? Let’s look at history.
You've reached your free article limit
You've read 0 of 1 free Pro articles.
The term "death cross" sounds ominous. That's why this bearish stock market indicator is getting so much attention right now.
A death cross, also known as a "black cross," occurs when a falling fast moving average crosses below a falling slow moving average. This is the opposite of a "golden cross," which consists of a crossover involving two rising moving averages.
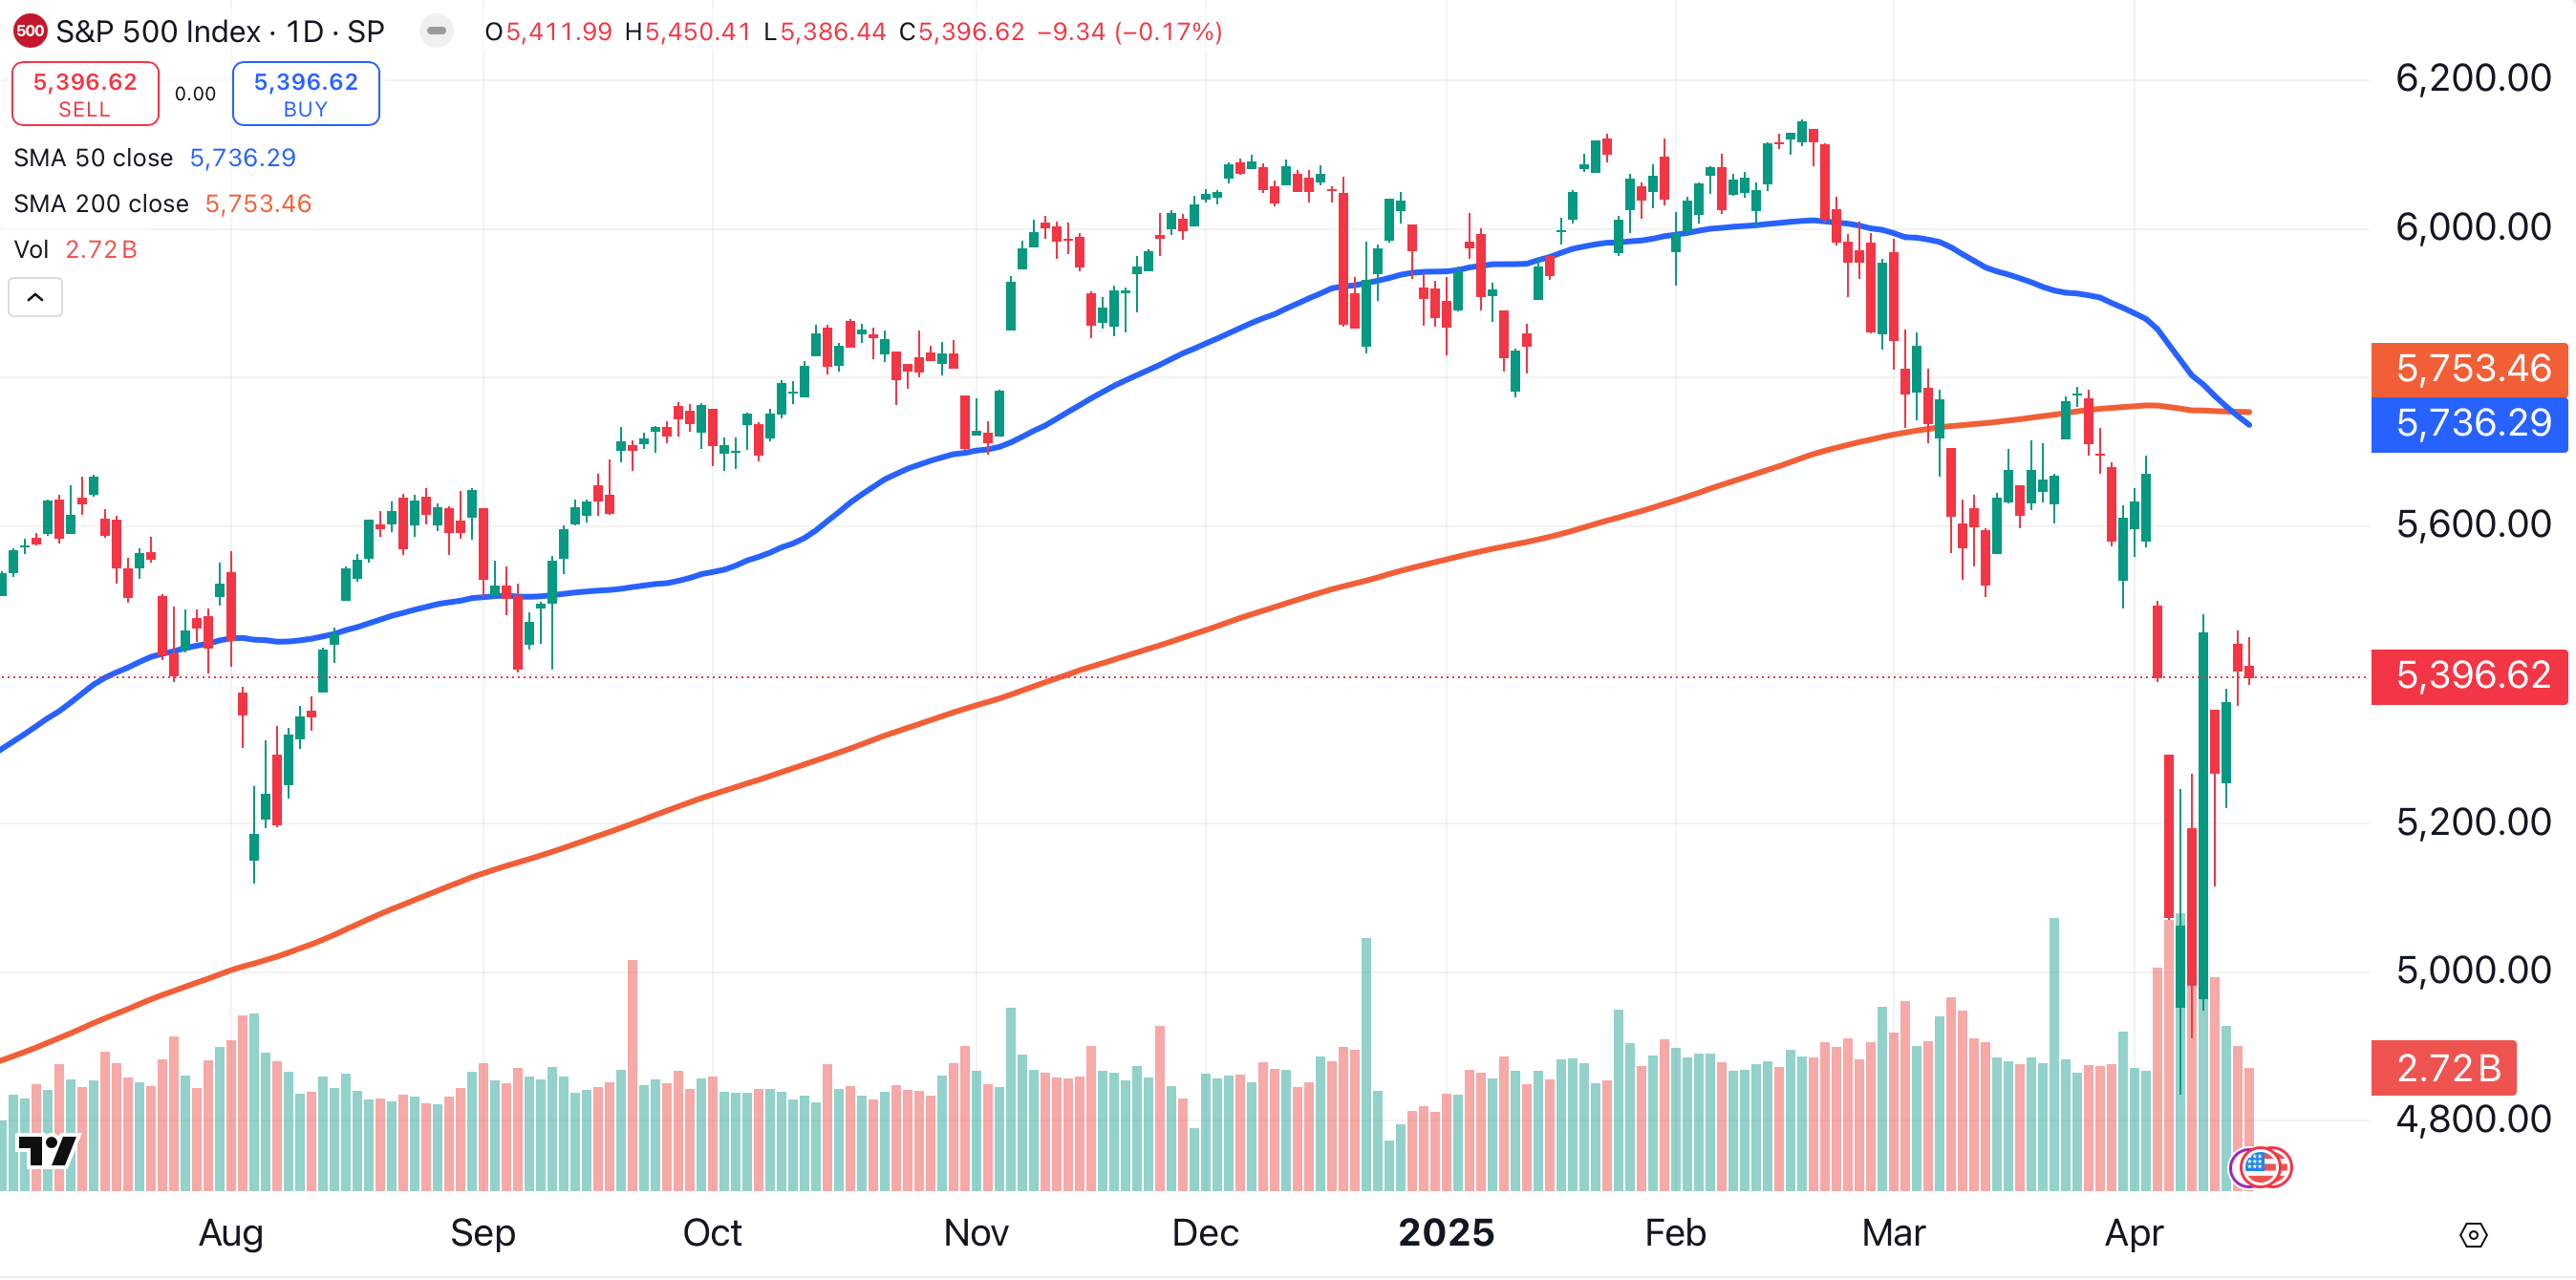
Most commonly, these crossovers monitor the 50-day (blue) and 200-day (red) moving averages. A crossover involving those moving averages has just occurred on the S&P 500, shown below.
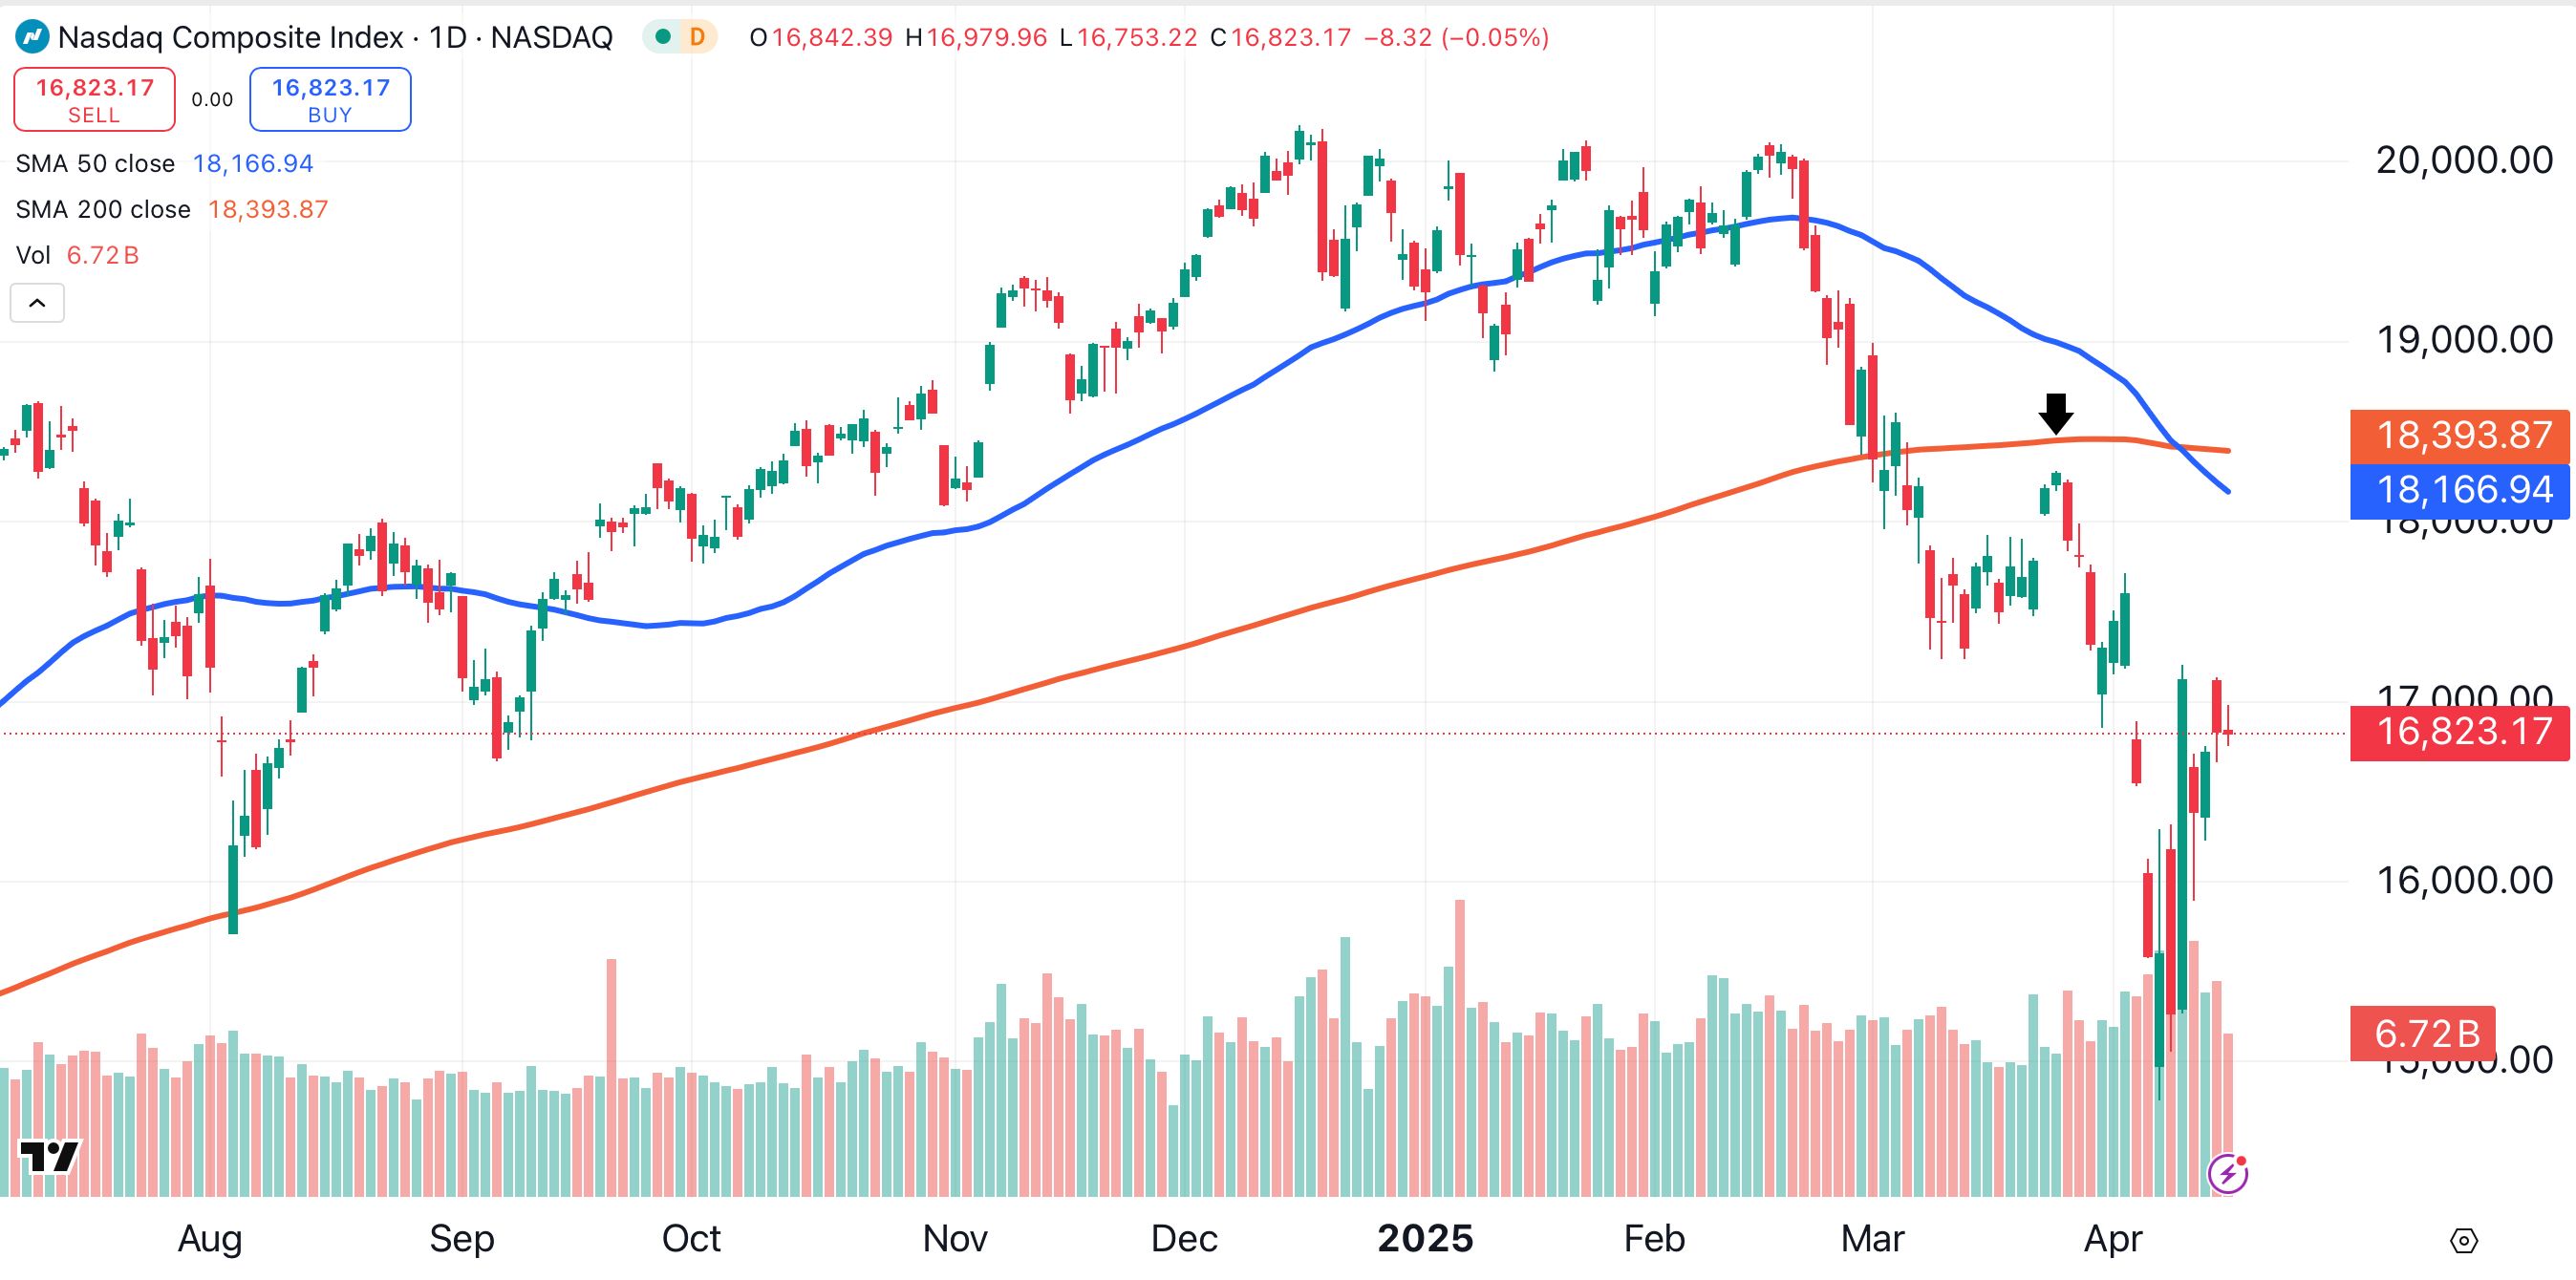
A similar crossover occurred several days earlier on the Nasdaq Composite Index, shown below. Notice how the Nasdaq’s 200-day moving average (red) acted as resistance when the price attempted to climb back above it (arrow).
Time to Sell? Not Necessarily
Should investors abandon hope now that this bearish indicator has flashed on the two most widely-followed indexes? Not at all.
Experienced technical analysts will tell you that this pattern of crossovers, when using the 50- and 200-day moving averages, is a lagging indicator. This means that by the time the bearish crossover is complete, the majority of the damage has already occurred.
What can we learn from statistics? According to Dow Jones Market Data, when measuring the S&P 500’s performance after all death crosses since 1950:
- Over 70% of the time, the S&P 500 is higher one year later
- On average, the large-cap index is higher by 5.8% one year later.
Considering this information, should investors actually buy instead of sell when a death cross forms? That can be a risky strategy.
Death Cross 2000
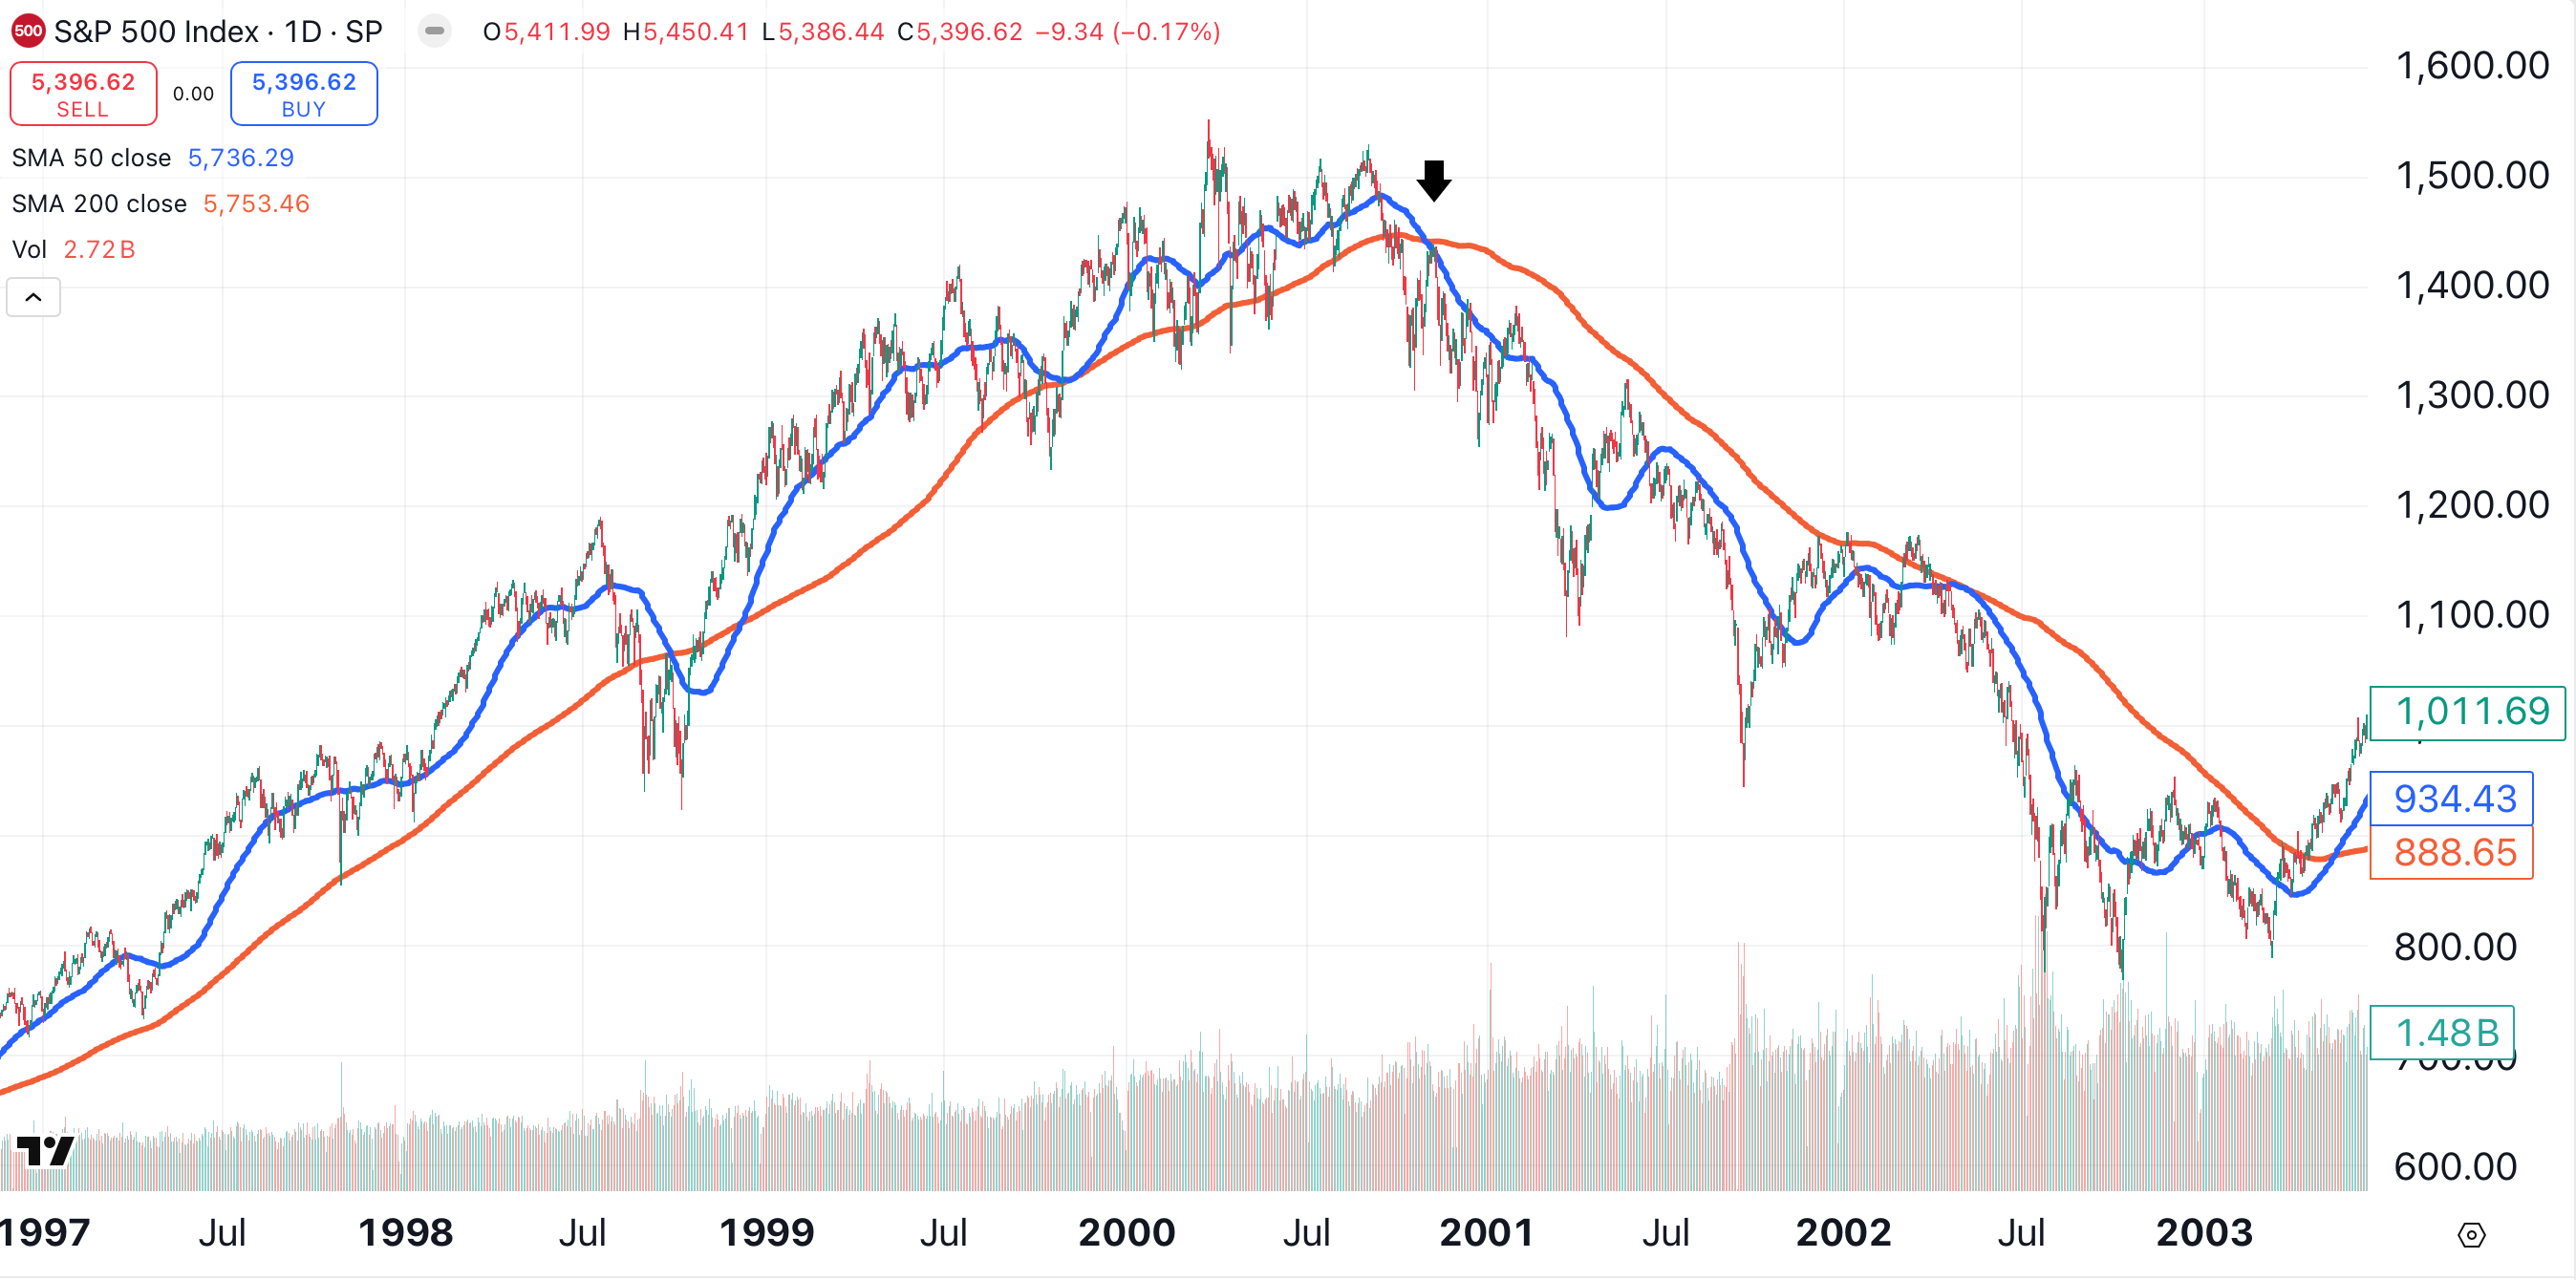
While stocks tend to be higher one year after a death cross, the bearish indicator did precede one of the biggest drops in recent history. A death cross in October 2000 (arrow) marked the end of the dot-com bubble, and the beginning of a massive decline that lasted into late 2002:
The advantage to going long on a death cross would be that you’re buying well off the highs. As of Tuesday’s close, the S&P 500 was 12% below its all-time high, set on February 19. The Nasdaq Composite is about 18% below its peak, set on December 16, 2024.
Historically speaking, buying now will likely result in a gain, though not a large one. There’s a smaller chance of a loss, and a very small chance of a significant loss.
That said, every moment in the market is unique. History doesn’t always repeat itself, so be careful out there.
At the time of publication, Ponsi had no positions in any securities mentioned.
