How to Play Nvidia as It Breaks Out ... Again
Here's my price target, pivot and chart-read for the semi-conductor star.
You've reached your free article limit
You've read 0 of 1 free Pro articles.
Nvidia's (NVDA) breaking out. Again. On Thursday, investment banker Morgan Stanley held a meeting with Nvidia's management team. The team headed by analyst Joseph Moore, who needs no introduction, wrote, “Investor focus is primarily on the demand picture, where management enthusiasm on both near-term and long-term outlook continues to strengthen. The commentary here was that most of the demand growth we have seen so far has been mostly higher revenue capture within a strong cloud capex growth trajectory, mostly capturing the migration from CPU to GPU within existing application workloads. That will continue to grow, but the broadly transformative AI use cases are not even really here yet.”
Moore rates Nvidia at "Overweight," which is considered to be "buy-equivalent" with a target price of $210. According to TipRanks, Moore is not merely a five-star analyst, he's ranked at number 300 of the 10,081 analysts tracked by the service. Moore has had a 61% success rate over the past 12 months with an average return per rating of 16.5%. The note goes on, "Over time, robotics is expected to extend this automation into physical domains, with new model categories emerging to serve each vertical,” the analysts added. “This is all driving its view that the AI infrastructure markets will be $3-5 trillion in CY 2030, a higher number than we are baking in but consistent with the view that AI will have these transformative effects on global markets.”
On the issue of vendor financing, which is at least thought or even concern provoking among some investors, Moore's team wrote... “Nvidia's investment approach is to find leverage points where it can accelerate innovation. As an example, CoreWeave (CRWV) and sovereign investments in the UK and London were designed to speed up [data center] capacity expansions and innovation, and as those methods can be extended to other companies in the space.”
Earnings
Nvidia is expected to report after the closing bell on Nov. 19, still six weeks away. For the fiscal third quarter, Wall Street is looking for an adjusted EPS of $1.24 on revenue of roughly $54.7 billion. That would compare well to the year ago comparison of $0.81, while reflecting revenue growth of roughly 56%. This kind of growth would be "out of sight" for almost any other firm and it is still impressive for Nvidia.
That said, while sales like this would be in line with the pace of growth for the company's fiscal second quarter, this would also be a deceleration from its pace of growth over the past two years. For much of 2023 into 2024, at the dawn of the big capital up-spend on the AI-focused infrastructure build-out, Nvidia was able to boast annual sales growth well into three figures, percentage-wise.
The Chart
I had not written to you specifically on Nvidia since Sept. 18, when I informed you that a surge that morning had disrupted a forming Double Top pattern of bearish reversal. In fact, I wrote, "This morning's surge disrupts that pattern and negates any downside target by retaking its 50-day SMA. That will re-engage the institutional crowd." I had no idea how correct that quote would be.
Taking in the big picture, readers will note that this past spring, Nvidia shares (along with the broader market at large) bottomed for the year and formed a cup with handle pattern of bullish reversal. The stock rallied from that low to a high where it just stopped in late July. Here, I use a Raff Regression model to illustrate that trend for readers. It was there that NVDA hit some stiff resistance.
From late July through late September, NVDA failed at that line of resistance on 16 different trading days. The 17th try was the charm. That line of resistance had formed the upper trendline of what is known as an Ascending Triangle, which is a pattern of bullish continuance. This line, running at the $184 level is now our pivot. That line cracked on Sept. 30 and then acted as support on both Oct. 6 and 7.
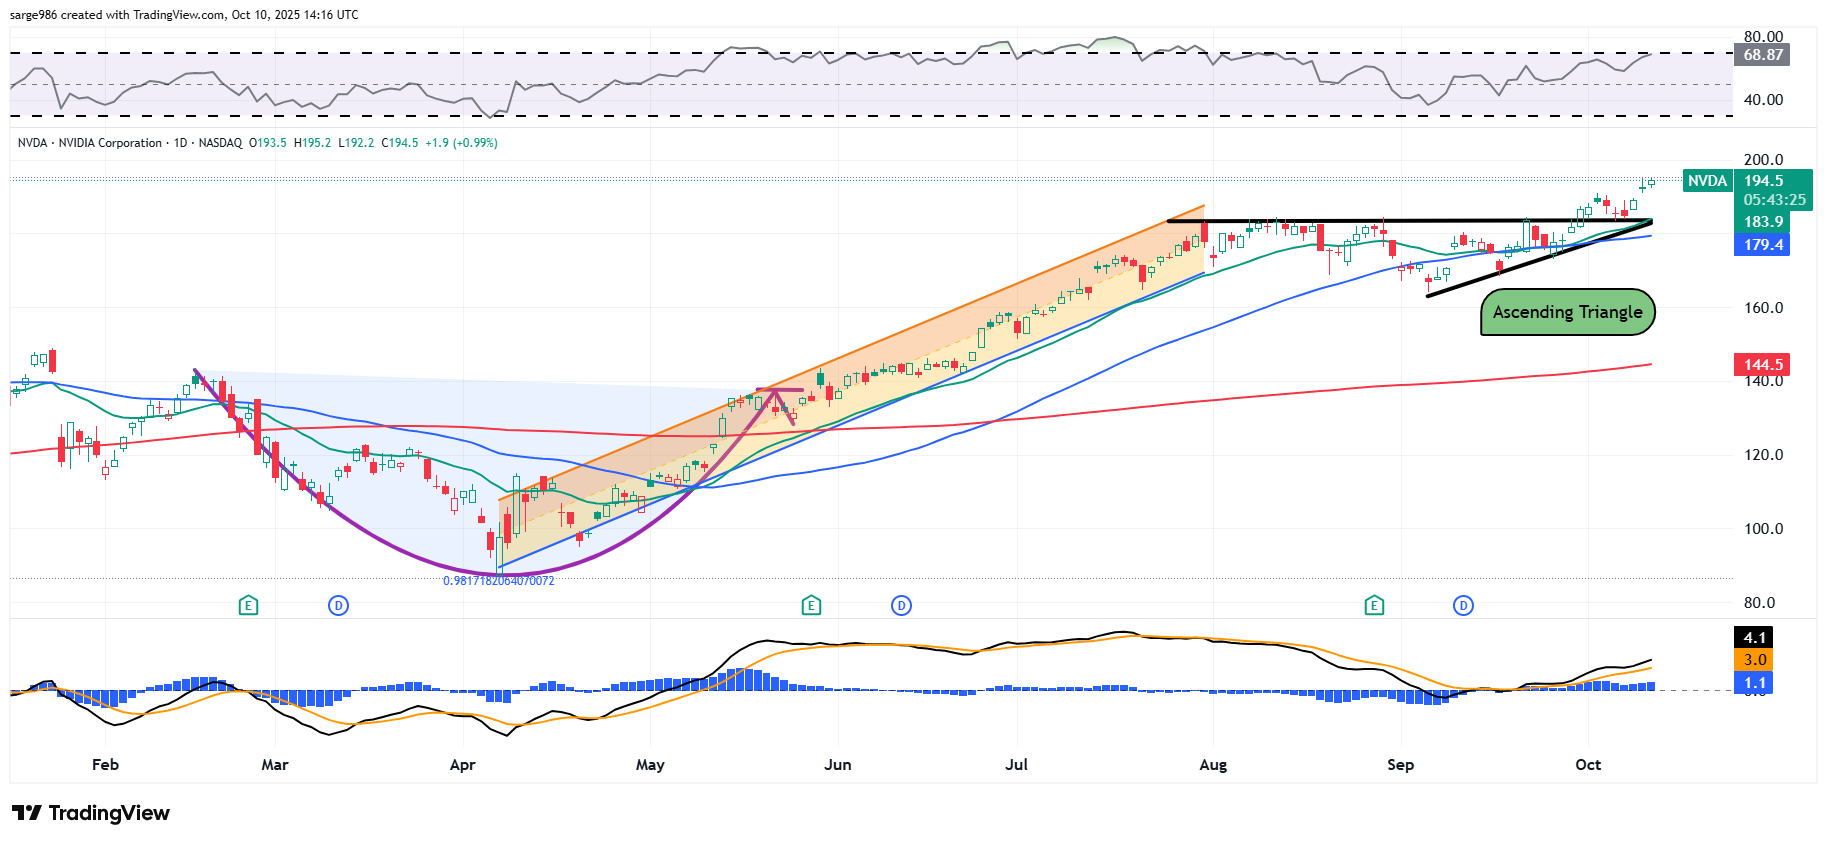
The indicators that I most often use are postured bullishly as well. Relative Strength is quite robust, but not yet technically overbought. Below the chart, readers will note that all three components of the daily Moving Average Convergence Divergence are acting well. The histogram of the 9-day EMA is above the zero-bound and rising, as are both the 12-day and 26-day EMAs. This is with the 12-day line not only running above the 26-day line but actually pulling away from it. These are all short to medium-term bullish signals.
Nvidia Strategy
Target Price: $239
Pivot: $184
Add: down to the 50-day SMA (currently $179)
Panic: Loss of the 200-day SMA (currently $145)
At the time of publication, Guilfoyle was long NVDA equity.
