How to Beat the S&P 500: Own the 417 Stocks That Are at New Highs
The S&P 500 is treading water, while many of its smaller constituents are at all-time highs.
You've reached your free article limit
You've read 0 of 1 free Pro articles.
The Market
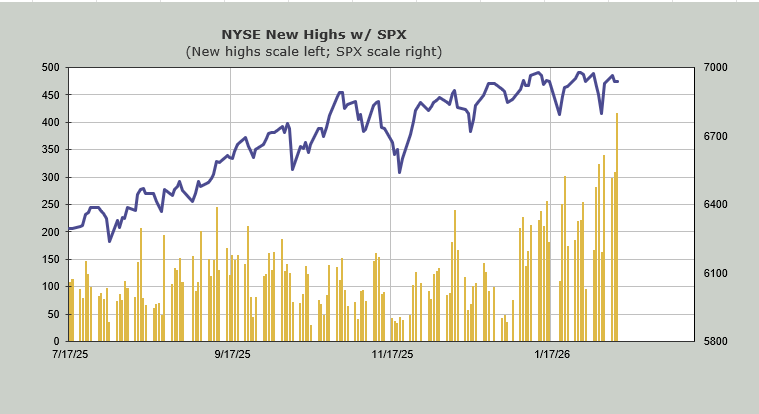
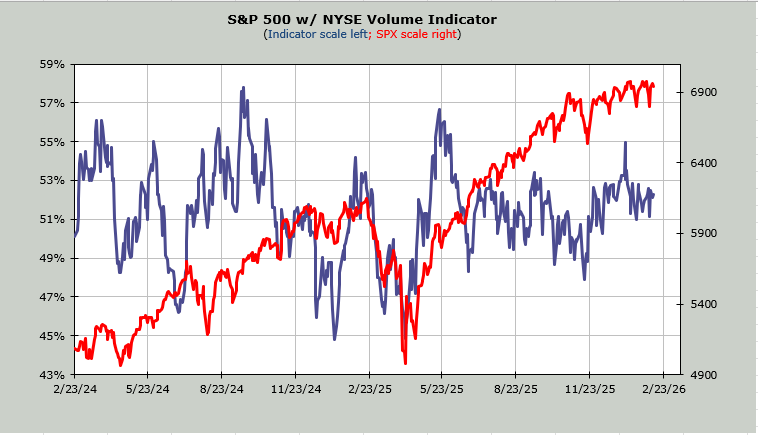
If you wanted to outperform the S&P in 2026—well, really, since October—this is your chance. The S&P is trading pretty much where it began the year (and not much higher than October), and the number of stocks making new highs on Wednesday chimed in at 417 on the NYSE, the most new highs we’ve seen. Notice at the October peak, there were 150 new highs, whereas today there were over 400.
But here’s what I find interesting. Everyone is still mostly focused on technology. Today, the software stocks fell again. This, to me, is part of that process of sorting themselves out, and as I have said, we won’t know which ones are worth it until we see some bases built.
As a reminder, the bases from which we see stocks such as energy or transports rising up from were not built in a day. They were built over months; they rocked back and forth to the point that no one cared about them. Someday software will do that too, but right now the charts still show a lot of emotion, a lot of should I or shouldn’t I?
Can we catch another lift in (IGV) ? Probably, but it will not be nearly as clear as it was last week. Not to me, at least.
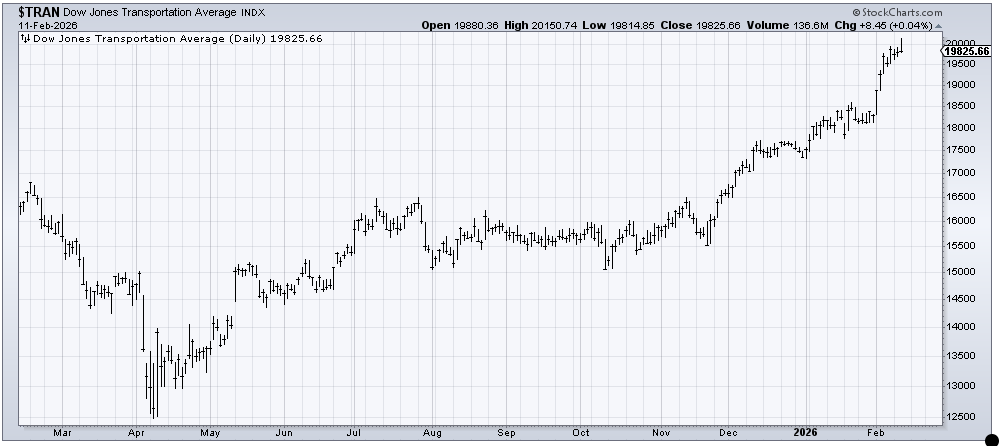
I will repeat that I think the 493 will be overbought late this week/early next week and are likely to see a pullback next week. I know I showed you the chart of the Transports last night, but again, see how they traded today: closing on the low of the day.
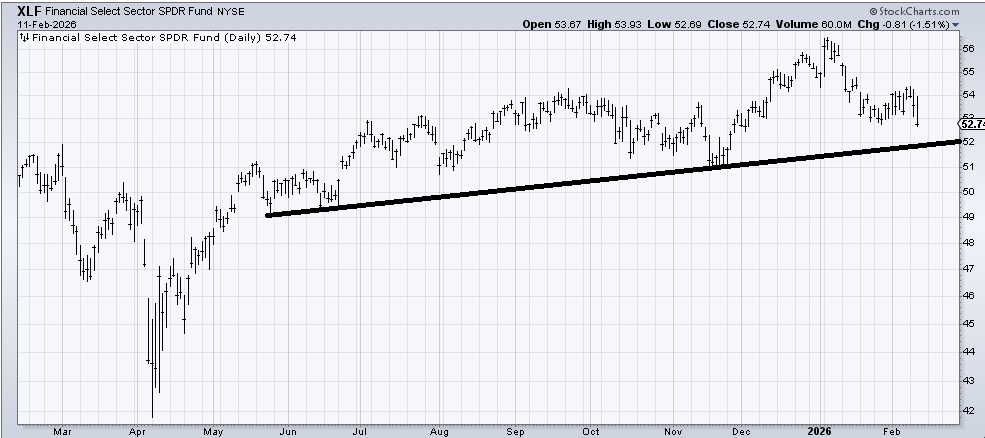
In the meantime, I always look at the banks and rarely look at (XLF) , yet XLF is much more popular than the bank indexes. I bring this up because in early January, I was concerned that the banks were too loved and they pulled back, held, and rallied. But now I see XLF is down on the year and just made a minor lower low. I suspect that line at 52 allows XLF to find support, but it’s time to put this on our radar because that is a group I believe is over-owned.
New Ideas
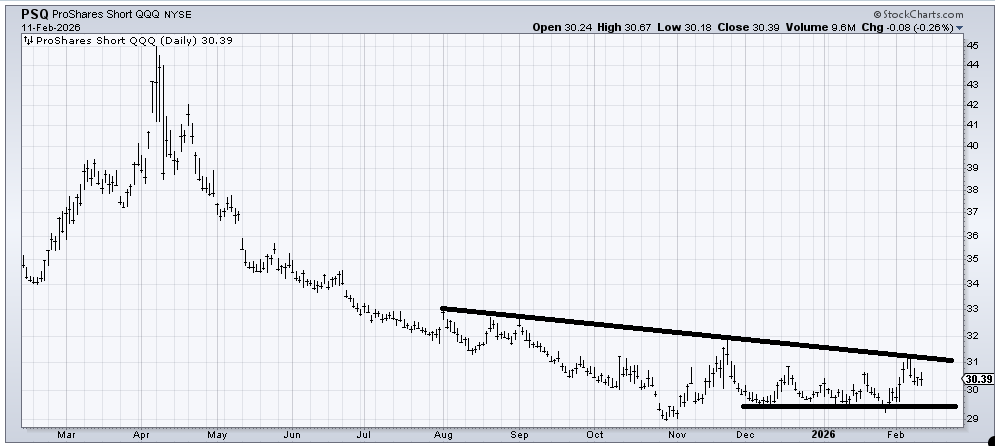
Someone asked me about buying (PSQ) , which is an ETF to be short the QQQs. Let me state that I find these short ETFs, especially the 2 and 3x ones, very problematic, but also should be used as trading vehicles only, which means if you get a pop, you take your money and go. They are flawed, so they should be treated as trades at best.
In any event, the person asked if this looked like a bottom to me. Yes, it does. But I can tell you that if this can’t get up and over 31 next week (when we get back near an overbought condition), it will be just more languishing. So, sure, if I didn’t know it was a short ETF, I’d be bottom fishing, but I can’t turn a blind eye to what the actual security is.
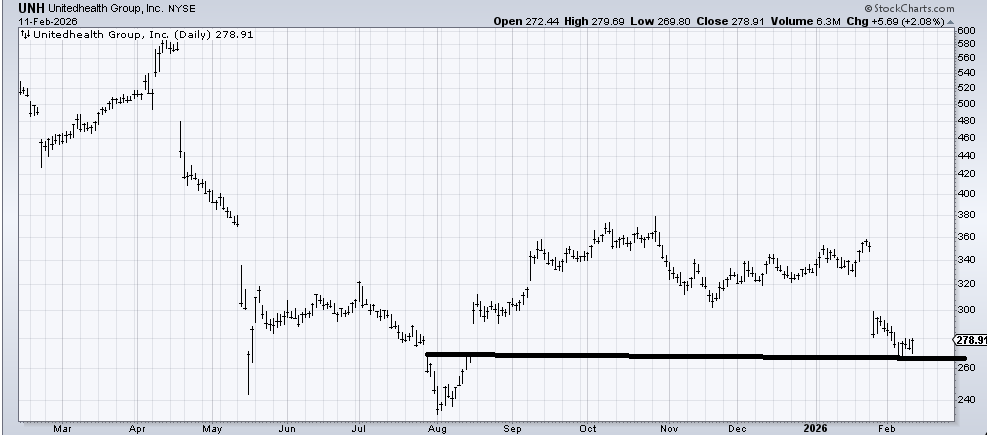
For the person who asked about United Health (UNH) last week, it did bounce, but it was today’s action that caught my eye because they tried to take it down, and instead, it bounces. I still think it is incomplete, but the risk is better now because the stop is under last week’s low.
Today’s Indicator
The Volume Indicator sits at 52%. It is amazing with all that breadth that this just can’t lift.
Q&A/Reader’s Feedback
Helene welcomes your questions about Top Stocks and her charting strategy and techniques. Please send an email directly to Helene with your questions. However, please remember that TheStreet.com Top Stocks is not intended to provide personalized investment advice. Email Helene here.
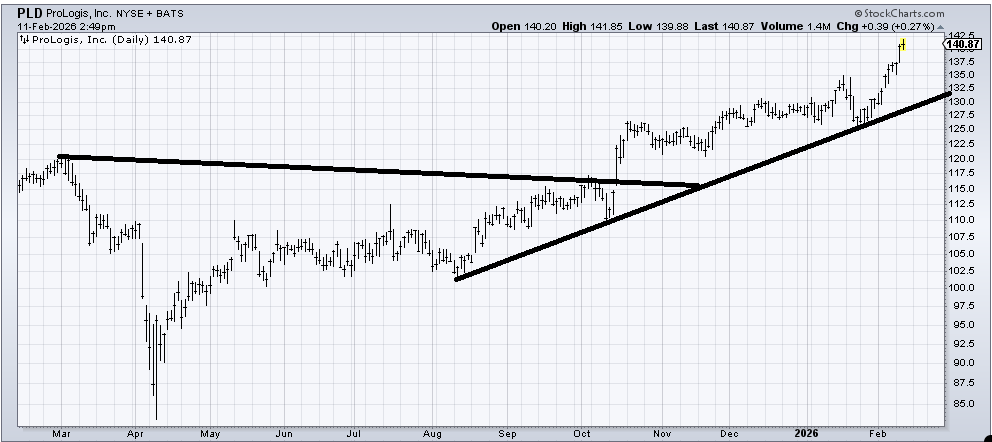
The worst thing I can say about ProLogis (PLD) is that it is at/near its measured target of 145-150. So as long as it stays over that uptrend line, I’d call it a hold. I am a terrible chaser, so it’s hard for me to get excited over the stock up here.
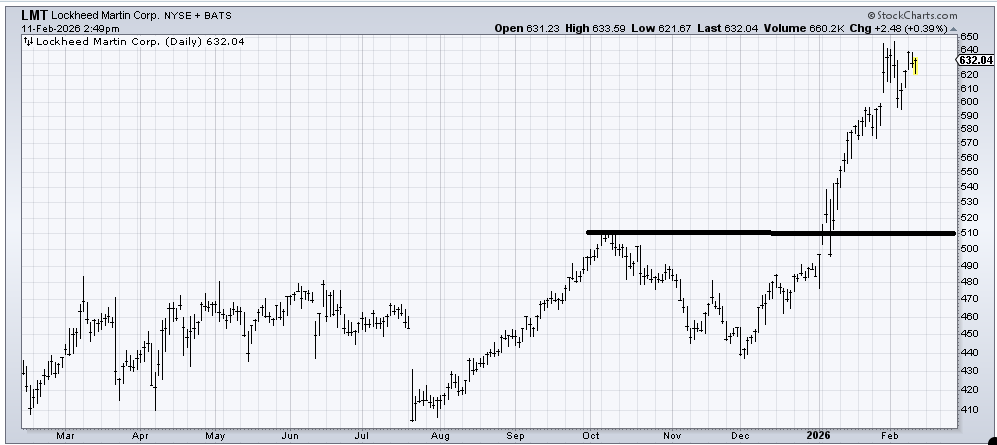
I recommended Lockheed Martin (LMT) back in early December after it appeared to make a head and shoulders bottom. That bottom had a measured target in the 580 area, which was achieved. So while it hasn’t done anything wrong, I wouldn’t argue against taking some profits. But otherwise, I would just use a trailing stop under 590-ish.
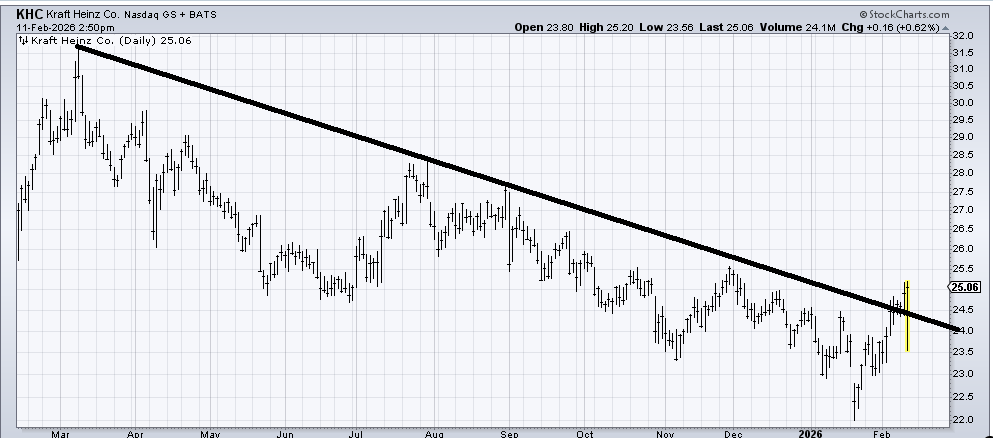
That’s nice daily action in Kraft Heinz (KHC) today, but overall, the fact that it has been able to cross that downtrend line that has been in place for a year is a positive. There is resistance all the way up, so it’s hard to call any spot a breakout. I would say the stock appears to be bottoming, albeit slowly. Pullbacks toward 23.50-24 would be okay to buy.
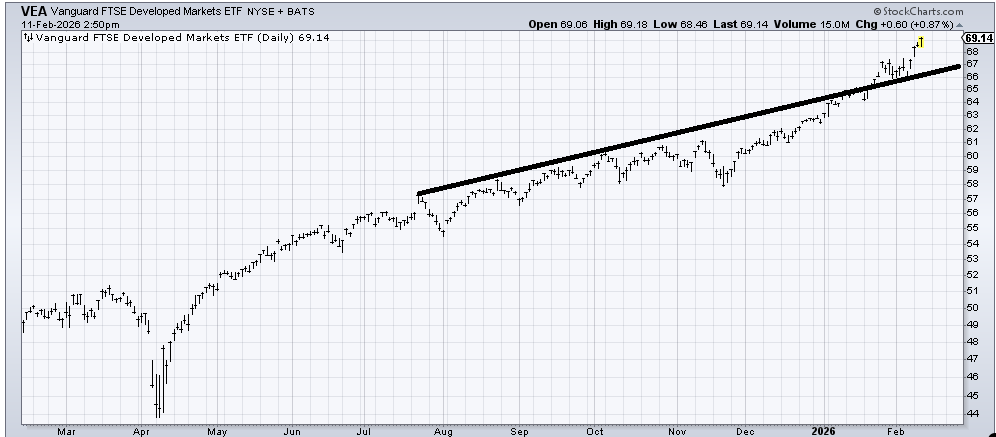
There is not much to say about the chart of (VEA) , an ETF to be long Developed Markets. It’s up and over-extended (although not too much), and pullbacks toward the line should be buyable.
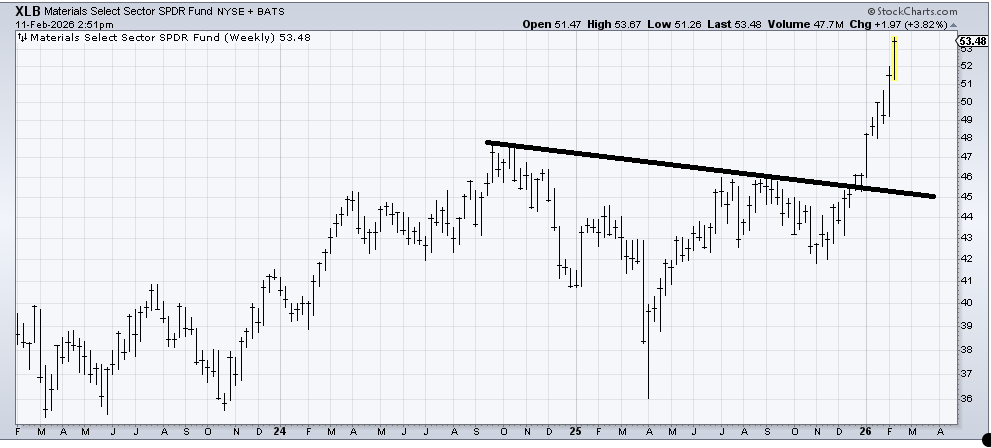
I first warmed up to (XLB) , an ETF to be long the materials sector, back in late November. It hasn’t done anything wrong, but it is (on this weekly chart) over-extended and in the area of a measured target in the low 50s. I would call it a hold.
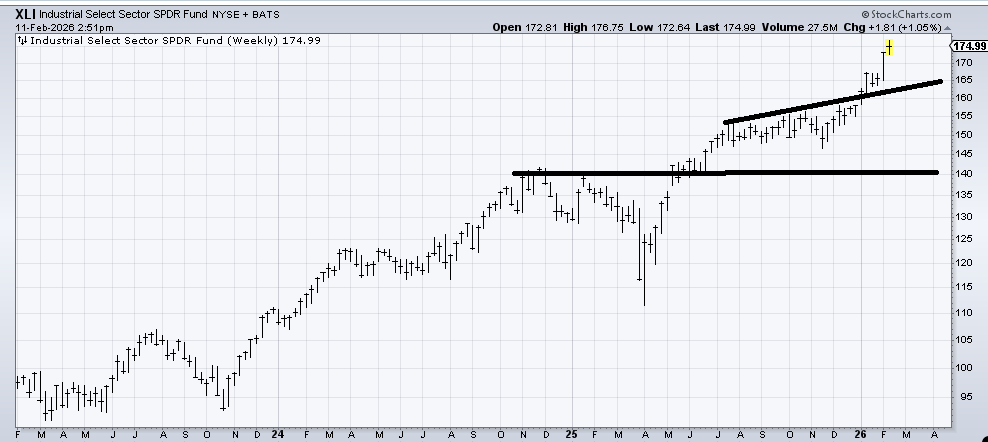
(XLY) , an ETF to be long the Industrials, is not nearly as over-extended on this weekly chart as XLB, but again, I am a terrible chaser, so I’d say pullbacks to the upper line (163-165) would be buyable.
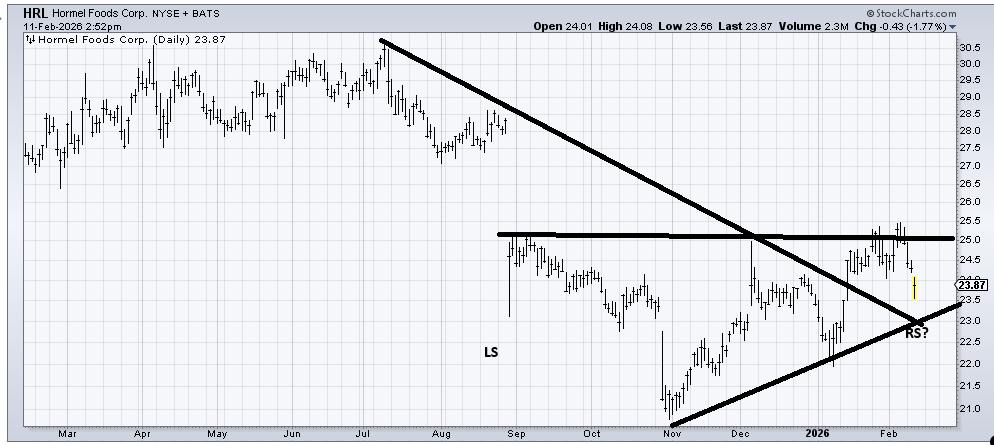
Hormel (HRL) is trying to map out a bottom. As long as it doesn’t break under that 22-23 area, it ought to be okay down here.