How Low Can We Go? Maybe It Depends on the New Lows.
A tough day in the market that requires a full discussion of the number of stocks making new lows.
You've reached your free article limit
You've read 0 of 1 free Pro articles.
The Market
Aside from the fact that I hate when the market doesn’t do what I think it will, I have made some notes about today’s action that I hope are unemotional.
Breadth was bad, but not as bad as it was two weeks ago. Small caps and the equal-weighted S&P both outperformed the S&P itself, so what we saw today was a continuation of last week.
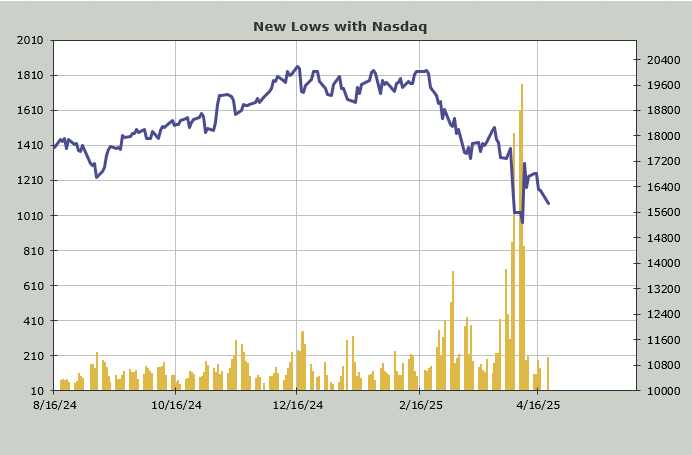
The number of stocks making new lows requires a full discussion. There was a minor increase in stocks making new lows today. I can’t call it a positive divergence because there was no lower low in any of the indexes. However, if we use Nasdaq because that is the weakest right now, the closing low on April 8th was 15267. Today, Nasdaq closed at 15870. The way the market traded today that could be achieved by the end of the week!
But the point is, on April 9th we saw Nasdaq with 1757 new lows. Today, that number was 198. Is it possible that if Nasdaq slid another 600 points, Nasdaq would see more than 1757 new lows? It is. Is it likely? I don’t think so.
The NYSE had 1161 new lows on April 9th. Its closing low is 4982. Today, the NYSE saw 106 new lows. If the S&P fell another 200 points, would we see the number of stocks making new lows jump by ten times? I doubt it.
However, as I have explained, the peak reading for new lows was in October 2008. The S&P managed to make many more new lows after that (it made its low in March of 2009), but each time there were fewer new lows—which is how we get bases built. It’s a process. But it begins with fewer stocks making new lows.
Chatter-wise, gosh, folks seem downright bearish. The put/call ratio shows bearishness at 1.02 but no panic. The ISE folks continue to merrily buy calls, though, as that call/put ratio cannot seem to fall under 1.0.
Also on the chatter front, it is starting to feel like a Realization Week when it comes to ‘the end of the American Exceptionalism’ trade. If the DSI for the buck was closer to single digits, I’d think we were there, but it hovers in the 20s.
I would still love to see us rally one more time this week. If for no other reason than to relieve some of the bearishness that has built up in the last 24 hours.
New Ideas
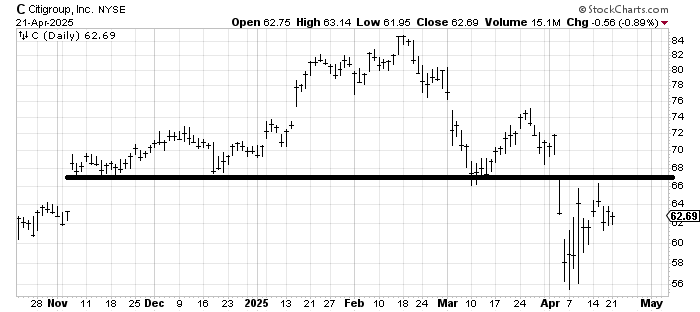
As the weeks go on, I am hoping we see some charts begin to differentiate themselves. I don’t love the chart of Citigroup C (look at all that resistance overhead), but I also need to acknowledge that there was no selling in the stock today. So when we talk about stocks making new lows, we want to see more of this over time.
Today’s Indicator
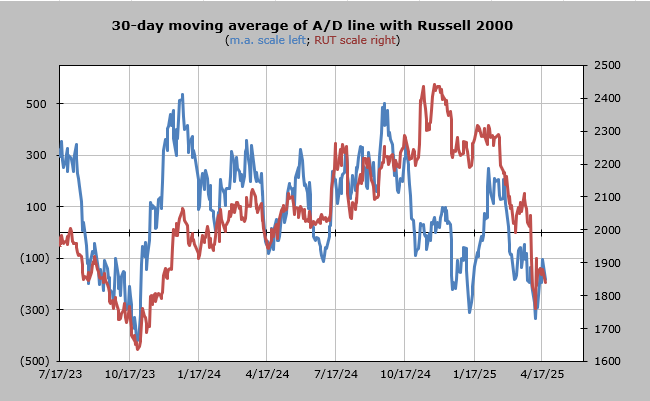
The 30-day moving average of the advance/decline line is not really oversold. It should ‘rally’ for another day or so and then come right back down.
Q&A/Reader’s Feedback
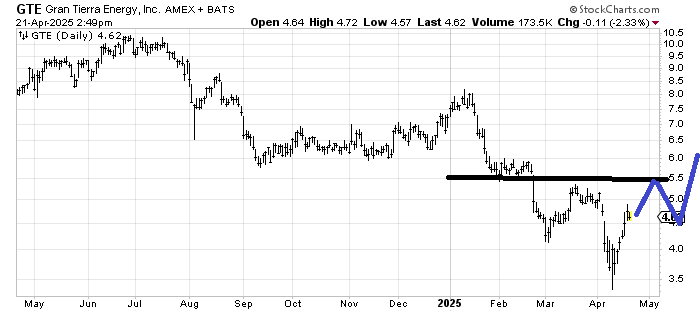
Gran Tierra Energy GTE might be trying to make a bottom on the daily chart, but the resistance at 5-5.50 is strong. If it can map out over the ensuing months as I have drawn in, then I might be a bit more friendly toward it.
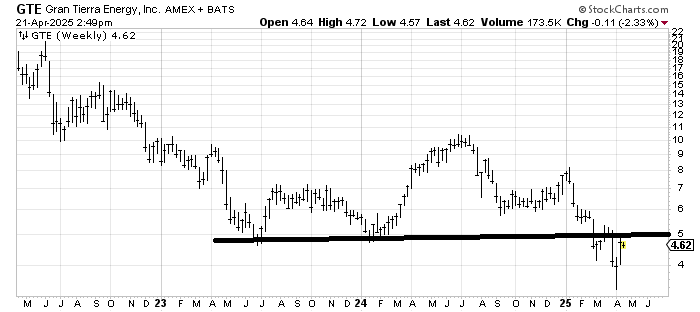
However, look at the 5-5.50 resistance on the weekly chart as well.
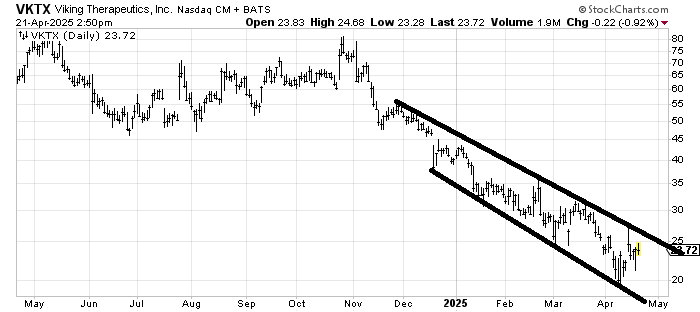
Viking Therapeutics VKTX has been in a down channel for the last several months. Unless or until that changes, I see no reason to bottom fish it. Resistance is strong all the way up. If it falls to the lower line, then it’s probably buyable for a trade, but that’s all I see here.
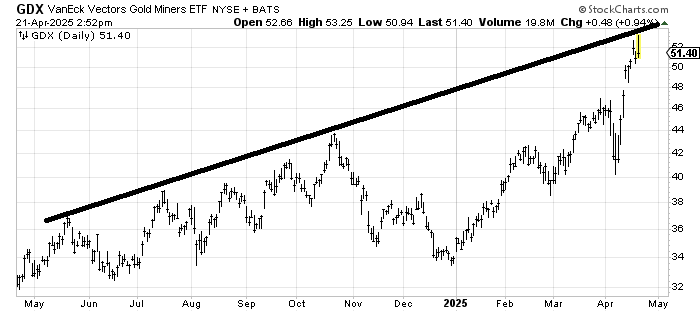
GDX, an ETF to be long gold stocks, has lagged Gold itself quite a bit, and today was no exception as it tried to make a higher high and gave it up. Then there is that resistance line up there as well. There is a measured target in the 54 area, but it got to 53.25 today. Keep in mind the DSI keeps knocking on the door of 90, so this is the time to take a little off the table and wait for a correction.