How I'm Playing Applied Materials After Stock Fails 'Potentially Huge' Test
Let's review the fundamentals, and the all-important price action on the chart, as the semiconductor maker goes to the tape with earnings.
You've reached your free article limit
You've read 0 of 1 free Pro articles.
On Thursday evening, semiconductor equipment provider Applied Materials AMAT released its fiscal second quarter financial results. For the three-month period ended April 27, Applied Materials posted adjusted EPS of $2.39 (GAAP EPS: $2.63) on revenue of $7.1 billion.
The top-line print was good enough for year-over-year growth of 6.8%, but not enough to beat Wall Street's expectations. The adjusted bottom-line number beat the consensus view, as did the reported or GAAP number. Adjustments were made primarily for the resolution of prior years' tax items and for unrealized investment gains and losses.
Operations
As generated revenue grew 6.8% to $7.1 billion, the cost of those sales increased 3.5% to $3.615 billion. That left a gross profit of $3.485 billion (+10.5%), as gross margin improved from 47.4% to 49.1%.
Total GAAP operating expenses grew 6% to $1.316 billion, leaving a GAAP operating income of $2.169 billion (+13.4%). That took operating margin up to 30.5% from 28.8%. Once adjusted, operating margin improved from 29% to 30.7%.
After accounting for interest, non-operating income & expenses and taxes, GAAP net income printed at $2.137 billion (+24.1%). This left GAAP earnings of $2.63 per fully diluted share. Adjusted net income improved 11% to $1.94 billion or $2.39 per fully diluted share.
Segment Performance
-- Semiconductor Systems: Drove revenue of $5.255 billion (+7.2%), producing operating income of $1.9 billion (+11.7%) on an operating margin of 36.2% (up from 34.7%).
-- Applied Global Services: Drove revenue of $1.566 billion (+2.4%), producing operating income of $446 million (+2.3%) on an operating margin of 28.5% (flat from the year-ago comp).
-- Display: Drove revenue of $259 million (+44.7%), producing operating income of $68 million (up from $5 million) on an operating margin of 26.3% (up from 2.8%).
Guidance
For the current quarter, Applied Materials projects total revenue generation of $7.2 billion at the midpoint, which was in line with consensus view. The company is also projecting an adjusted gross margin of 48.3% and adjusted EPS of $2.35 at the midpoint, which was a few cents better than the $2.31 that Wall Street had in mind.
Fundamentals
For the quarter reported, Applied Materials generated operating cash flow of $1.571 billion. Out of that number came capex spending of $510 million. This left free cash flow of $1.061 billion, down 6.5% from the year-ago comp. "Out of that number," the company repurchased $1.67 billion in common stock, while dishing out $325 million in cash dividends to shareholders.
Turning to the balance sheet, AMAT ended the period with a cash position of $6.747 billion, which was notably down 28% from six months ago. Inventories clocked in at $5.656 billion, putting current assets at $19.708 billion. Current liabilities add up to $7.996 billion, including short-term debt of $799 million. These numbers put the company's current and quick ratios at 2.46 and 1.76, respectively. These ratios are undeniably strong, but it may be noteworthy that they are down from 2.5 and 1.86 six months ago.
Total assets amount to $33.632 billion, including goodwill and other intangibles of $3.997 billion. At less than 12% of total assets, this is not a problem. Total liabilities less equity comes to $14.671 billion, including long-term debt of $5.462 billion.
This is an undeniably robust balance sheet. This is also a balance sheet not quite as robust as it was six months ago.
My Thoughts
Readers likely already know that I am long one of Applied Materials' competitors, Lam Research LRCX. Across the group, both Lam Research and KLA Corp. KLAC had better quarters versus expectations and in my probably biased opinion, issued stronger guidance.
During the call, AMAT management seems to allow for continued headwinds in China. That should impact the whole industry, but it did seem to put a pall over the call. That is probably why the stock is down 7% as of this writing Friday while the two competitors above are down less than 2%.
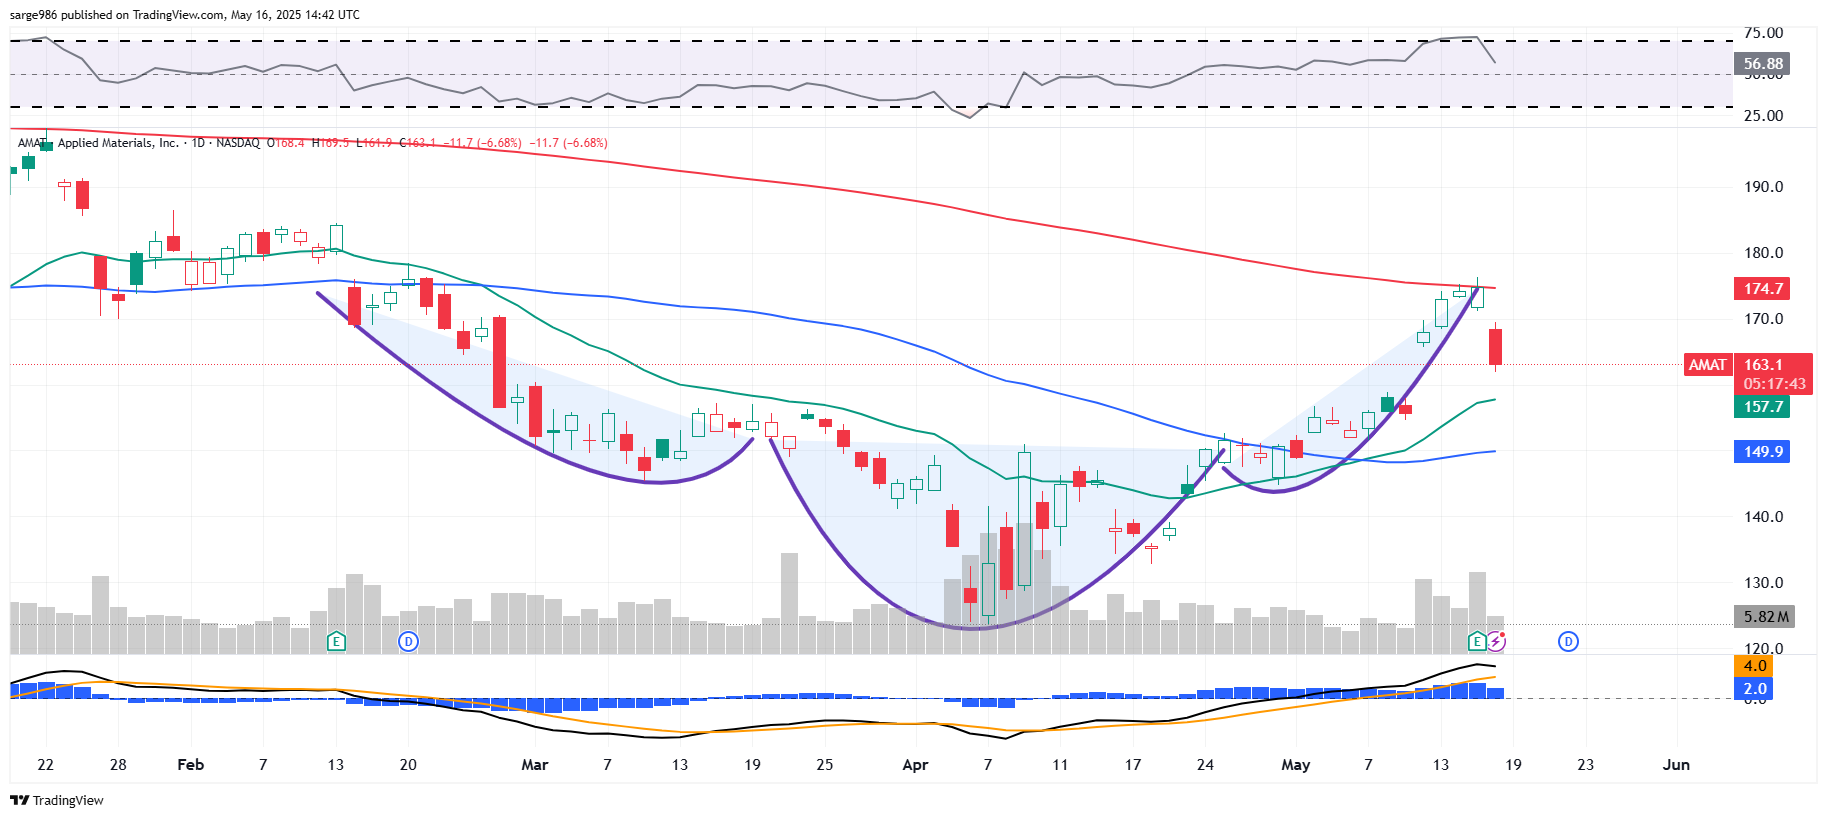
In the chart above, you will see that AMAT completed an inverse head-and-shoulders pattern that stretched from early February into this week. This is a bullish pattern, but with a neckline at $153, the stock did apex 15.3% above pivot on Thursday.
The stock also hit resistance and failed at its all-important 200-day simple moving average (SMA) three days in a row. That's potentially huge. Relative strength has come off of a technically overbought reading, while the daily moving average convergence divergence (MACD) has obviously weakened, though it is not yet bearish in posture.
Buy this dip?
No. Aside from the fact that I prefer LRCX, I don't like AMAT on the dip this far above its 50-day SMA.
I would much rather either initiate this name on a test of that 50-day line from above, or on momentum after having already taken and held the 200-day line.
Not today, AMAT, not today.
At the time of publication, Guilfoyle was long LRCX equity.
