Hot Trades Crushed. Is the Speculative Air Finally Coming Out?
A weak day in the Nasdaq, but it wasn't the mega-caps that got hit. It was those speculative names from earlier this fall.
You've reached your free article limit
You've read 0 of 1 free Pro articles.
The Market
The selling in the mega-cap tech stocks was relatively tame today. It was the selling in all that hot stuff from September and October that was crushed. This is the air coming out of all that speculative (nonsense) I harped about for what seemed like forever, a few months back.
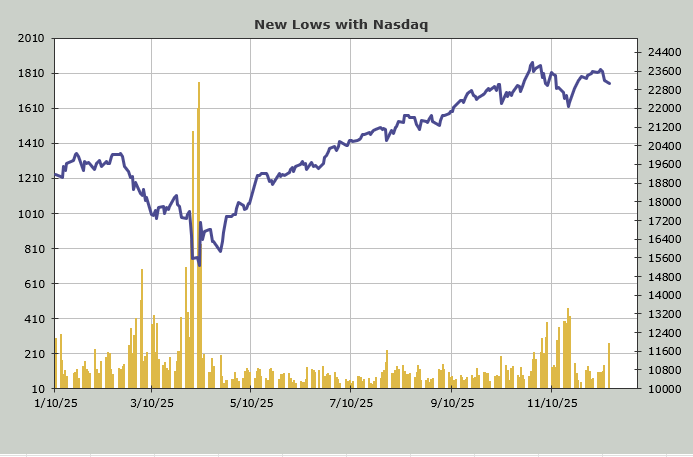
The proof that there was a lot of selling in these Nasdaq names shows up in the number of stocks making new lows on Nasdaq. At 265 new lows, that’s nearly double the number of new lows we saw on Friday. The only good news is that the new lows have not topped the reading of 467 we saw just prior to Thanksgiving. Not yet, at least.
This is all part of the ongoing discussion I have been having about Nasdaq and mega-cap stocks. While we can get a rally at any time, I do not expect this to end as it has done so all year. There is a shift.
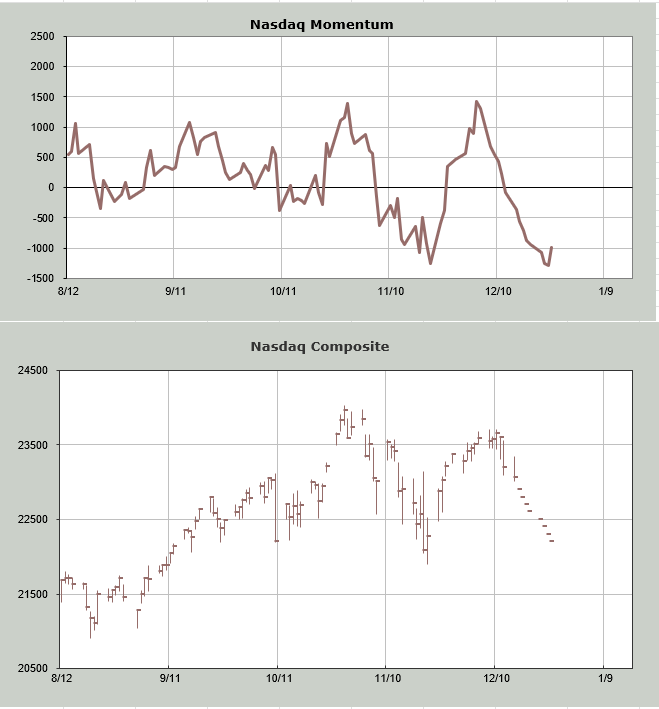
Two weeks ago, I showed you how Nasdaq was overbought. One of the indicators I used was the Nasdaq Momentum Indicator. As a reminder, this is based on price (my own Oscillator is based on breadth), so what I do is I walk Nasdaq up or down to see at what point we’ll be overbought or oversold. The exact day doesn’t matter; it’s more the time frame.
So today, I revisited this indicator and walked Nasdaq down about one thousand points to see the day the Momentum Indicator stops going down and turns up. For now—and this will change as the market trades in the next two weeks—that day falls right before Christmas. Let me remind you that the ‘official’ time frame for the Santa Claus Rally is that final week of the year, not right now.
I am not much into seasonality, but I found this interesting. Also, I do not expect Nasdaq to be down every single day between now and then since that would be ridiculous. But this should give us a general idea as to when the oversold setup is good again.
Let me end by noting the Utes notched their third straight green day, something they haven’t done in months. I remain positive on this group.
New Ideas
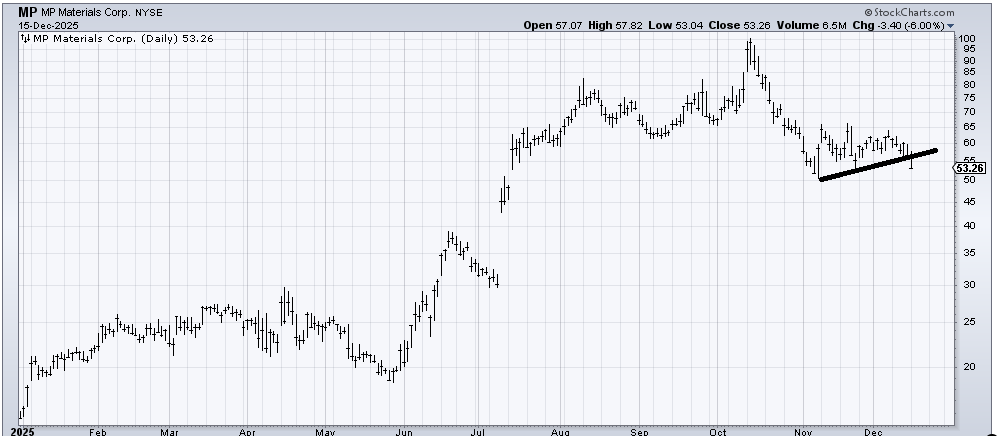
It’s time for me to admit defeat on MP Materials (MP) . Sure, it’s oversold enough to bounce, but the action has me thinking it’s not worth it now. I was wrong when it broke 55.
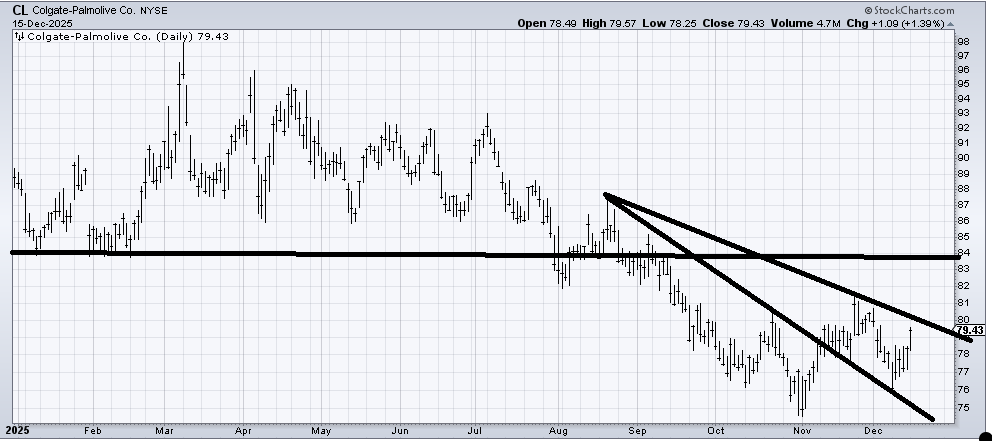
To answer some questions, I do not have a target on Colgate (CL) yet. I suspect this 80-81 area stops it on the first trip up. But crossing that line (around 80) would be the next step in moving it along in terms of building a small base (with a lot of overhead resistance). I’d like to think over time, it can make its way to the mid-80s, where resistance gets quite heavy.
Today’s Indicator
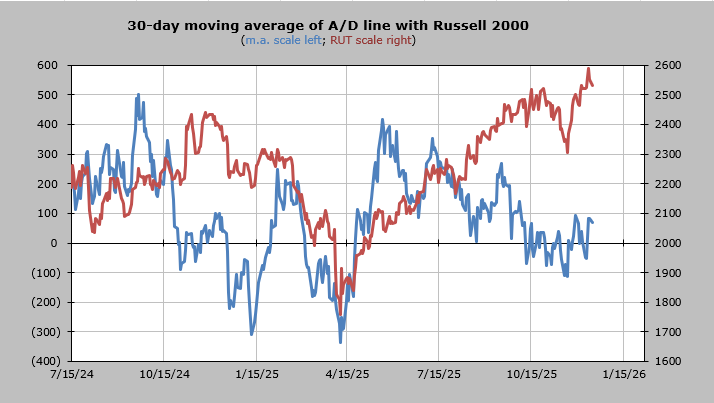
The 30-day moving average of the advance/decline line perked up, but by midweek, I expect it will start heading down again.
Q&A/Reader’s Feedback
Helene welcomes your questions about Top Stocks and her charting strategy and techniques. Please send an email directly to Helene with your questions. However, please remember that TheStreet.com Top Stocks is not intended to provide personalized investment advice. Email Helene here.
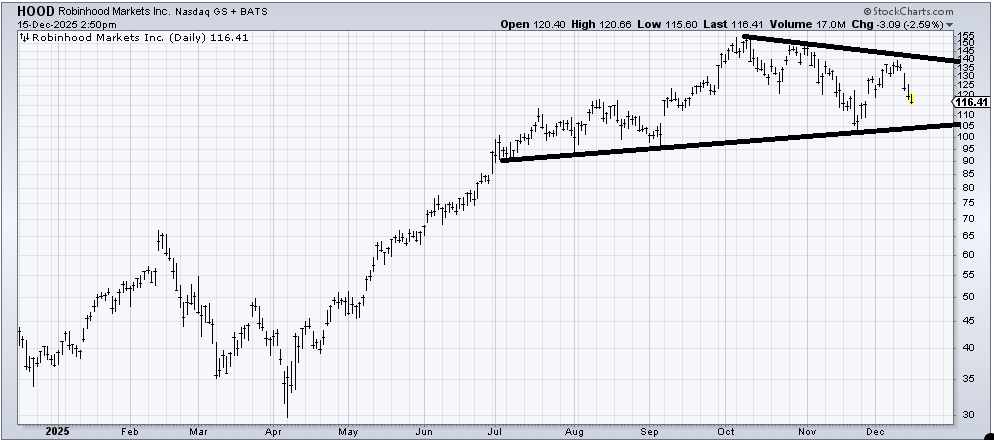
I want to discuss the big picture chart of Robinhood (HOOD) vs. just what I think of the current chart. I have a pile of stocks that look like this. Essentially, they have gone nowhere since last summer. Sure, HOOD is up since then, by barely. There are now lower highs since October, but no lower lows, no breaks.
What I would watch for in the coming weeks is if the pattern stays the same: no lower lows, but lower highs stay as well. Or do we get a lower low? Can we get a higher high? We can, but I don’t think the market is set up for that right now, not with the VIX so low.
On a very, very short-term basis, it would fill that tiny little gap around 115-116, which ought to lead to a bounce. A better test would be back near 105. My expectation is that in the next few days, HOOD sees a bounce, but the big picture doesn’t have me inspired for more than a bounce.
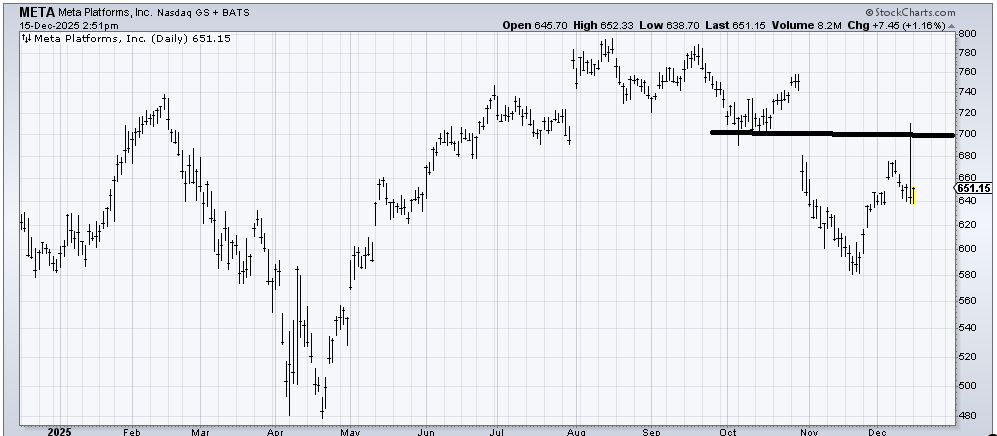
There was what appears to be a bad print on the chart of Meta (META) on Friday. Either way, I expect it to bounce again. I’d like to see it fill that gap near 700, but breaking 640 would have me thinking I’m wrong.
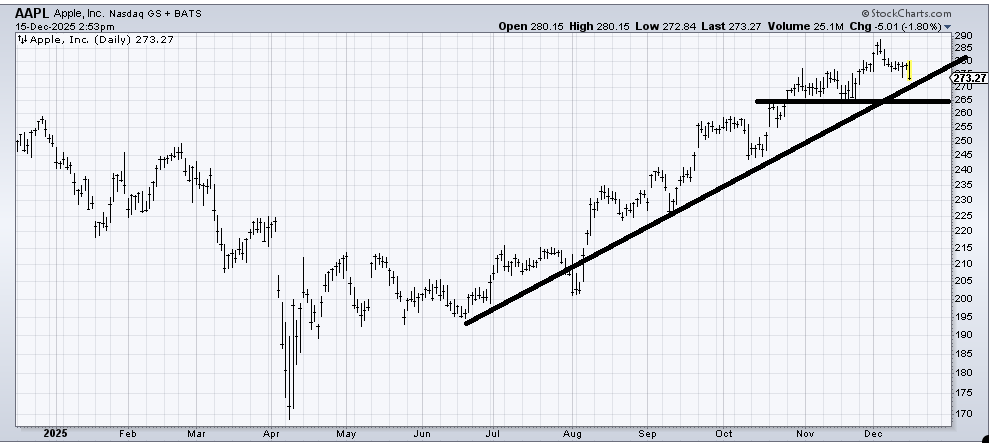
The uptrend line I’ve drawn on the chart of Apple (AAPL) is not the best line because it does break for a few days in early August. It’s not my kind of chart just because it is up so much already, but it hasn’t done anything wrong. I would get concerned if that 265 area breaks. Also, I would like to see one more push to 300 just because there is an unfulfilled target up there.