Here’s How Gold Prices Can Reach $5,000
Gold's rally has cooled. But there's a silver lining for the yellow metal.
You've reached your free article limit
You've read 0 of 1 free Pro articles.
Gold has been quiet lately, but just a few short months ago, it was one of the hottest commodities on the planet.
At the beginning of this year, gold traded near $2,640 per ounce (point A). By April, the price of the yellow metal had climbed to $3,509 — a gain of about 33% in just four months (point B).
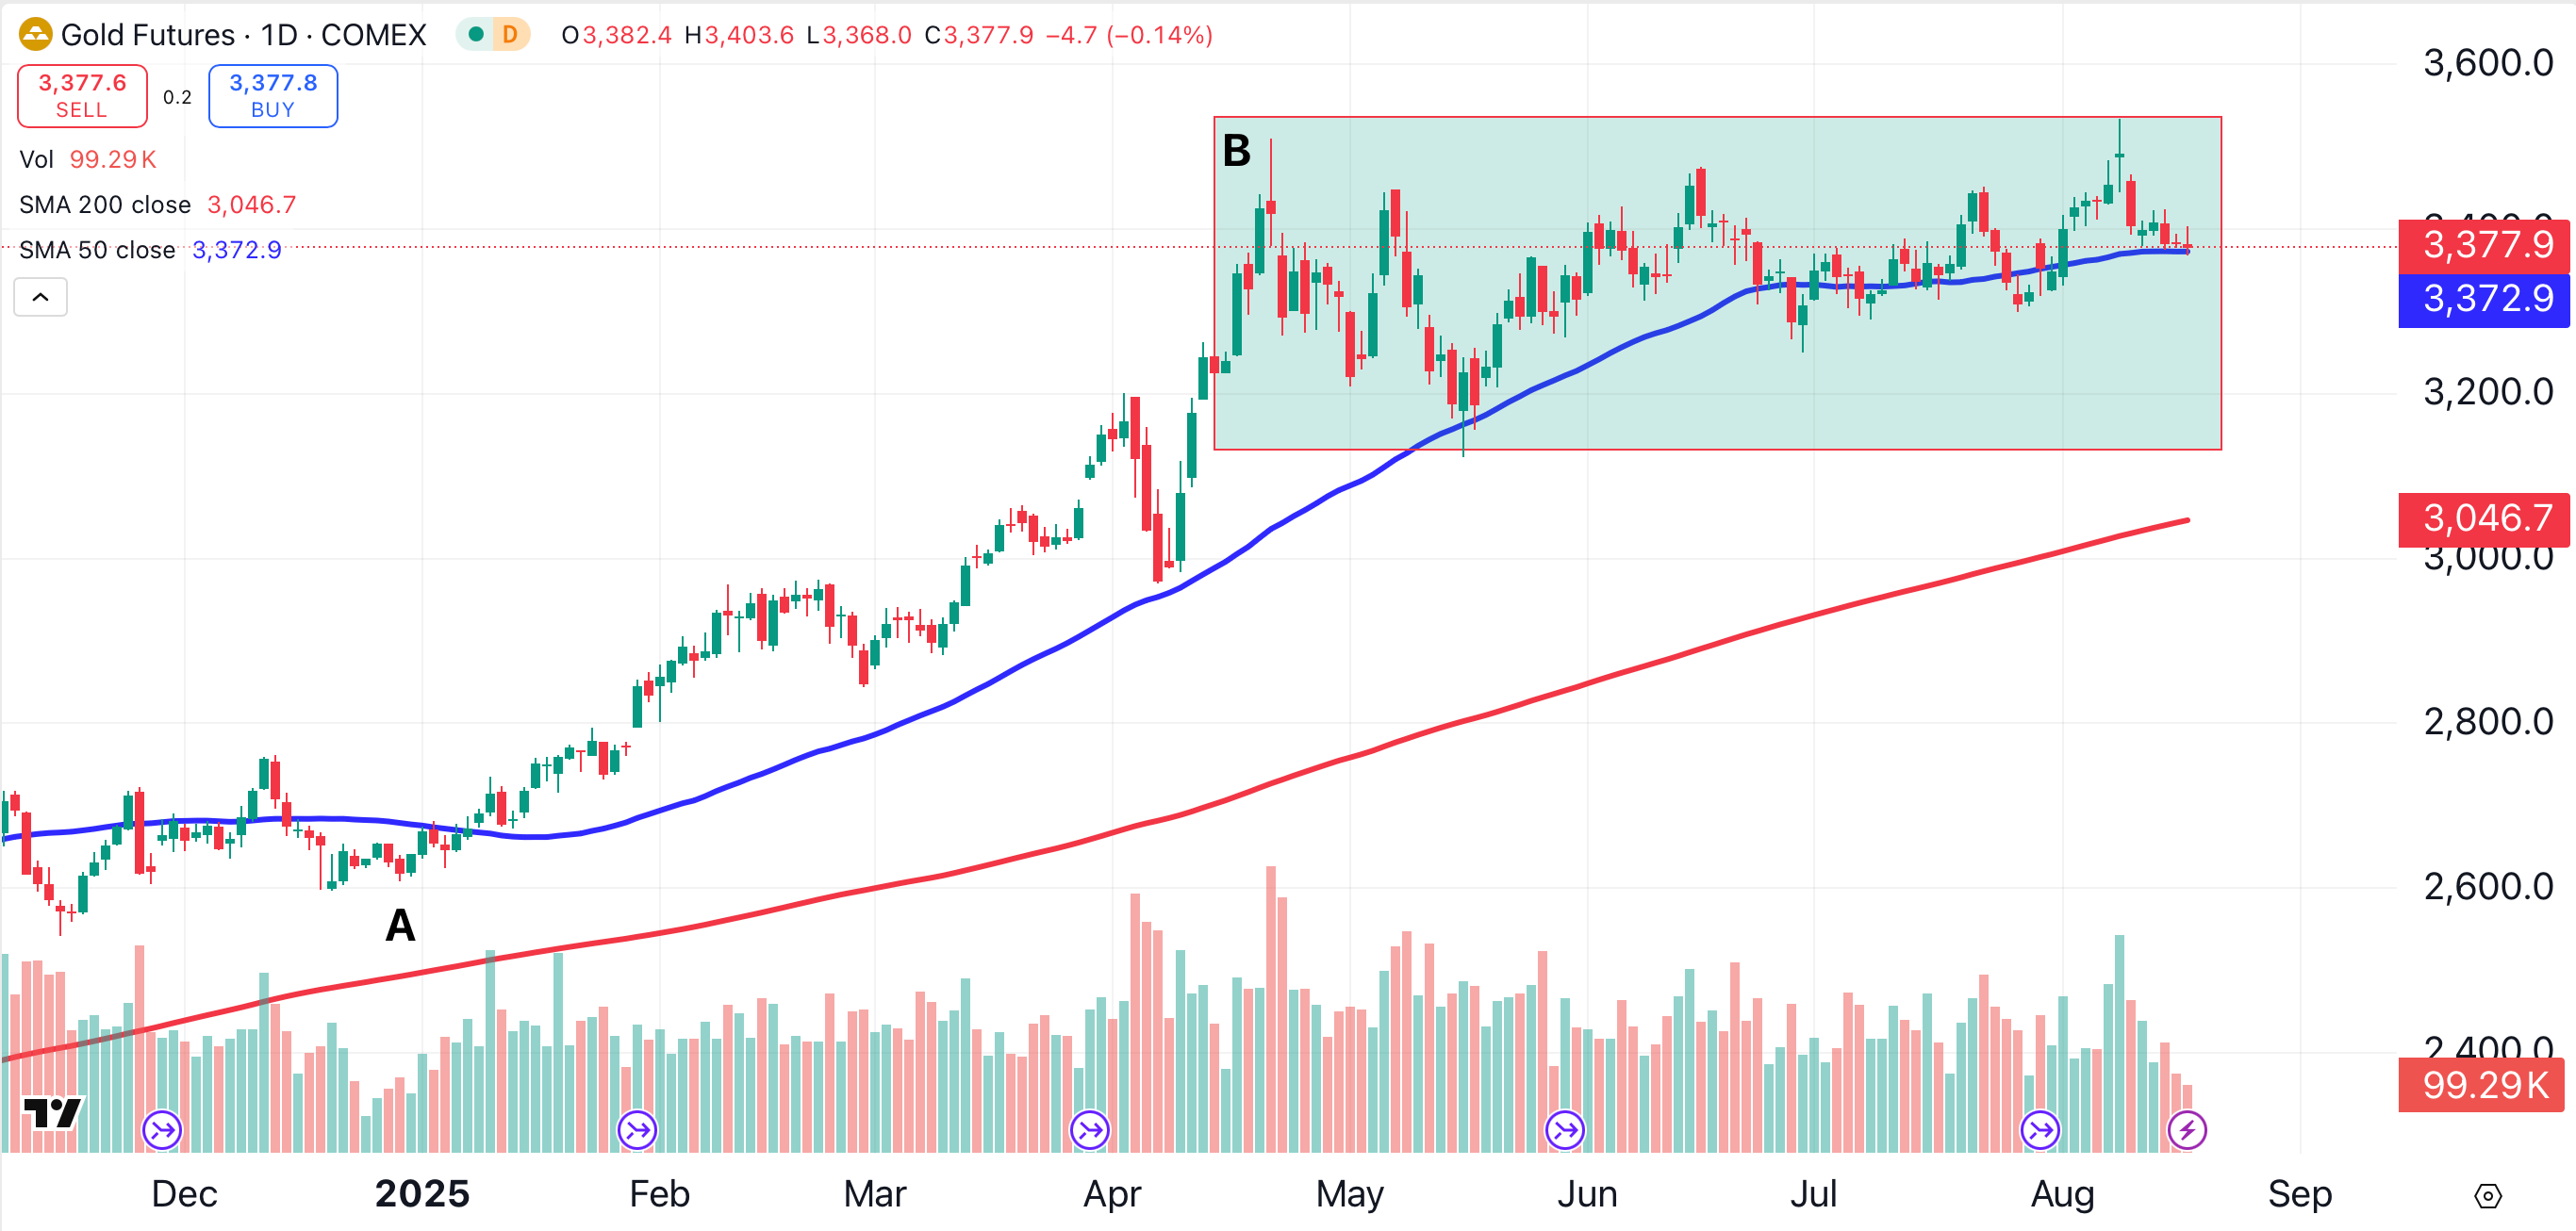
Since then, little has changed for gold investors. Over the past four months, gold has been trading in a range between $3,123 and $3,534 (green shaded area).
Gold’s 50-day moving average (blue), once tilted firmly upward, has gone flat. The 200-day moving average (red) is still climbing, but its rate of ascent has moderated.
Based on the daily chart, it’s fair to say that gold is consolidating after a major rally. When that consolidation ends, the most likely resolution is a breakout in the direction of the previous trend.
The Big Picture for Gold
That's bullish, but not as bullish as gold’s monthly chart.
In this time frame, gold has skyrocketed after breaking out of a massive cup-and-handle pattern (shaded yellow). The 50-month (blue) and 200-month (red) moving averages are accelerating to the upside. The green area of consolidation now appears to be insignificant compared to the historic rally that preceded it.
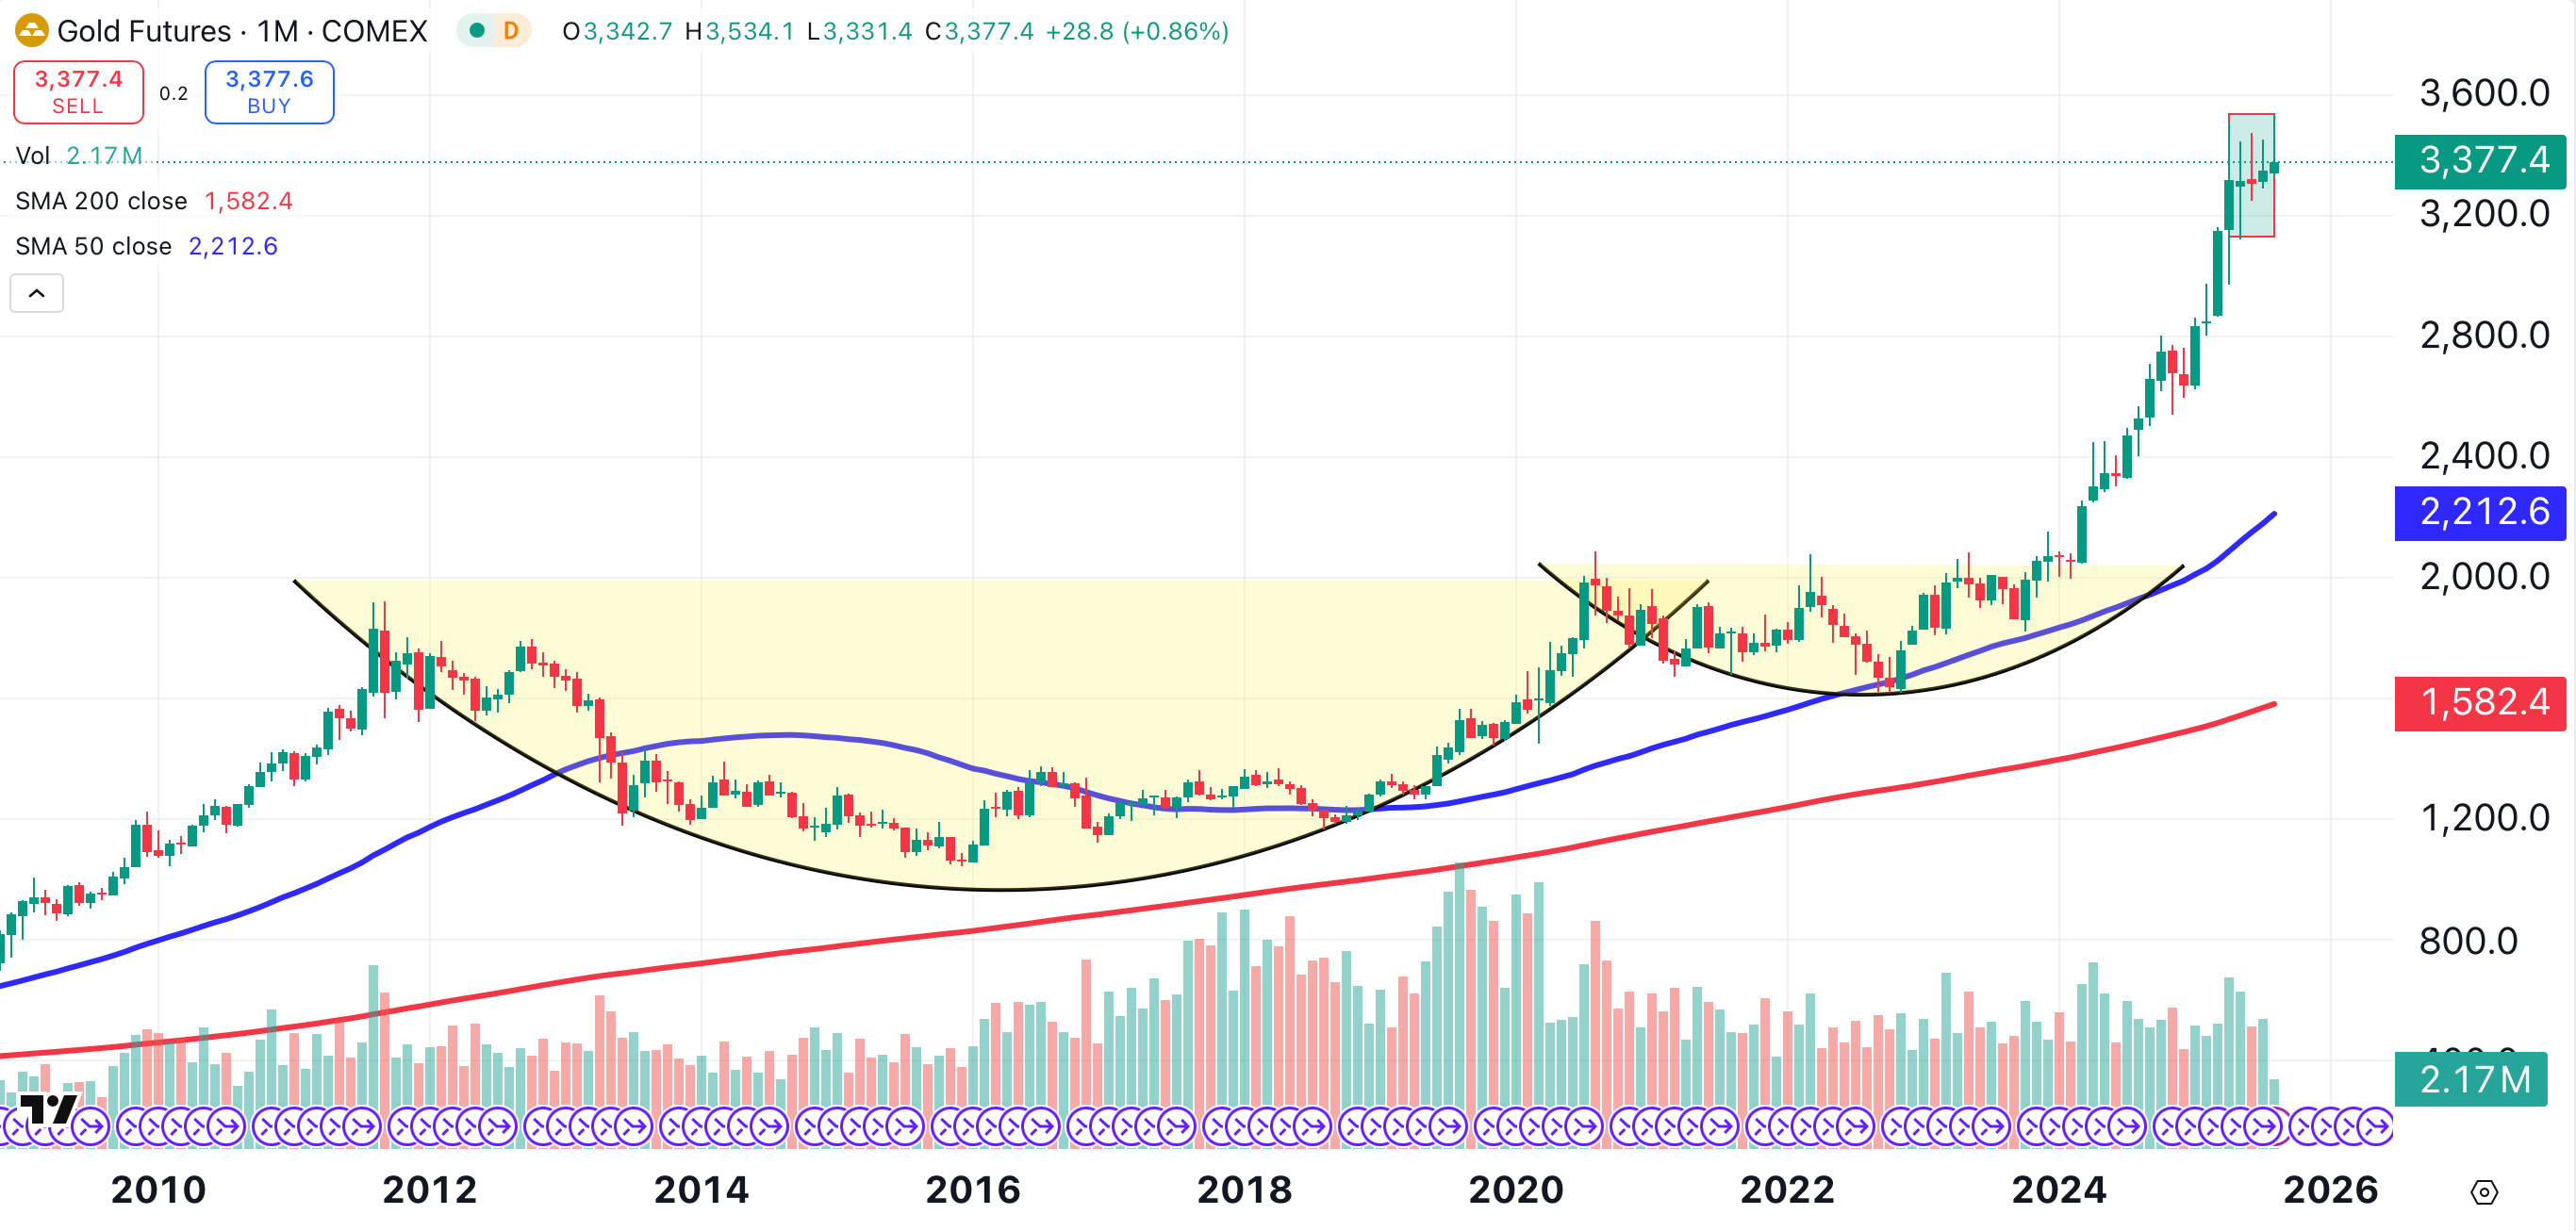
In this time frame, the breakout occurs near the $2,000 mark, and runs to a peak of $3,500 — a move of $1,500. An equivalent post-consolidation move would place gold at $5,000.
The Catalyst for a New Gold Rally
What has to happen for gold to reach $5,000?
Gold has historically acted as a hedge against inflation. The massive rally in gold over the past two years came right on the heels of the worst bout of inflation in over 40 years.
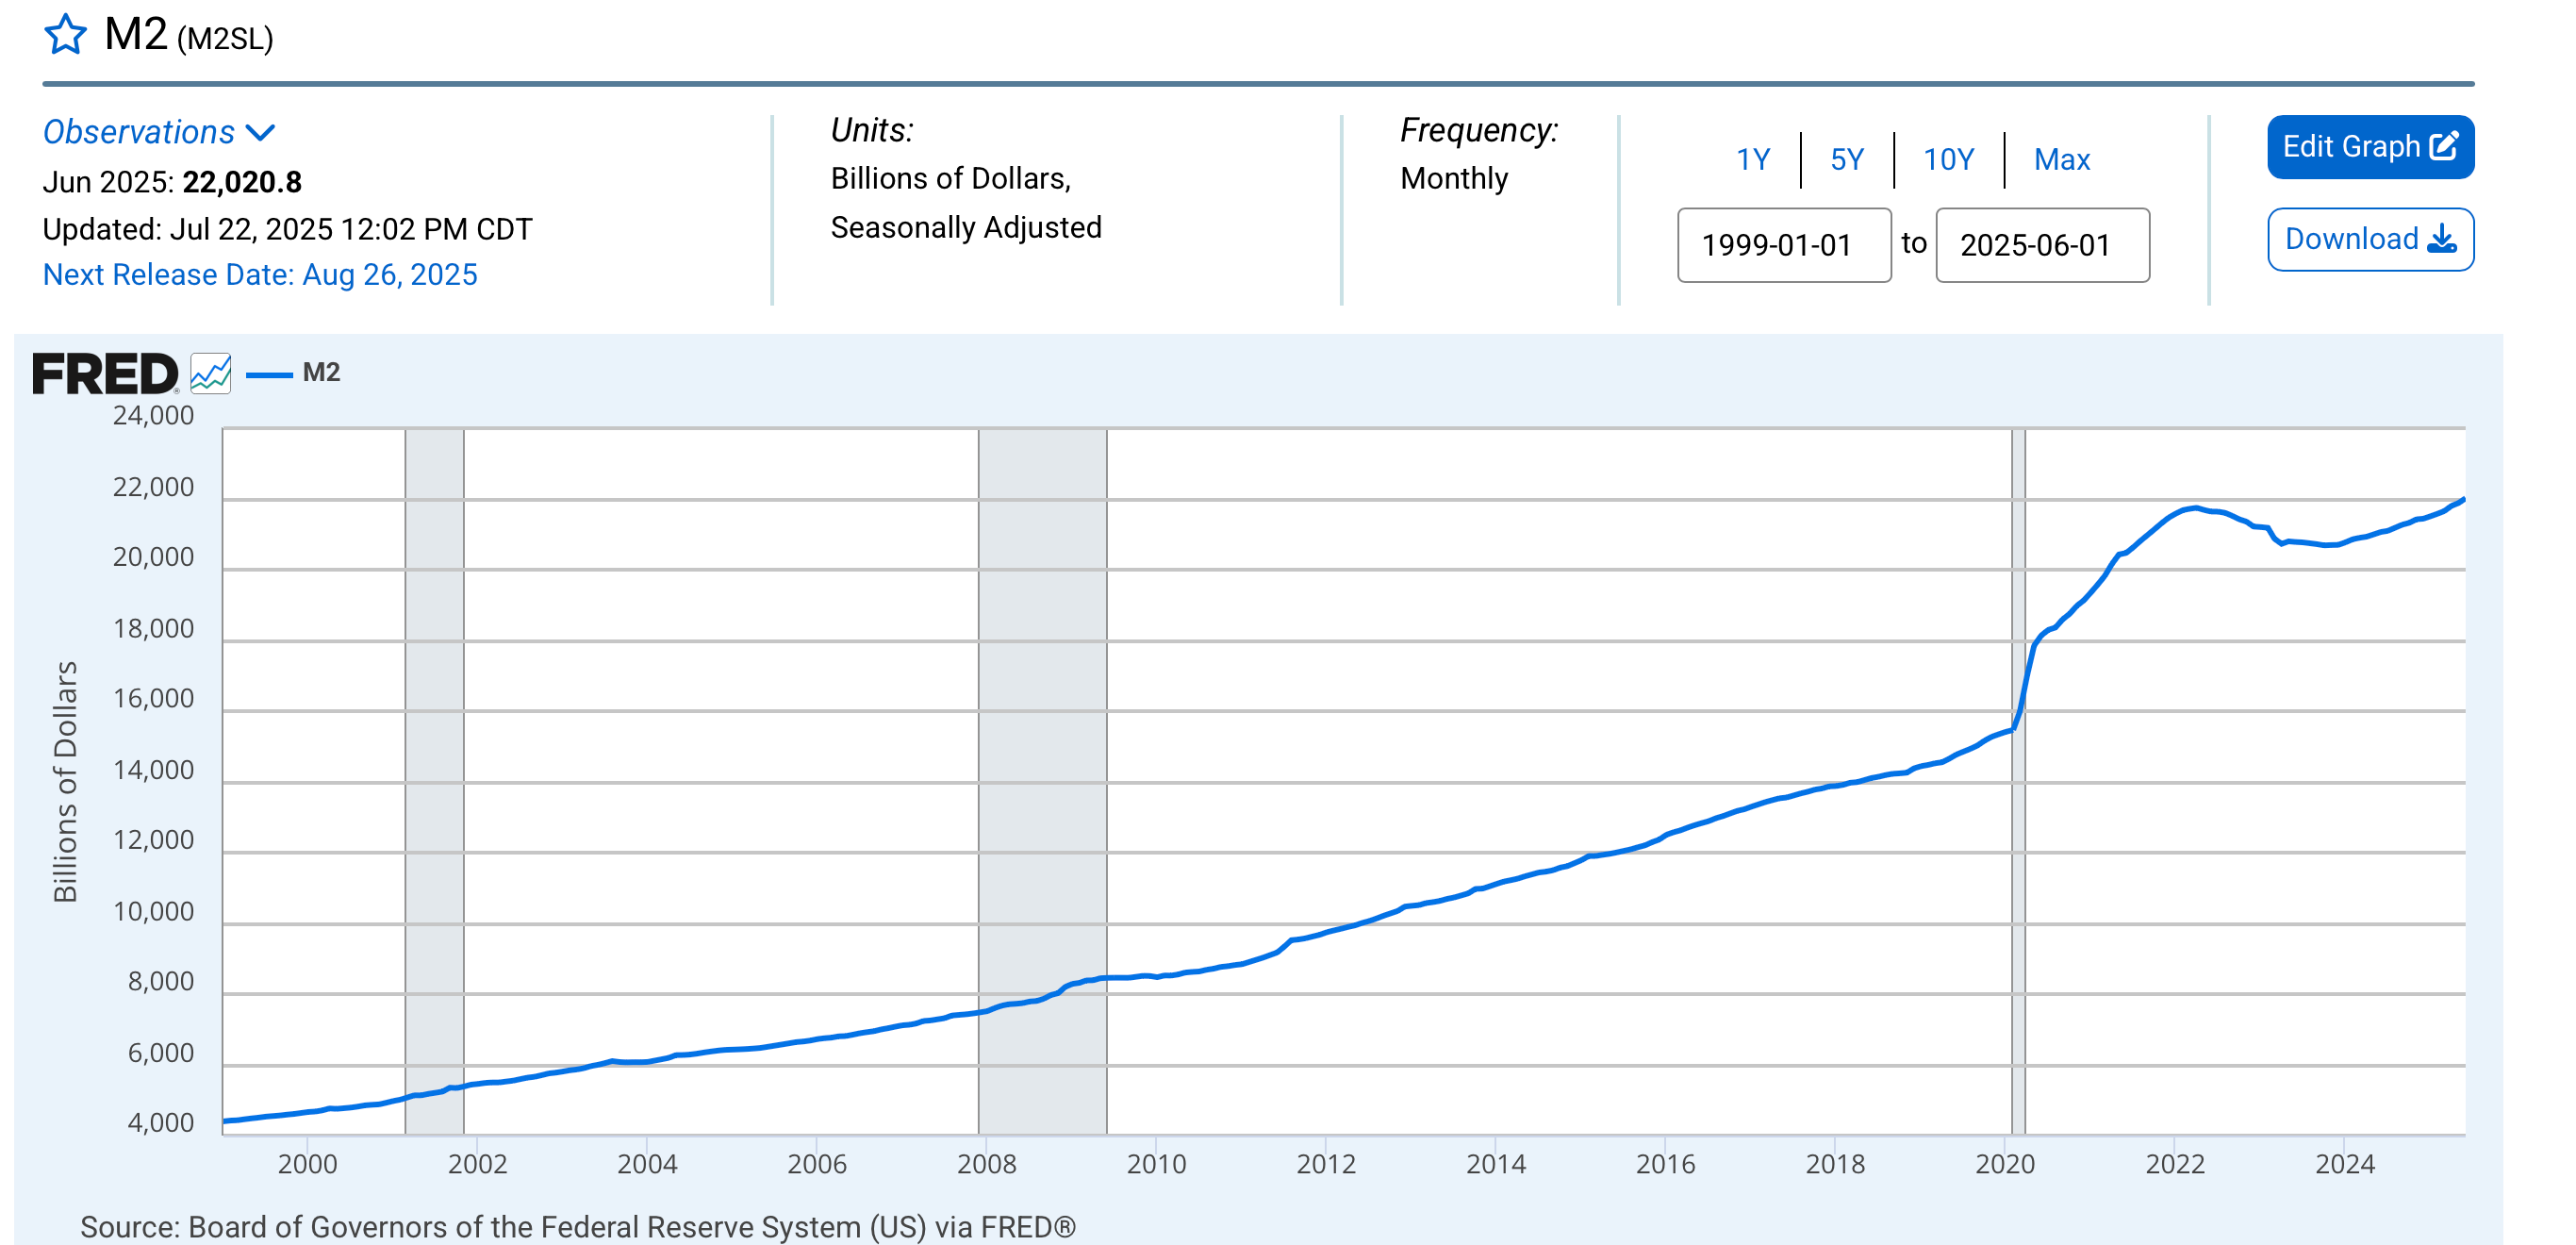
When it comes to inflation, most folks focus on interest rates and pay little attention to the money supply. Increases in the money supply are inflationary.
The following chart, courtesy of Federal Reserve Economic Data (FRED), shows that after a pause, the M2 money supply is once again on the rise.
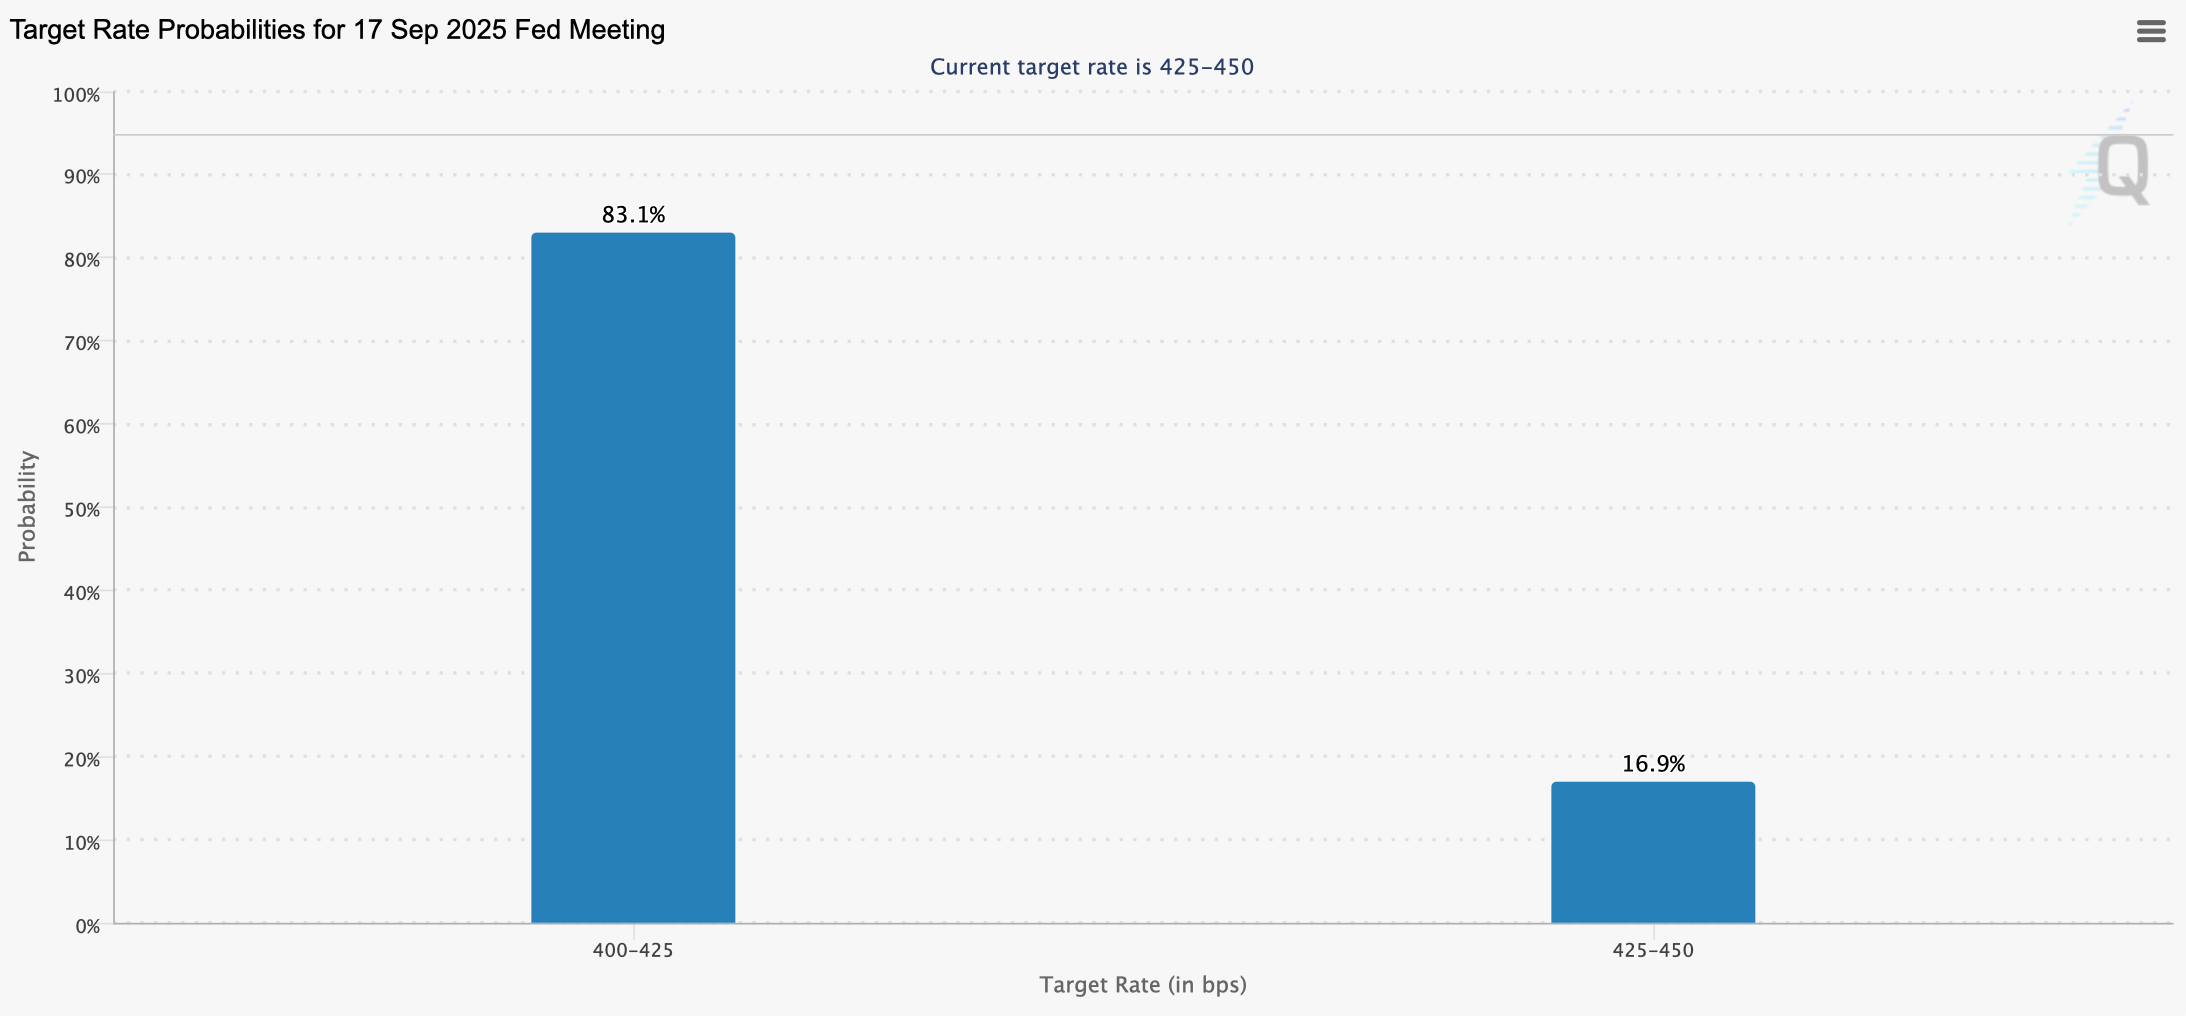
As the money supply is increasing, the Federal Reserve is about to reduce its key interest rate. Reductions in the Fed Funds rate can stimulate inflation.
As of August 18, the odds of a rate cut at the Fed’s September 17 meeting stood at 83.1%, according to the CME’s FedWatch Tool (below).
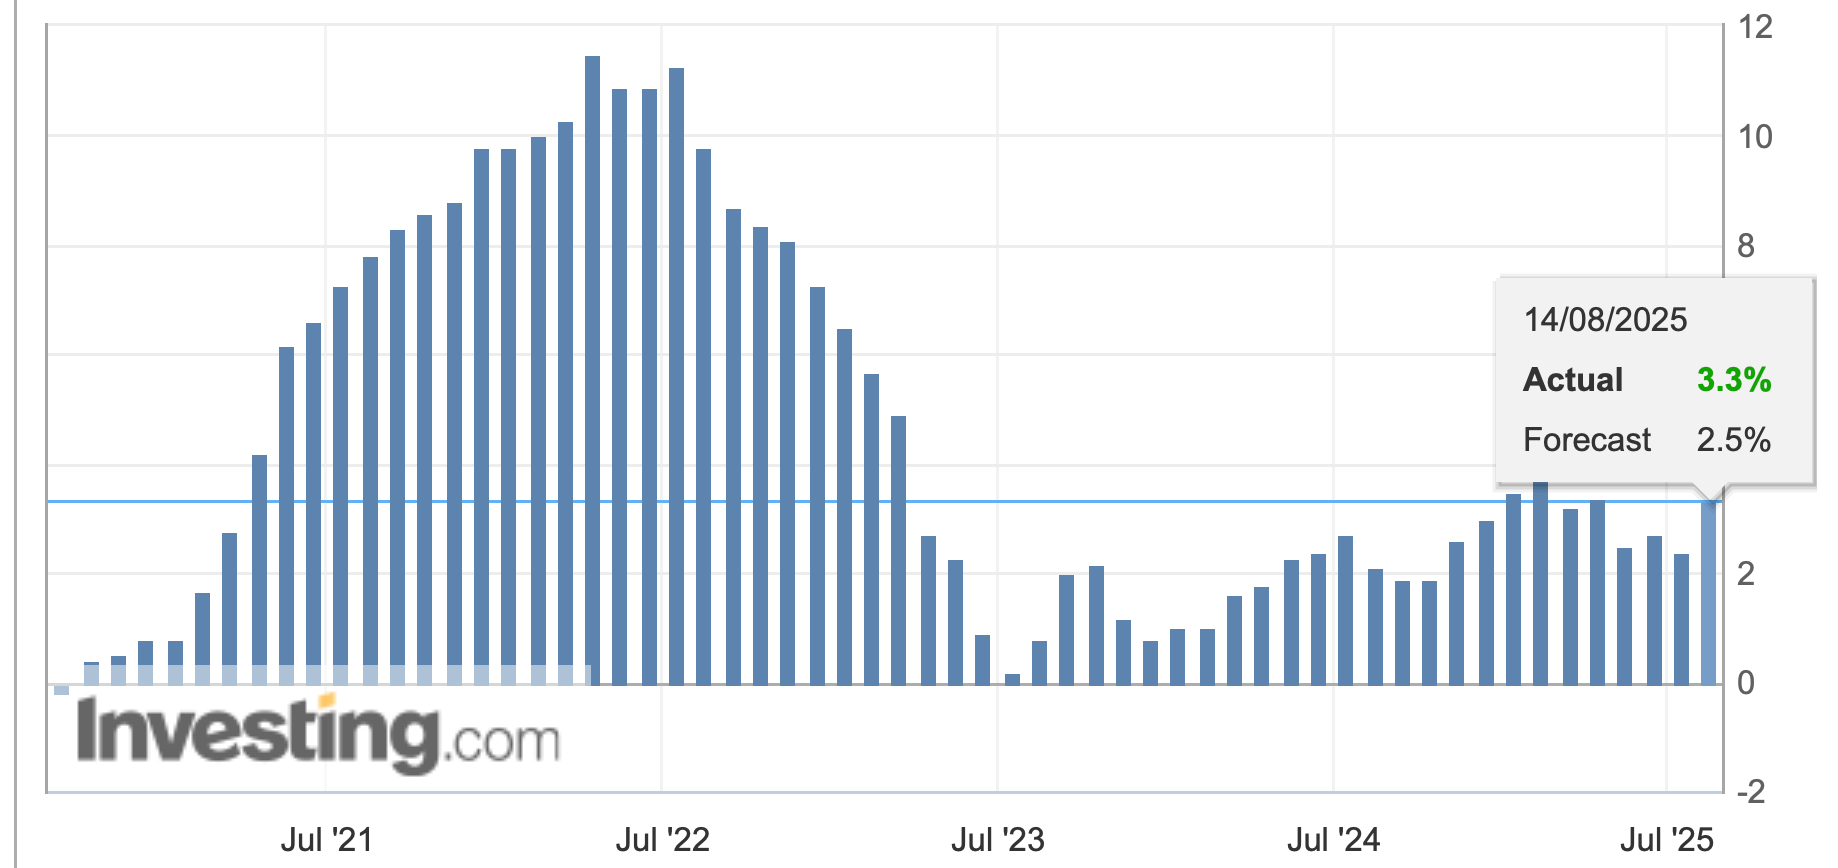
Has a surge of inflation already begun? The July Producer Price index came in shockingly high last week. The annual rate of inflation at the producer level soared to 3.3%, well above analysts’ expectations for a modest 2.5% increase.
To be fair, the majority of G7 countries have already cut rates on multiple occasions. Recent weak readings from the Bureau of Labor Statistics on employment are signaling a weaker economy going forward. There is a case to be made for a softening economy, which would dampen inflation.
Bottom Line
While a combination of the above ingredients could prove to be a recipe for inflation, the silver lining for gold investors would be new highs and a resumption of the bullish trend. $5,000 may seem far away, but it's not out of reach.
At the time of publication, Ponsi had no positions in any security mentioned.
