Has There Been a Big Change in the Market? Micron Has the Answer
Here's why we're watching Micron and the SOX closely after blowout earnings. Plus a look at volume, metals, TLT, Tesla, CoreWeave and more.
You've reached your free article limit
You've read 0 of 1 free Pro articles.
The Market
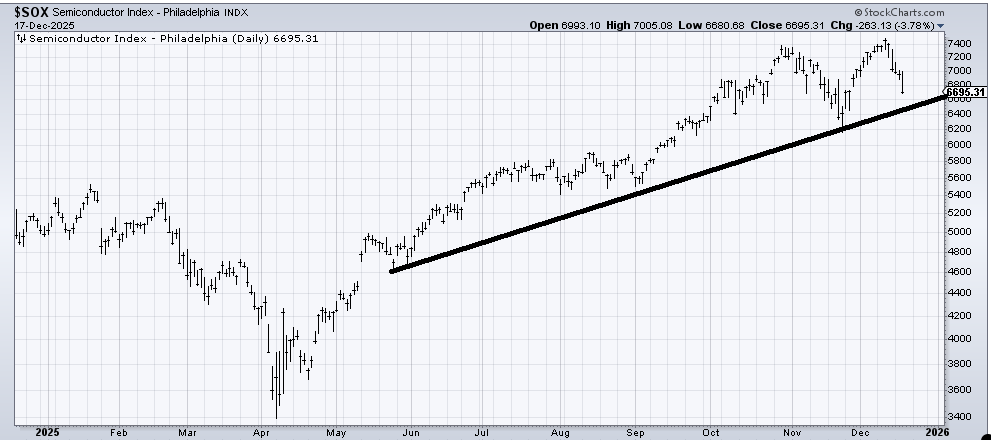
So much for my view that the SOX should have a green day. That was definitely wrong.
Perhaps Thursday. And I don’t mean that glibly. Because Micron (MU) had blowout earnings so if the stock can’t hold on to a rally on those earnings, then there has definitely been a change in the market and not a small one.
Why? Because that would make Nvidia (NVDA) , Broadcom (AVGO) and now Micron sold on good earnings. And you can put lipstick on that but it still won’t be a good look.
What if the SOX waits until next week to get down to that line and bounce? That would be fine, that would be what I’m looking for. But it won’t change the fact that these tech stocks are getting sold on good earnings. And my call is a short-term one, getting sold on good earnings is a more intermediate-term problem.
Away from that, once again we did not see a pick up in stocks making new lows. It came close, but there was still a small contraction.
Breadth on the NYSE was good (-300) for such a big down day but the McClellan Summation Index has rolled back over. It needs a net differential of +500 advancers minus decliners on the NYSE to turn it back up.
The Nasdaq’s Summation Index needs +8.1 billion shares (up minus down volume). If this gets to 10 billion shares or greater as we get closer to Christmas, then we’ll have this indicator showing an oversold condition (to go along with the Nasdaq Momentum Indicator we looked at two days ago).
At least we are getting the volatility I anticipated.
Let me end by noting the DSI for gold is 81. Silver is only 75 but platinum is now 88 and palladium is 88. The latter two are getting giddy, in my view.
New Ideas
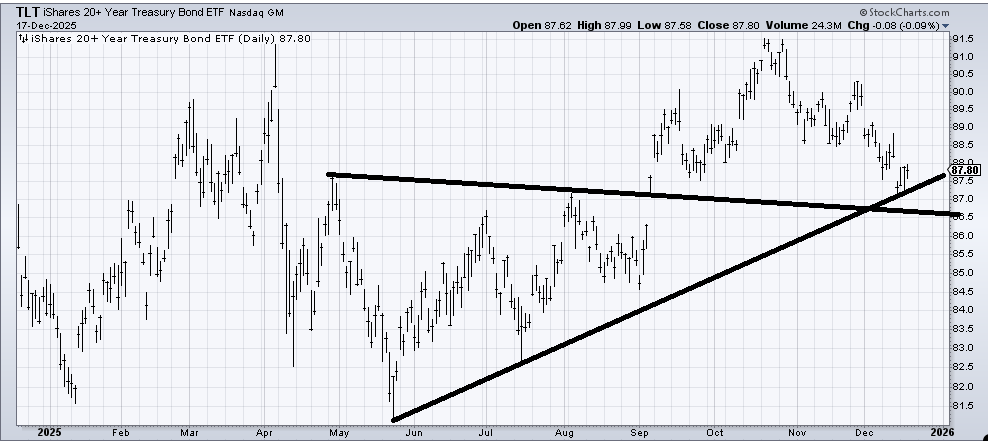
I want to revisit the bonds. (TLT) (for now) has bounced off the uptrend line. I don’t expect a surge from here but I still think this general area ($86.50-87.50) should give bonds a lift in the next few weeks.
Today’s Indicator
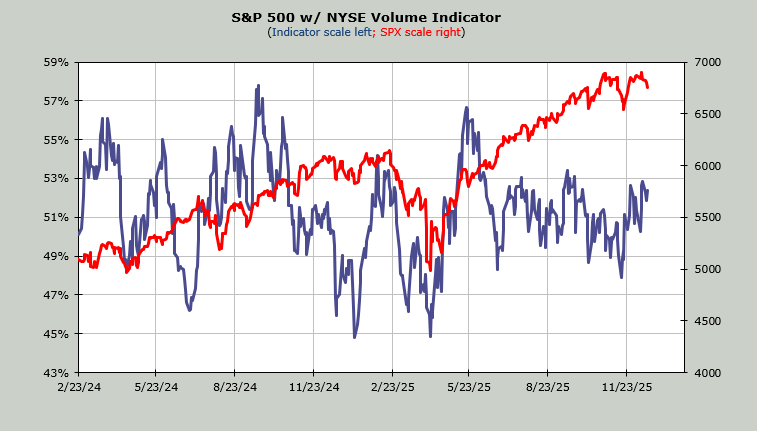
The Volume Indicator is at 52%. So it moved a smidge. I wouldn’t be surprised if a week from now it is at 49-50%. It’s like there is a magnet at 50%. For months.
Q&A/Reader’s Feedback
Helene welcomes your questions about Top Stocks and her charting strategy and techniques. Please send an email directly to Helene with your questions. However, please remember that TheStreet.com Top Stocks is not intended to provide personalized investment advice. Email Helene here.
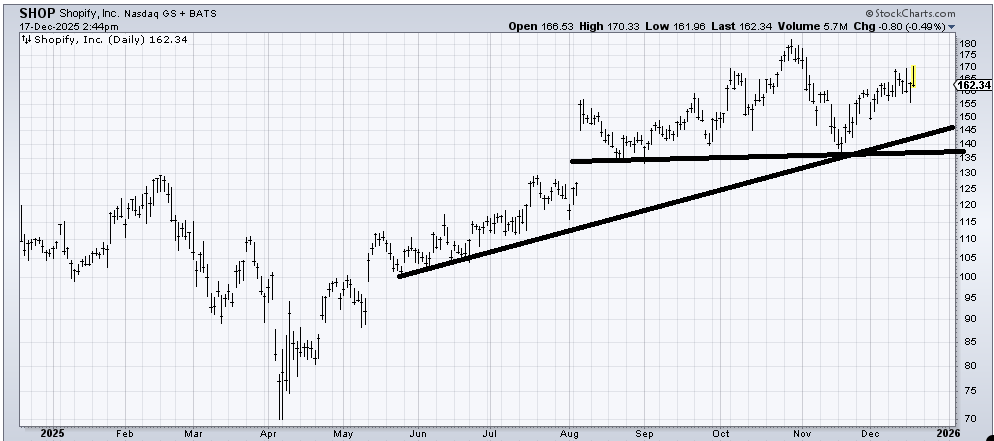
I have so many charts that look like Shopify (SHOP) . They were early winners, peaked in the summer, had a last gasp rally in October and now are in the middle of nowhere. I think that peak at $180 is resistance and if the stock falls to $140 it probably finds support.
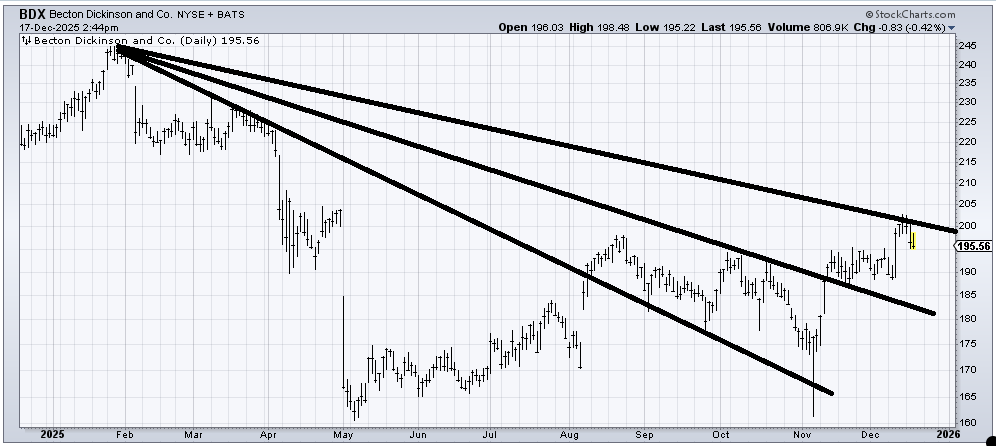
Becton, Dickinson (BDX) is working on a base. Maybe it holds here at $195, but my guess is it is more apt to slosh around for a while longer. If you look on the left side of the chart you can see approximately 3-4 months before the stock plunged. It has spent the next 9 months basing. So it is trying to work those early months of 2025 off the one-year chart. Resistance can be eaten through in different ways. One is to chew through it by getting up there, backing off, getting up, backing off. Another way is through time. BDX looks like it needs some time but it has crossed two downtrend lines so it’s probably about two-thirds of the way through basing.
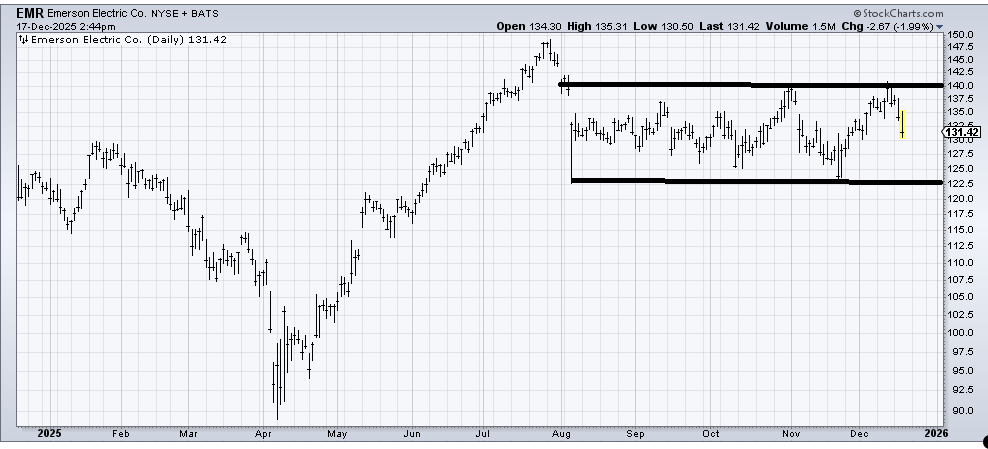
I am quite surprised Emerson Electric (EMR) has backed off so much from the resistance at $140. But unless it breaks $122 it looks like it’s trying to form a high base.
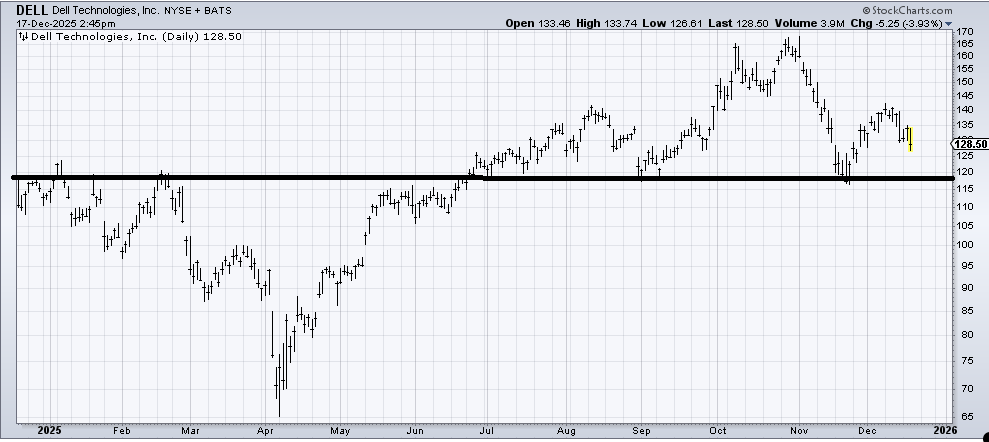
Dell (DELL) had a nice bounce off support at $120. I thought it would get to that $145 area of resistance but it couldn’t get that far and now it has a potential head-and-shoulders top. My inclination is that $120 holds on the first trip down. If it has a crummy bounce off $120 (i.e. can’t get back over $140) I’d be bearish on the chart.
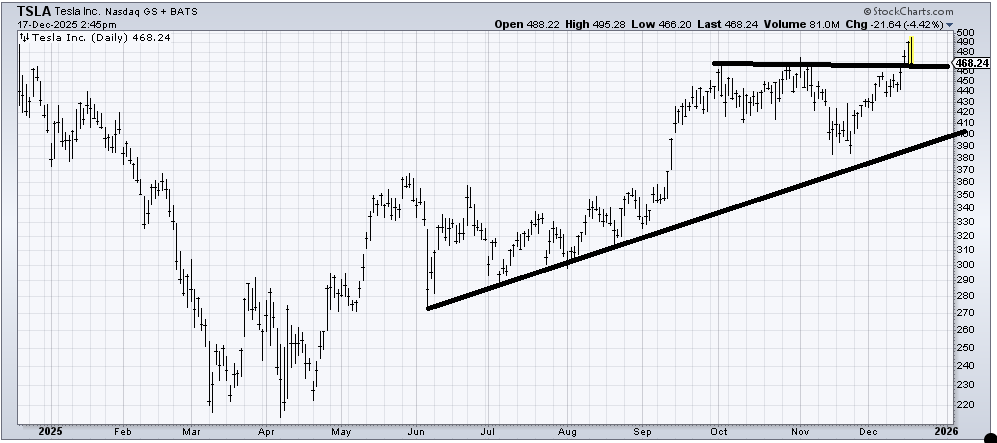
Tesla (TSLA) got everyone so excited when it broke out Tuesday and Wednesday it gave it back. If it slips back under $460 this will look like a false breakout.
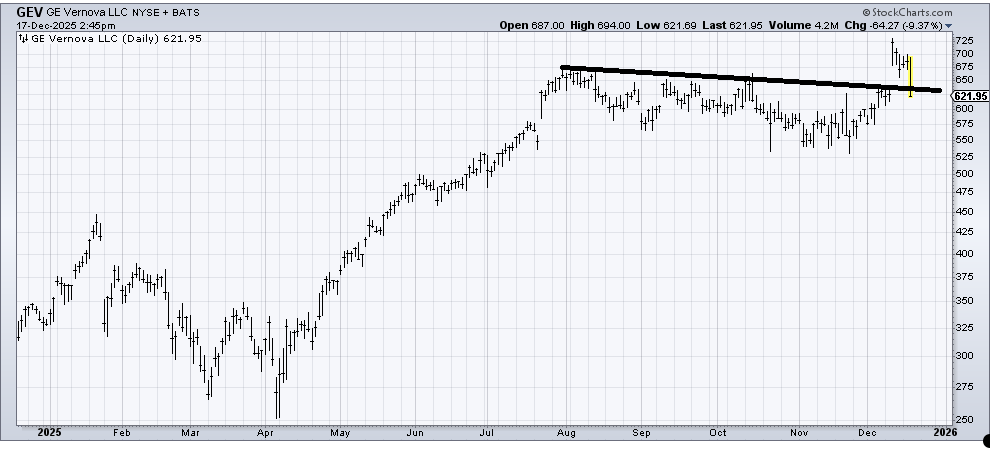
GE Vernova (GEV) is a chart I liked when we looked at it back in September. It just took another three months to get going. Here’s the problem: it gapped up and couldn’t hold on to the gap. If it can’t hold here I’d call that a failure.
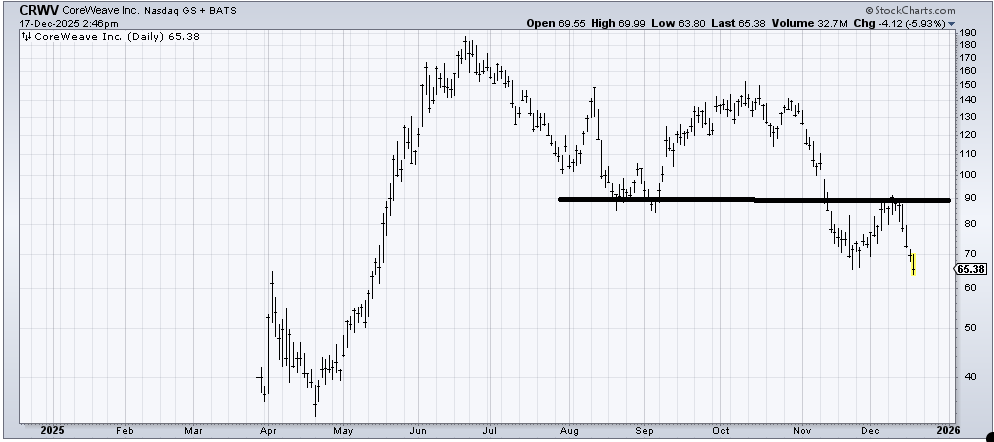
CoreWeave (CRWV) may very well bounce from this area but longer term it measures to the $30-35 area if it can’t get back over $90.
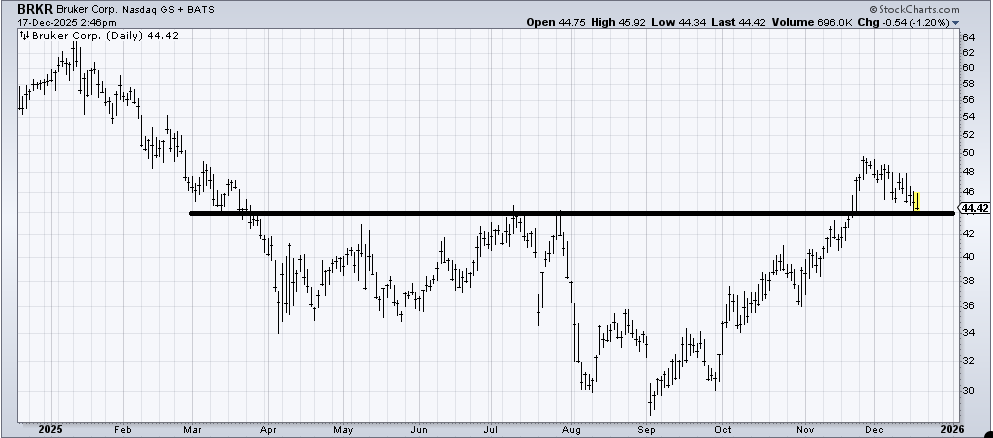
I would love to see Bruker (BRKR) mill around this $42-44 area for a few weeks letting us know that the breakout was real and this is just a retest.
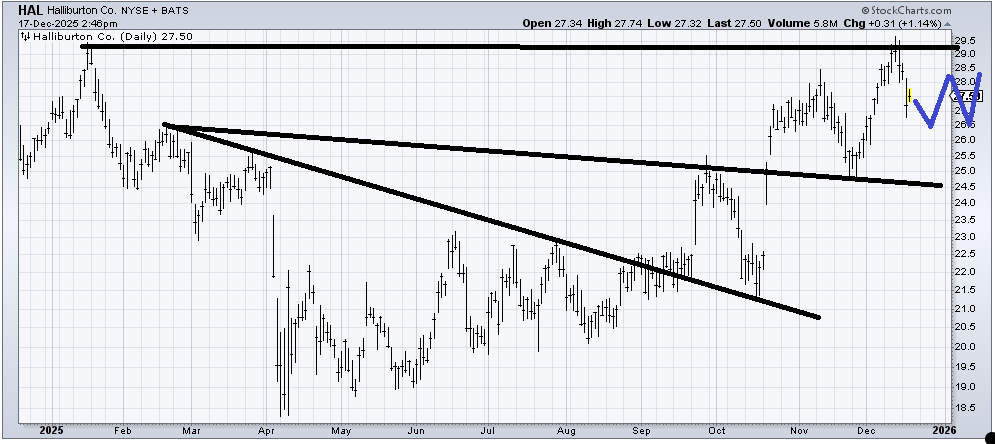
Halliburton (HAL) met its initial target at $29, but here too I would like to see some sideways action in this mid-to-upper $20s area to see the stock digest the recent gains. It’s too soon to say if the rally is over for good.