Has Sentiment Turned Positive?
Let's look at a few key indicators to see what investors may be thinking.
You've reached your free article limit
You've read 0 of 1 free Pro articles.
The Market
One of the key questions I always ask myself after the market rallies (or has a big whack) is whether I think sentiment has shifted. You might notice I often say something like, let’s see how quickly folks get bullish.
With that in mind, it really does feel like the entirety of market participants got so bullish last week with talk of breadth thrusts and the possibility of lower tariffs for China. Statistically, I think it is far too soon to really see a major shift.
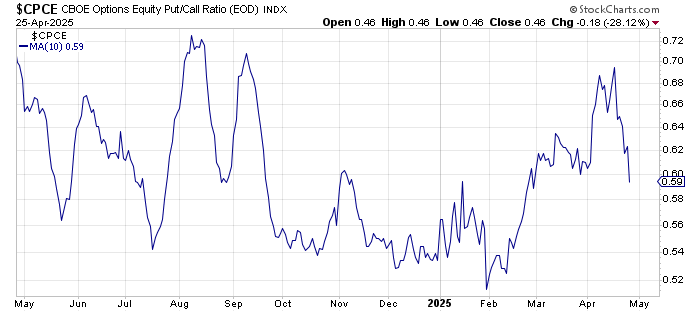
We did see the put/call ratio sink on Friday to .81, and equity is now .46, both showing signs that folks are getting on board. When we look at the ten-day moving average of the equity put/call ratio, we can see that at .59, it shows no extreme yet. It has yet to come to the bottom of the page.
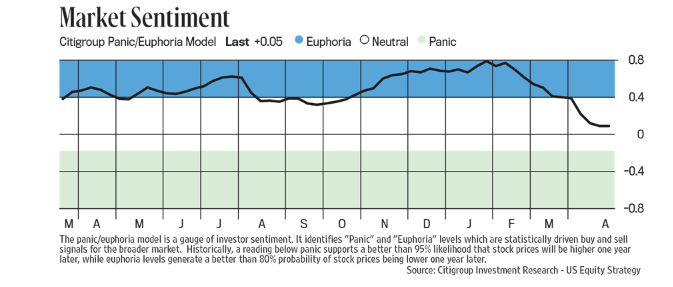
If we think about indicators like the Citi Panic/Euphoria Model, which only finally fell out of Euphoria three weeks ago (and is now hovering just over the zero line), we know how slowly that moves, so that indicator still sits on the positive side of the ledger.
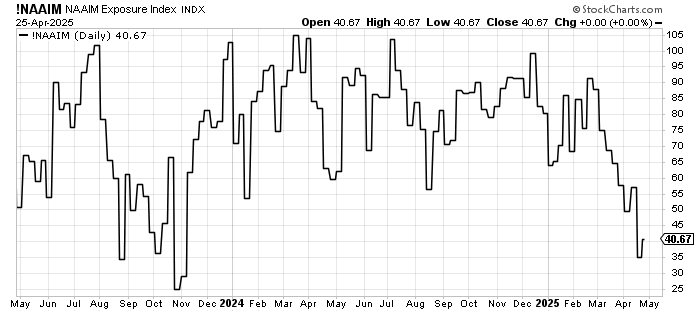
But, even the AAII and Investors Intelligence surveys haven’t had a chance to budge yet. The folks at NAAIM lifted their exposure so very little last week that here, too, we can see how soon it is to think folks are ‘all aboard’. The AAII folks seem to jump around like day traders, so if the market doesn’t fall apart this coming week (I do not think it will), we should see a shift there first.
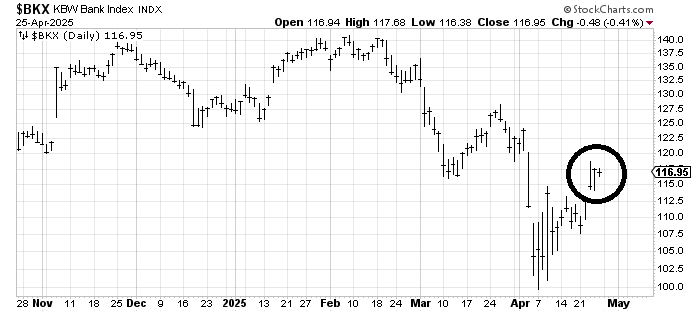
As for getting overbought, we can already see its effect on the charts of banks. They were just a little bit red on Friday, but look at the last three trading days: back and forth on the Bank Index between 115-117.
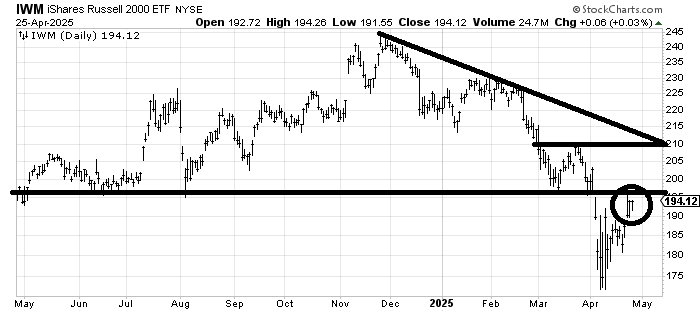
We see it on the chart of IWM, too, remembering that these are the charts that led us up. This is where all that great breadth came from. My point is that they are already having a rest.
And by now, we all know the routine: if the index movers get the love, they tend to do so at the expense of everything else. That was Friday as the S&P finally pushed over 5500 and the QQQs over 470, but breadth was flat.
On Thursday evening, we looked at two prior Breadth Thrusts, and I showed you how they spent some time thereafter churning sideways. One did so for two months, and one for just about a week or so. That’s the action I expect in this overbought condition right now, and we’ll watch that sentiment to see if it shifts quickly. Remember, most folks go from one camp (bull or bear) to the fence before they join the other camp. We all want instant gratification, but more often, patience is required.
New Ideas
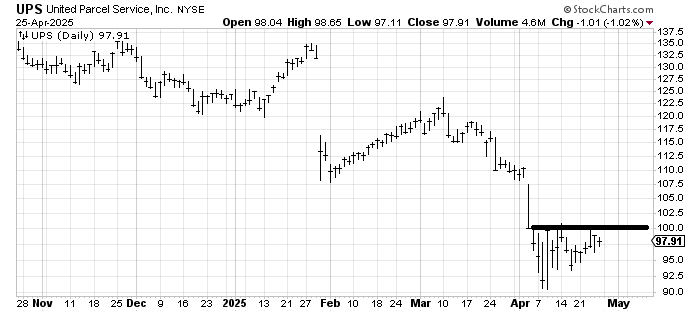
There is so much talk about cargo these days, with no ships coming from China and how slow the US ports have gotten and will get, that I thought it would be a good idea to revisit the chart of United Parcel Service UPS. We looked at this chart a week or so ago because it has such a high dividend payout. You can see it has barely participated in the rally. Yet if folks get hopeful that there will be a trade deal, this stock ought to get over 100 in a hurry and test resistance near 107. Not only would it be a good trade, it would be a good tell on sentiment.
Today’s Indicator
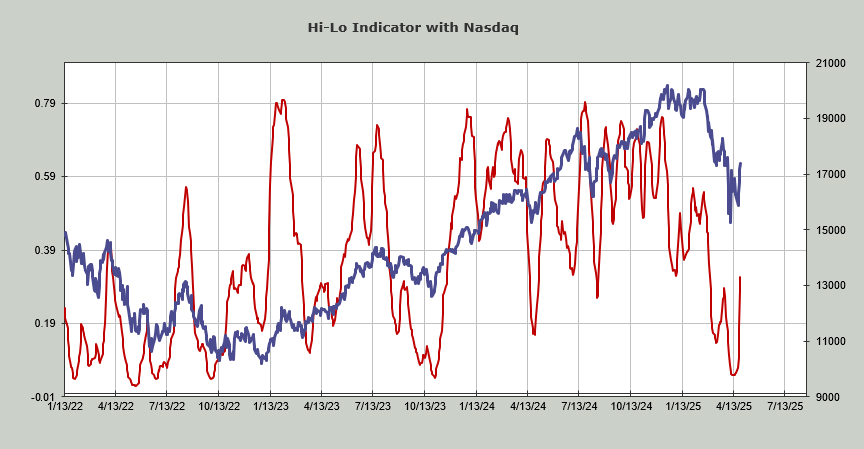
The new highs and new lows aren’t a factor now in terms of levels because, as we saw last Monday, the new lows were already contracting on the down move. It’s too soon for new highs to tell us anything. But the Hi-Lo Indicator for Nasdaq is now at .32, which means it is no longer oversold.
Q&A/Reader’s Feedback
Helene welcomes your questions about Top Stocks and her charting strategy and techniques. Please send an email directly to Helene with your questions. However, please remember that TheStreet.com Top Stocks is not intended to provide personalized investment advice. Email Helene here.
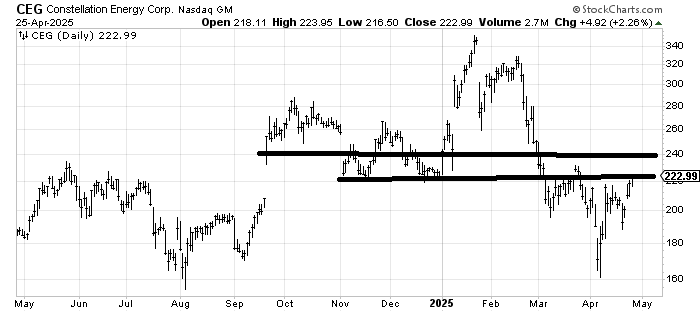
Constellation Energy CEG is the perfect example of a stock trying to eat through resistance. It took a bite out of it in March and is now back for another bite. My guess is it gets into that little zone between 225-240 before turning back, each time chewing through it a bit more.
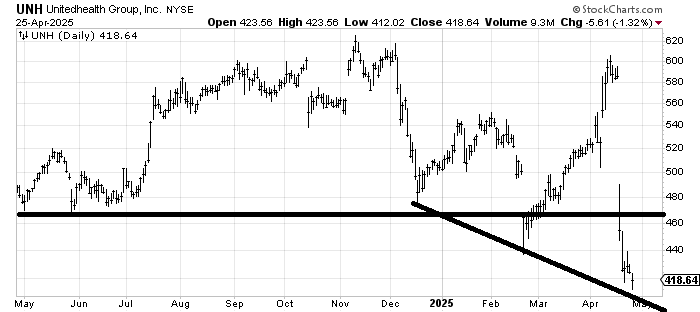
Several folks have asked about bottom fishing in UnitedHealth UNH. The only positive thing I can say is that the stock is getting so short-term oversold that I would expect a bounce in the next couple of days.
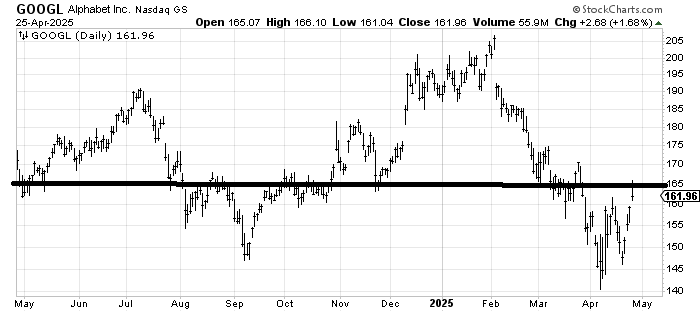
The question is if the action in Alphabet GOOGL on Friday is bearish. Here we have yet another example of a chart trying to eat through resistance. This is how it is done: one bite at a time. If it dips back to 160 to fill that earnings gap, it should rally again. Look at those charts of the Bank Index and IWM above, and you will see GOOGL’s action looks very much like they looked on Thursday. So it’s not bearish, it is part of the process.