Has a Market Ever Been So Reliant on One Group Before?
The Either/Or Market was on display again Thursday. Let's see what happened this time, why the VIX has my attention, and check out TLT, the Utes, SoFi, Berkshire and more.
You've reached your free article limit
You've read 0 of 1 free Pro articles.
Note: I am taking this weekend off as I am going to New York to celebrate my mother’s 89th birthday. The next issue of Top Stocks will be Monday evening.
The Market
Did you see how the Either/Or Market works again Thursday? Nvidia (NVDA) backs off and there is room for the others to rally. Oh sure, breadth wasn’t great but many of the stocks that were down on Wednesday saw the selling subside. I am not sure I have ever seen a market so reliant on one group or the other.
On the sentiment front, the NAAIM Exposure lifted to just over 100. This is the highest reading since July 2024. The market did not head south immediately. What’s different this time? The time of the year/seasonality and the fact that in July 2024 the small-caps had had a big spike into mid-month.
Now we have small-caps milling around for the last month and so many stocks are already down at the lows. Yes, the number of stocks making new lows expanded again Thursday.
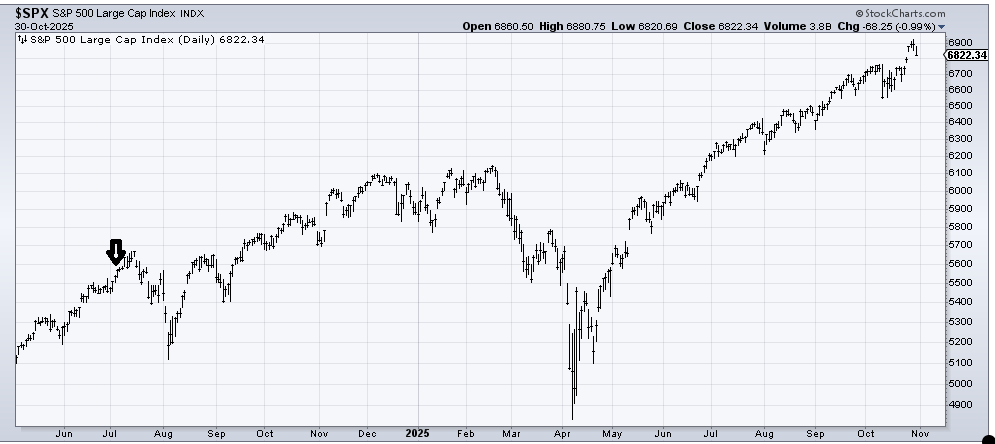
I do want to note, since it’s clear Friday folks will be thrilled that the indexes got saved by the likes of Apple (AAPL) and Amazon (AMZN) , that the VIX was curiously flat Thursday. All week when the S&P was green the VIX was green and Thursday when the S&P was red, the VIX was flat to red all day. I don’t know what to make of it but it has my attention.
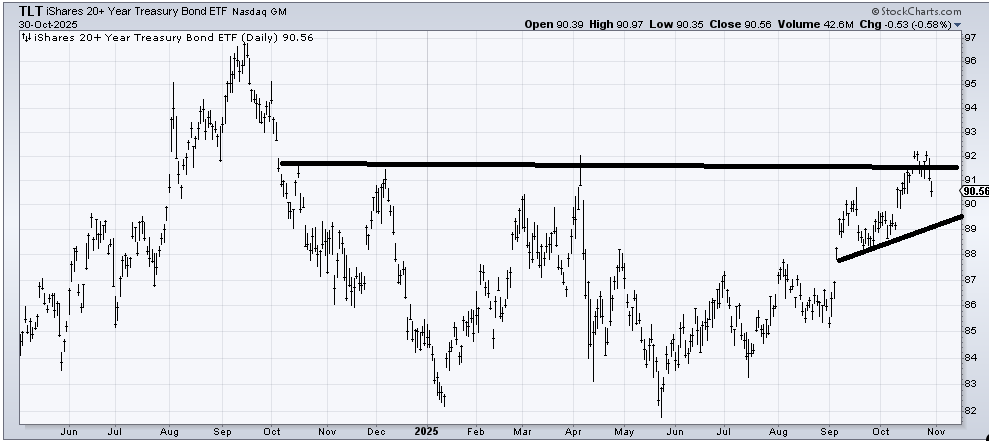
Elsewhere, the iShares 20+ Year Treasury Bond ETF (TLT) has handily been rejected from that $92 resistance area I have been highlighting. My base case is still that bonds are in a trading range but in the near term I have my eye on that $89-90 area as first support on TLT.
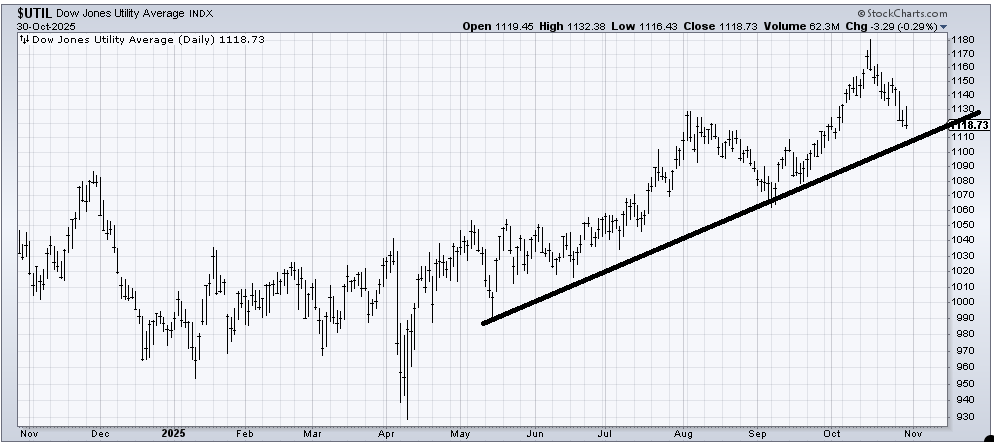
And that brings me to the Utes. The other day I said I wanted to see the iShares 20+ Year Treasury Bond ETF (XLU) down at $87 but it hasn’t budged. Yet the actual Utes have continued lower. They have now been red for seven of the last eight trading days. That makes them oversold or close to it. I would love to see them tag this line around 1,110 but know they are getting close to a bounce. I’d like to buy if/when they form a "W" (see the September W formation).
New Ideas
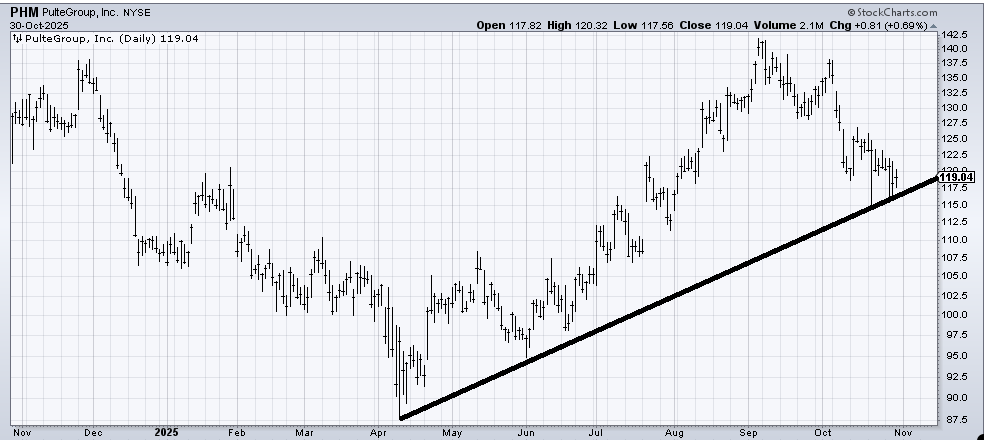
I still don’t have many charts that look like a great setup, but I am still watching PulteGroup (PHM) because it continues to hold that $115 area. Under there and it’s bad. If it can stay over it, then it gets much more interesting to me.
Today’s Indicator
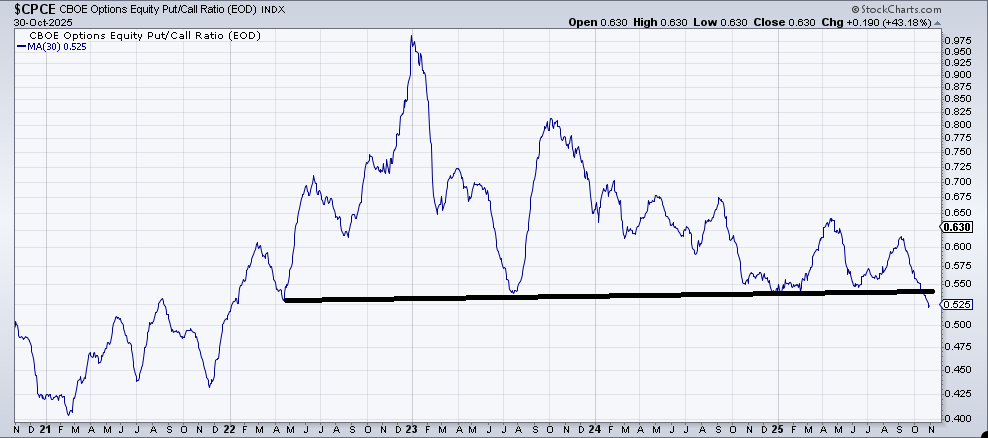
The 30-day moving average of the equity put/call ratio is now at 0.52, which is the lowest it has been since 2021. It is still quite far from the extreme lows of 2021 but we can see that the call buying has picked up quite a bit in the last month.
Q&A/Reader’s Feedback
Helene welcomes your questions about Top Stocks and her charting strategy and techniques. Please send an email directly to Helene with your questions. However, please remember that TheStreet.com Top Stocks is not intended to provide personalized investment advice. Email Helene here.
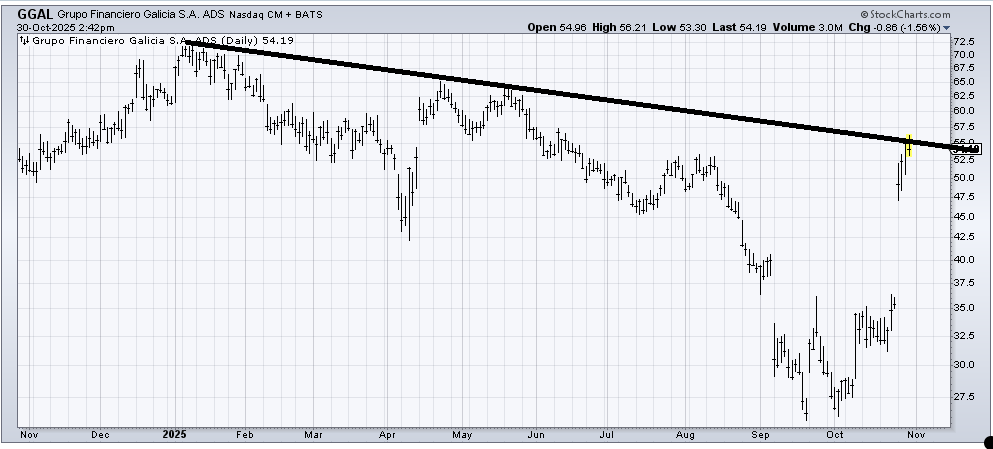
There is not much I can say about Grupo Financiero Galicia (GGAL) because it has already gapped up to resistance. It is not my style to chase it. However, it did leave an island down below (bullish) so if it can have a pullback and set up a better pattern I might get interested in it.
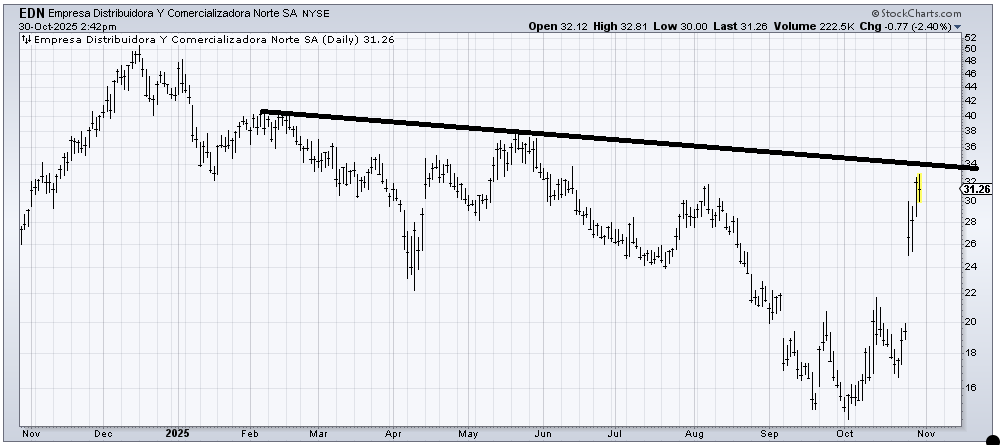
Empresa Distribuidora (EDN) has also gapped up and left an island below. But it’s the same chart: It is now into resistance so I would need a better pattern to set up for me to want to chase it up here. If the right side of the pattern can shape up I would probably like the chart again.
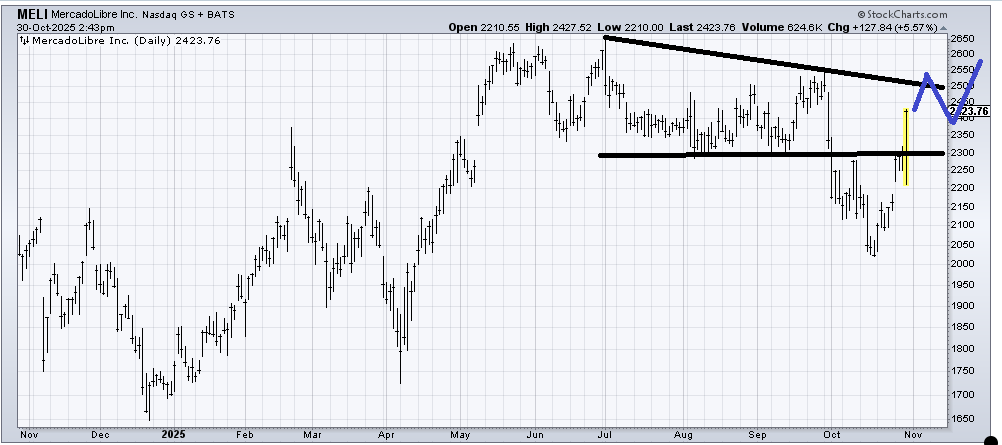
MercadoLibre (MELI) met its downside target when it got to just about $2,000, but more impressive is today’s action where it was down and reversed. I am terrible at chasing but I’d say a next target would be around $2,500. Then I’d want it to do some work before having another look at it. If it can map out something akin to what I’ve drawn in blue that would be good.
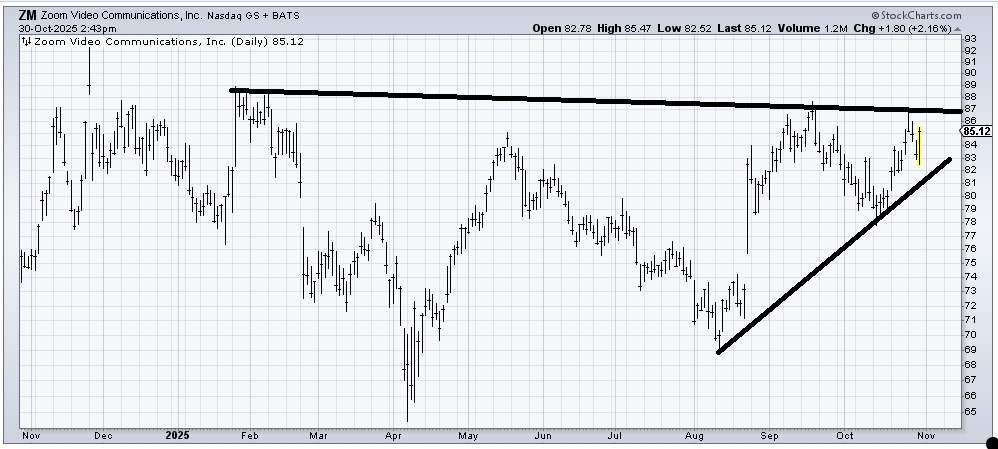
If I liked the market more right here I’d be a fan of the chart of Zoom Video (ZM) because it has gone sideways for a year. As long as it doesn’t break under the lower line ($82-ish) it has a shot at breaking out over $87.
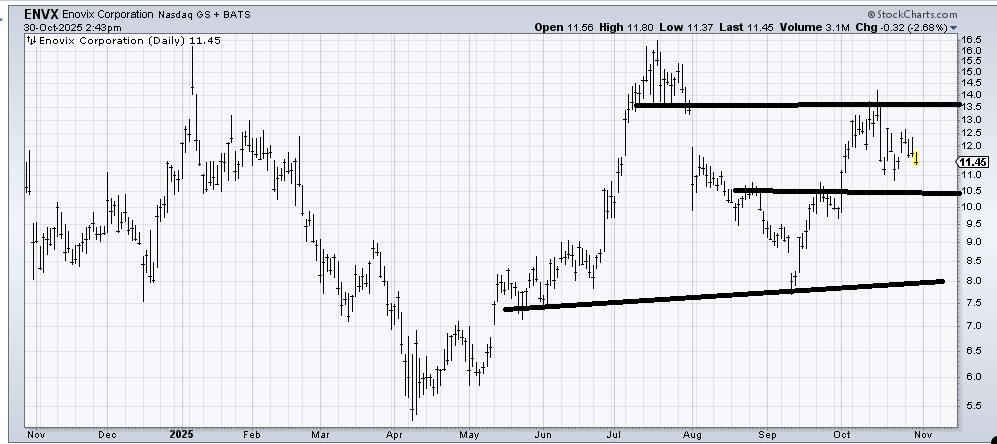
Enovix (ENVX) is just trapped between support and resistance. Let’s call it $10.50-13.50. So if it breaks either one I’d get interested. The chart overall feels weak because all it did in September was fill the gap left from the August decline. With earnings on deck next week I’d say if it can hold $10-10.50 on earnings, then great, otherwise, I’d stay away.
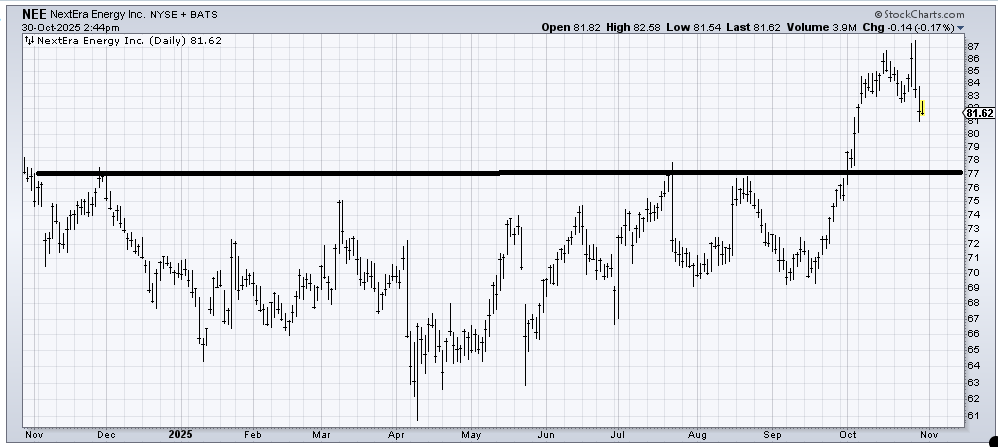
NextEra Energy (NEE) would probably look a lot better to me if it came down to test that $77 breakout over the next several weeks.
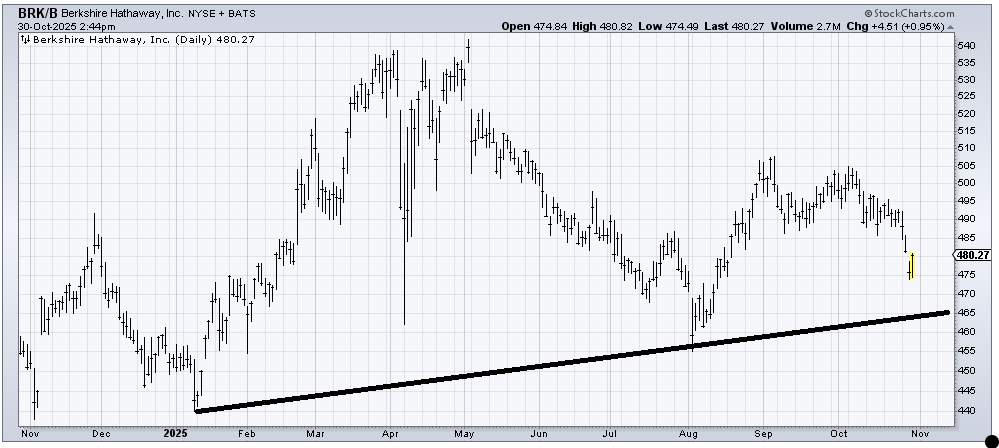
We had a nice trade off the August low in Berkshire Hathaway (BRK.B) , but now the stock looks a bit droopy to me. If it rallied to $485-490 and then came down to that $465 area I might find it interesting again.
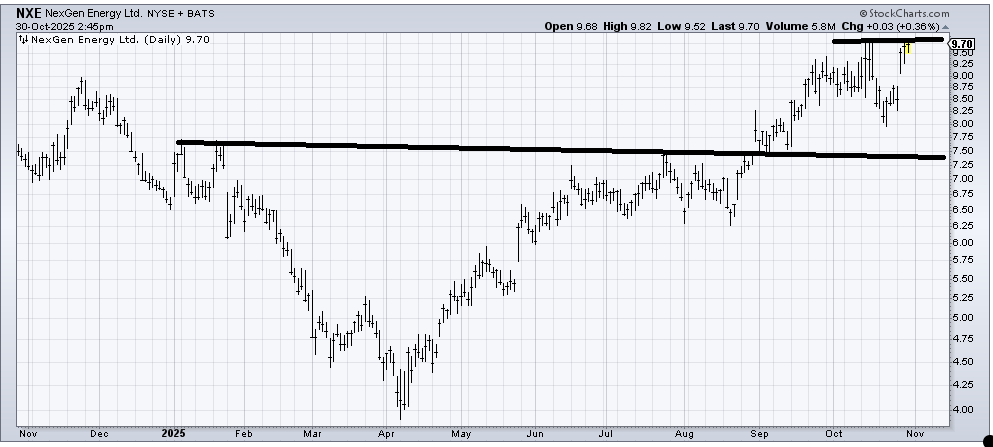
NexGen Energy (NXE) has a measured target around $10.50-11 so if it can get over these highs around $9.75 it ought to get there. I’d get cautious if it fails up here because then it will look like a double top.
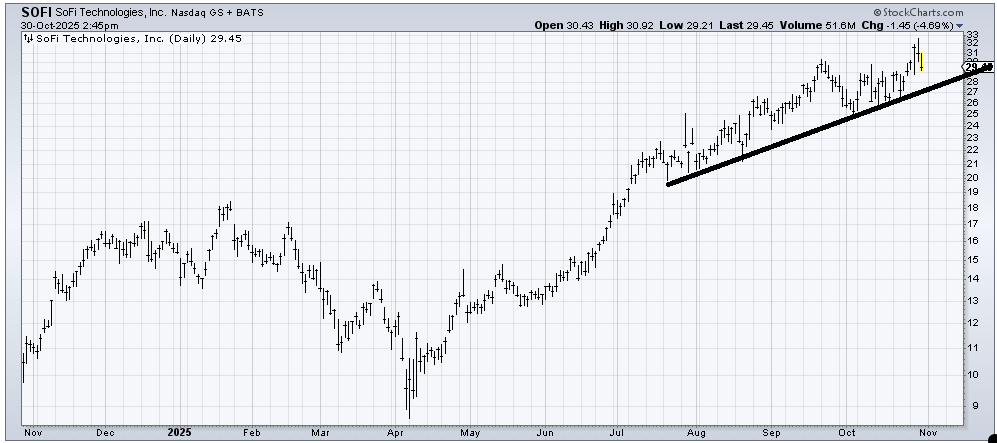
SoFi Technologies (SOFI) hasn’t done anything wrong, but it should have had some more follow through on this last push up. I’m not a buyer up here (not my style). I would just use a stop if it breaks that uptrend line.
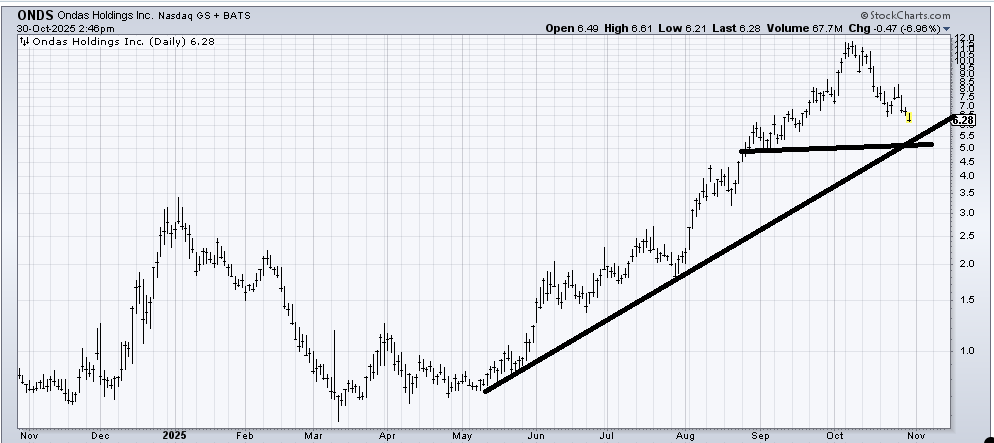
It’s not the finest line I have ever drawn, but I’d guess Ondas Holdings (ONDS) will test it ($5.00-5.50) in the next few weeks.