Grading the Magnificent 7 as Stock Group Hits Low
Here’s how Apple and Microsoft could determine the next directional move in the market.
You've reached your free article limit
You've read 0 of 1 free Pro articles.
The stocks known as the "Magnificent Seven" — Alphabet (GOOG) , Amazon (AMZN) , Apple (AAPL) , Meta Platforms (META) , Microsoft (MSFT) , Nvidia (NVDA) and Tesla (TSLA) — led the markets higher in 2023 and 2024.
In 2025, the tech giants began to lose momentum. Now that the calendar has turned to 2026, these former leaders are underperforming the broader market — some by a wide margin.
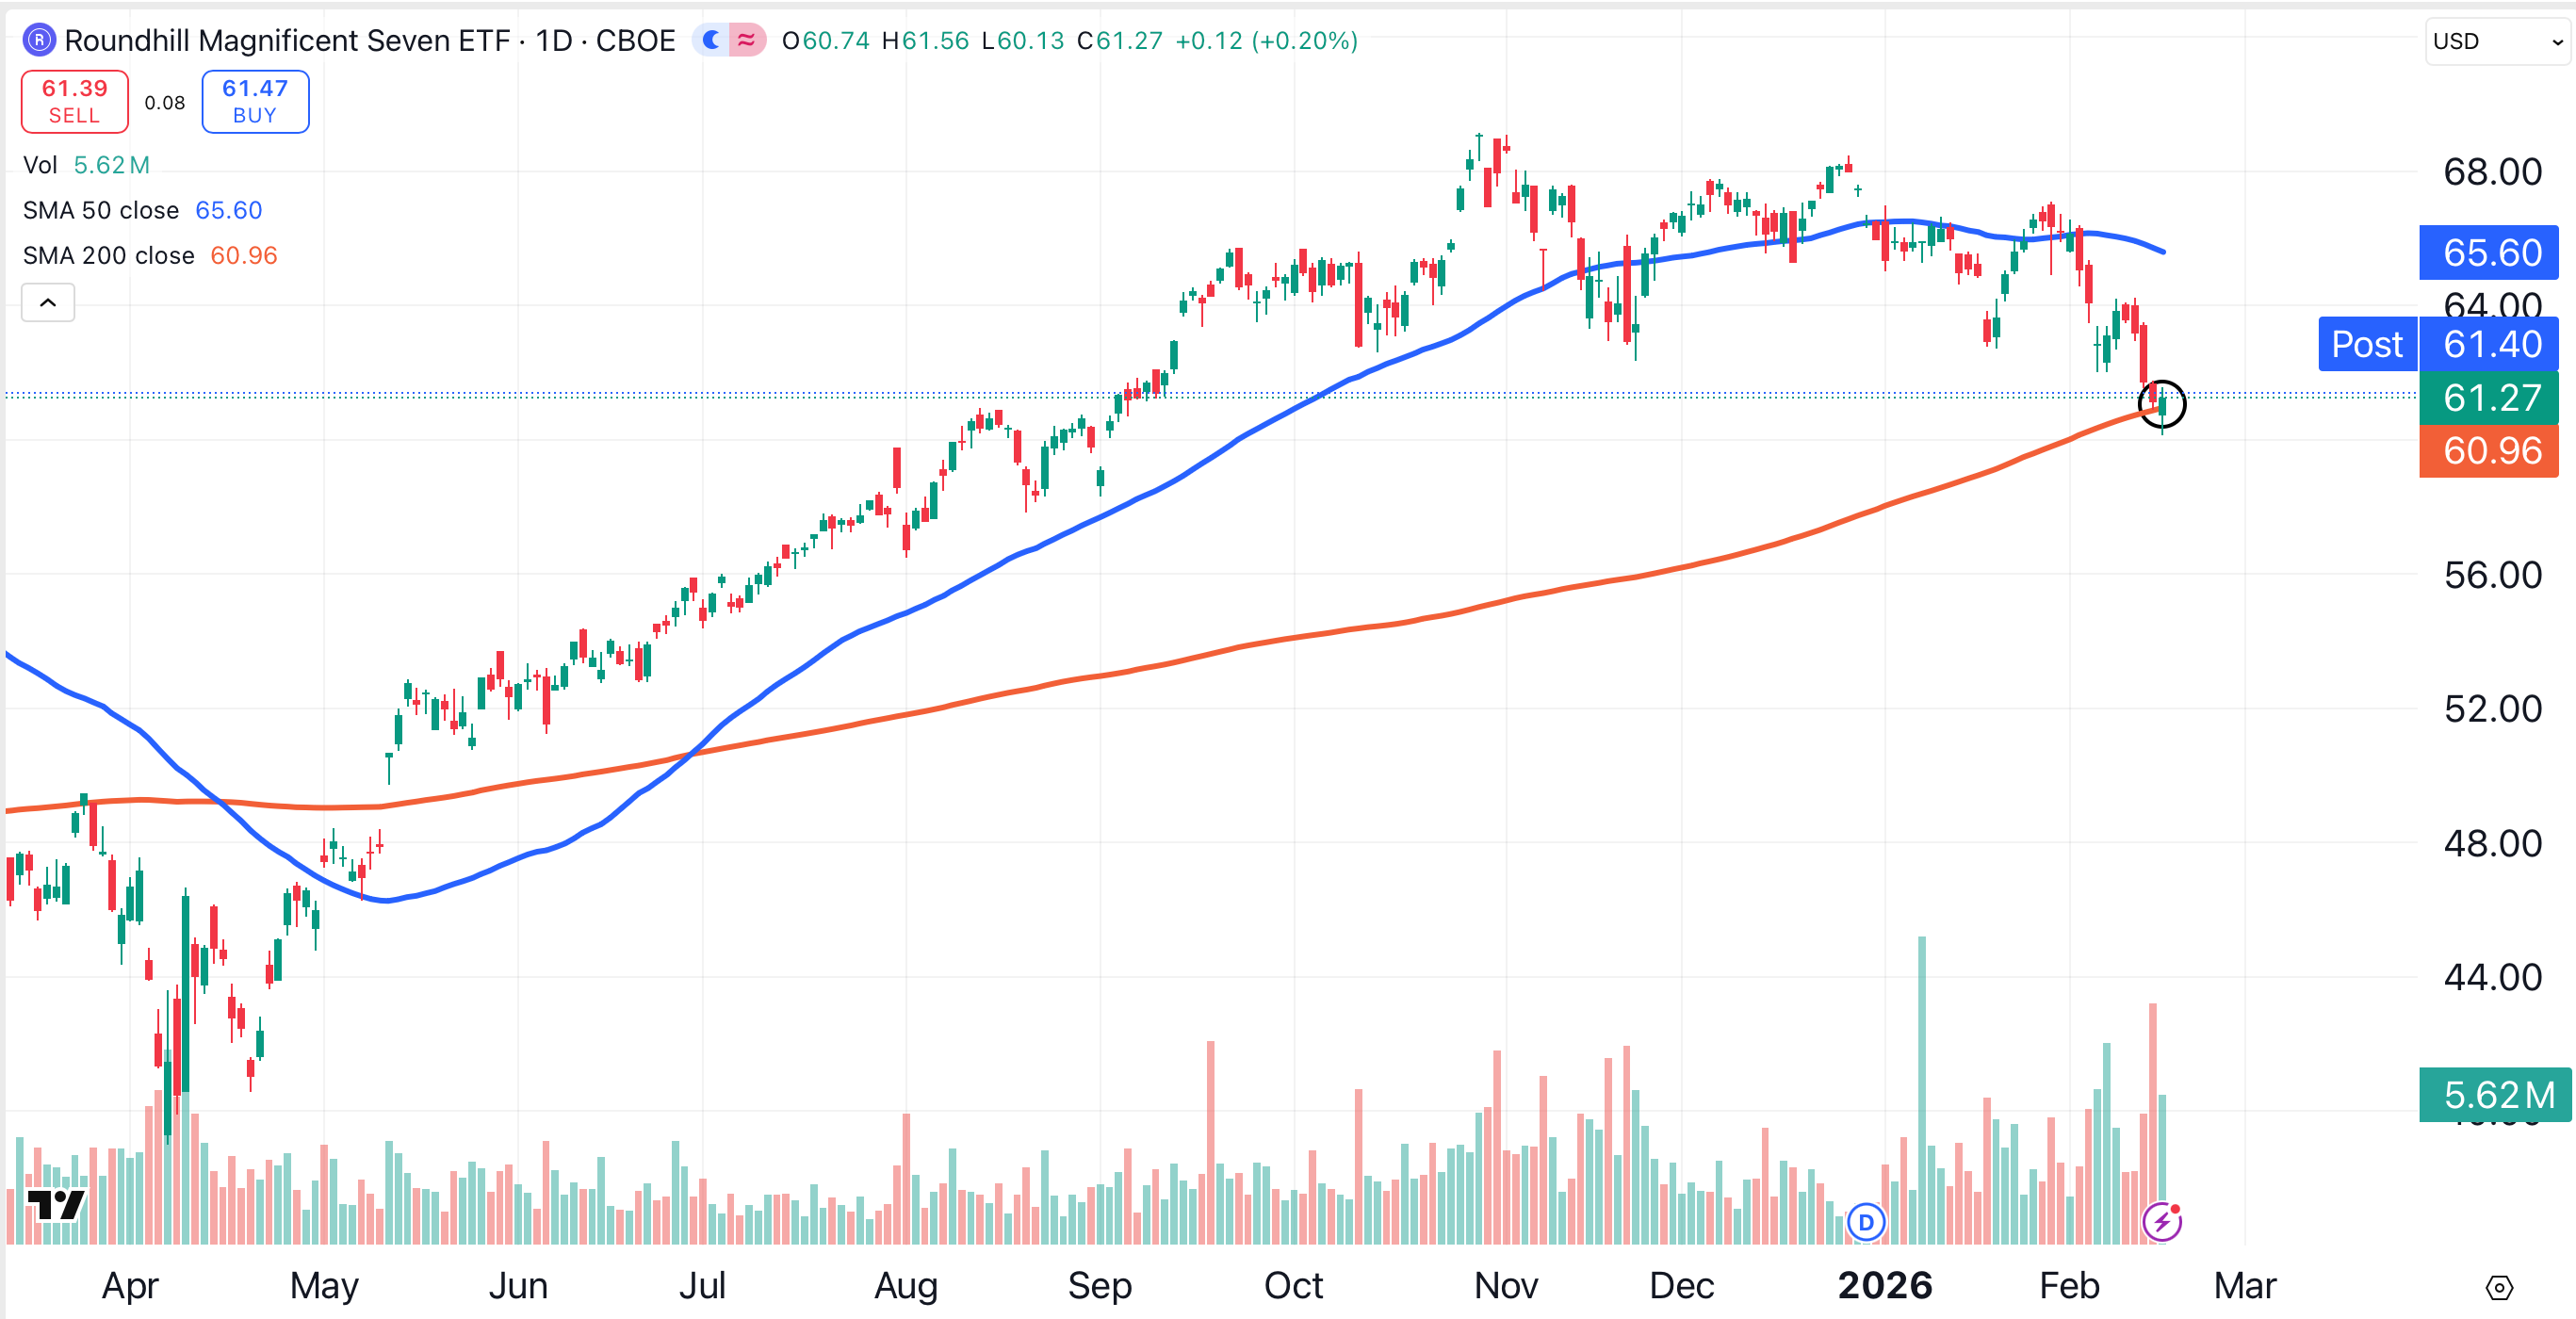
On Tuesday, the Roundhill Magnificent Seven ETF (MAGS) traded below its 200-day moving average (red) for the first time since May (circled). Earlier this week, the ETF traded at a five-month low.
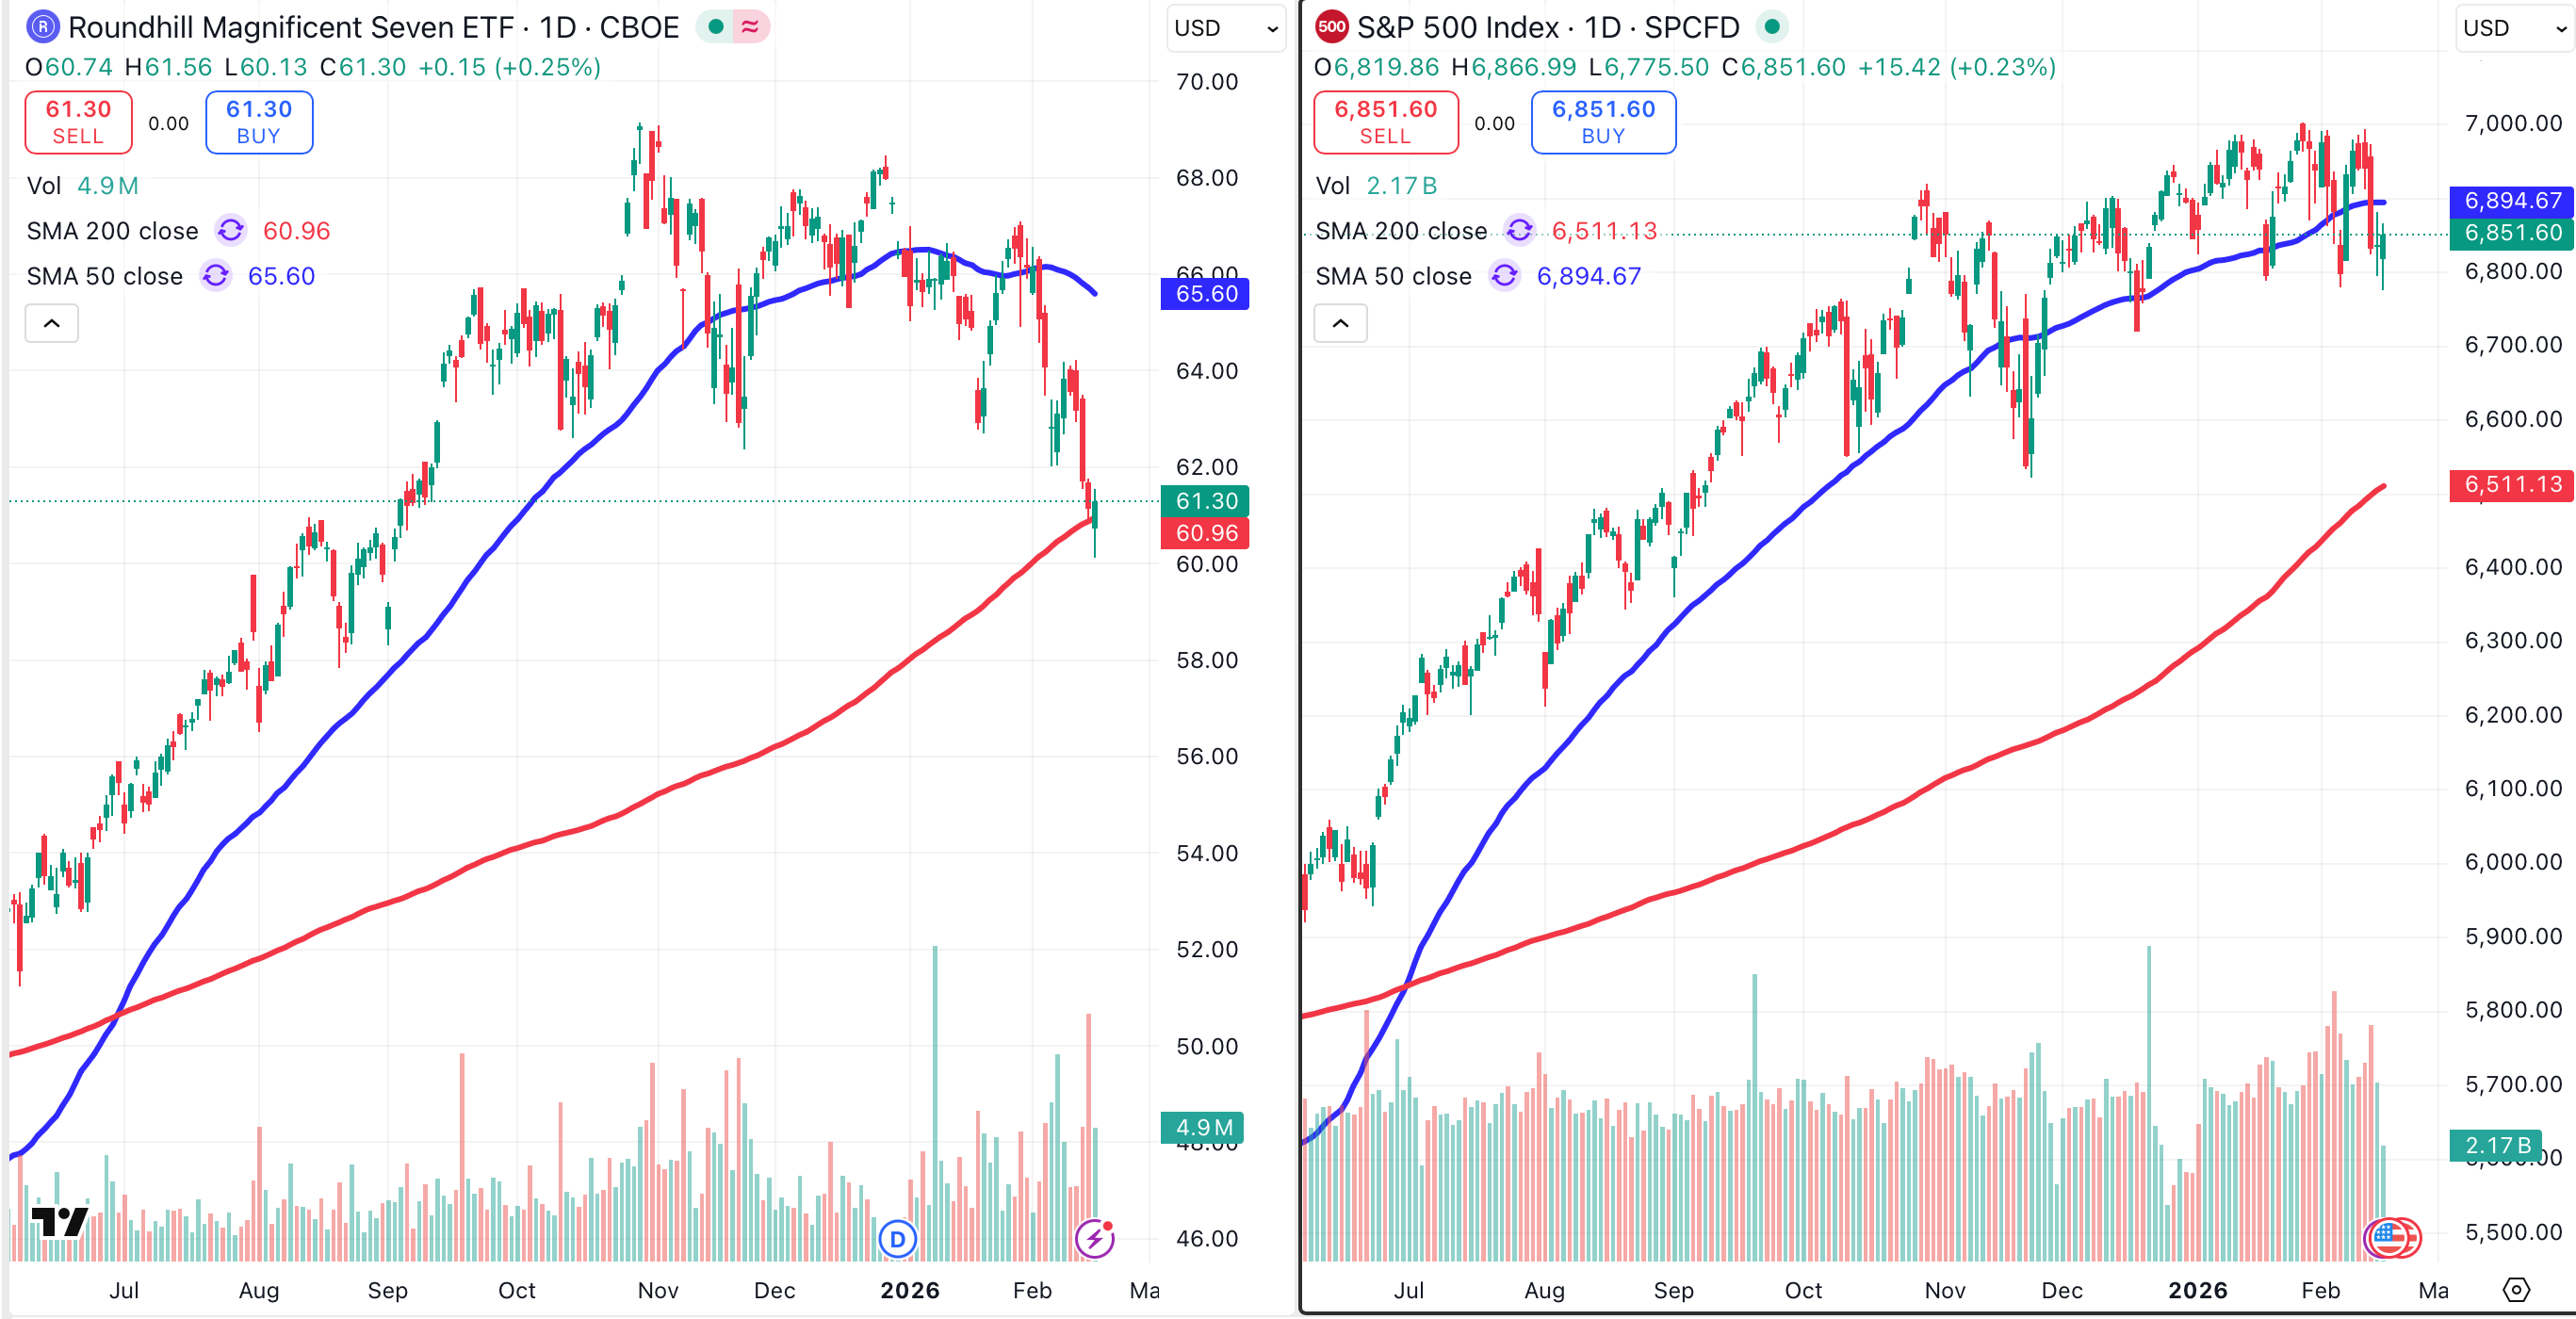
The juxtaposition of the MAGS ETF (left chart) versus the S&P 500 (right chart) is staggering. The broader market is leaving these former market leaders in the dust, as capital rotates away from tech and into sectors like consumer staples, homebuilders and hotel and leisure stocks.
Market Movers
Why should investors keep an eye on the 200-day moving average for the Roundhill Magnificent Seven ETF?
The S&P 500 and the Nasdaq Composite, arguably the two most closely-watched barometers for the U.S. markets, are both weighted indexes. Stocks that boast a huge market capitalization can pull an index higher due to their heavy weighting, but they can also drag weighted indexes lower.
Here are two Magnificent Seven stocks that are likely to move the market. One is pulling higher, as the other pushes lower.
Apple (AAPL)
Apple reached an all-time closing high of $286 in December. On Wednesday, the stock is about 8% below that figure. On a percentage basis, Apple is by far closer to a new all-time high than any other Magnificent Seven stock.
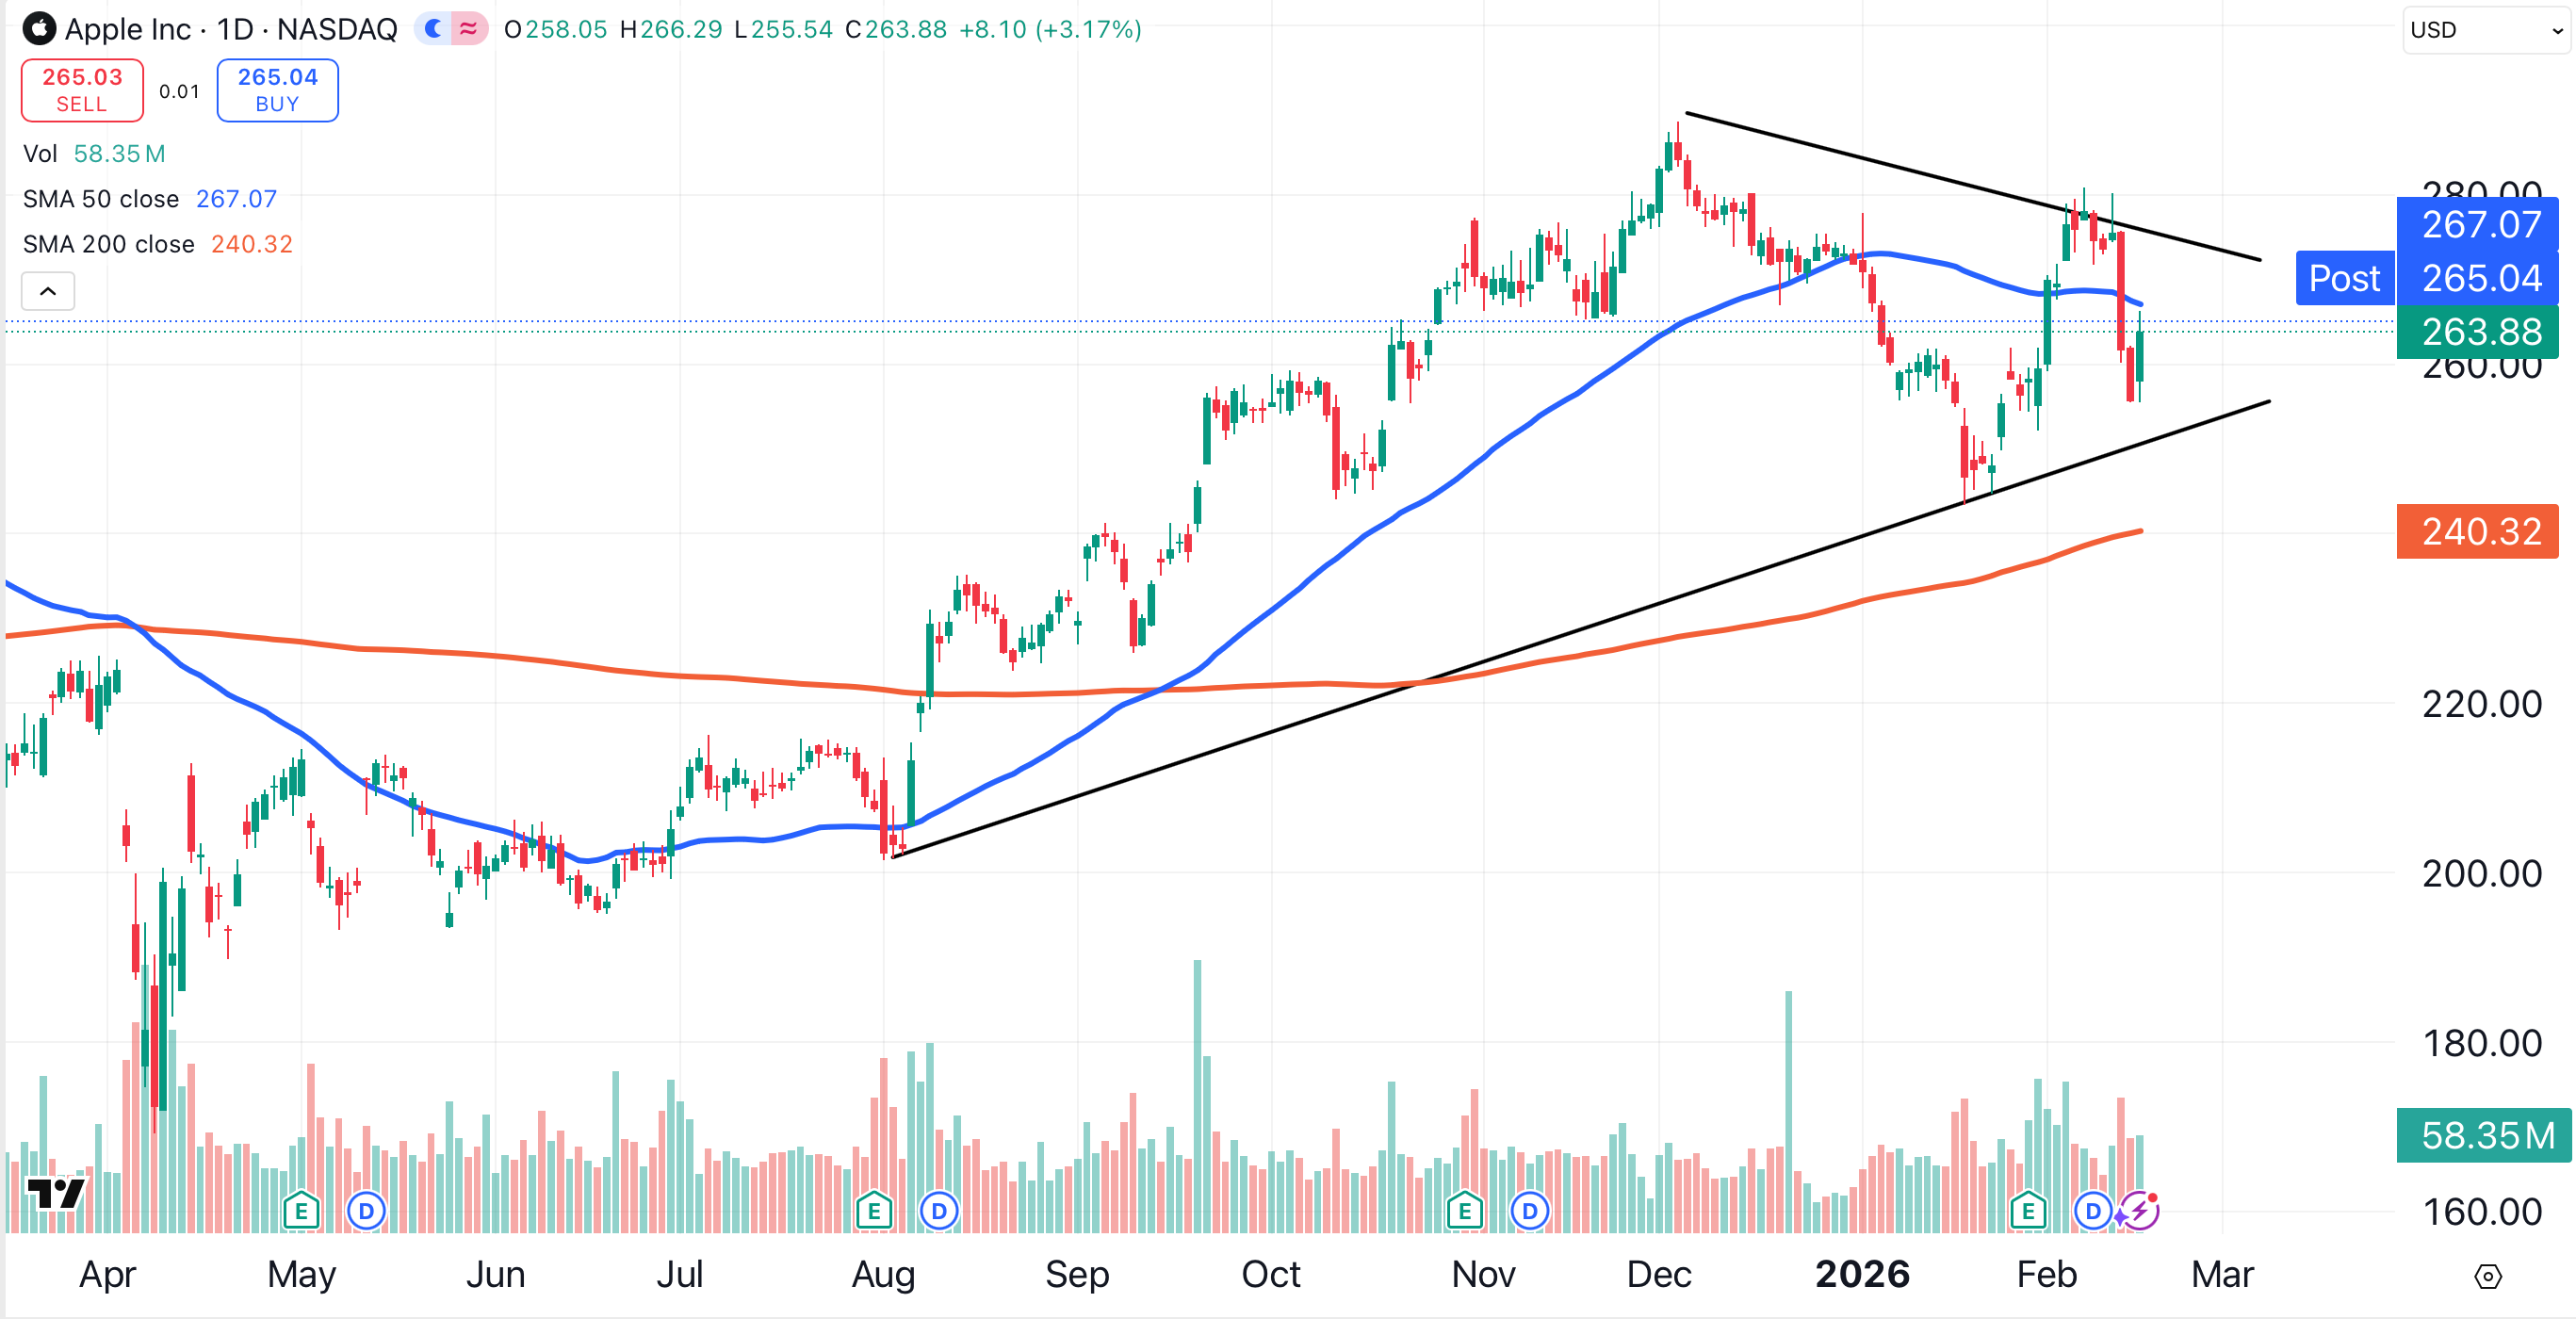
Apple has formed a symmetrical triangle pattern (diagonal lines), a formation that indicates a period of consolidation for the stock. That’s not surprising, since the broader market, as measured by the S&P 500, is flat on the year.
GRADE: B+
Microsoft (MSFT)
The weakest of the Magnificent Seven names is Microsoft. The software juggernaut has lost nearly a quarter of its value over the past six months.
Will Microsoft shares continue to fall? The stock is currently testing a bullish trendline that has been intact for three years (black solid line). If that key level breaks, Microsoft could drop another 10% to 15%.
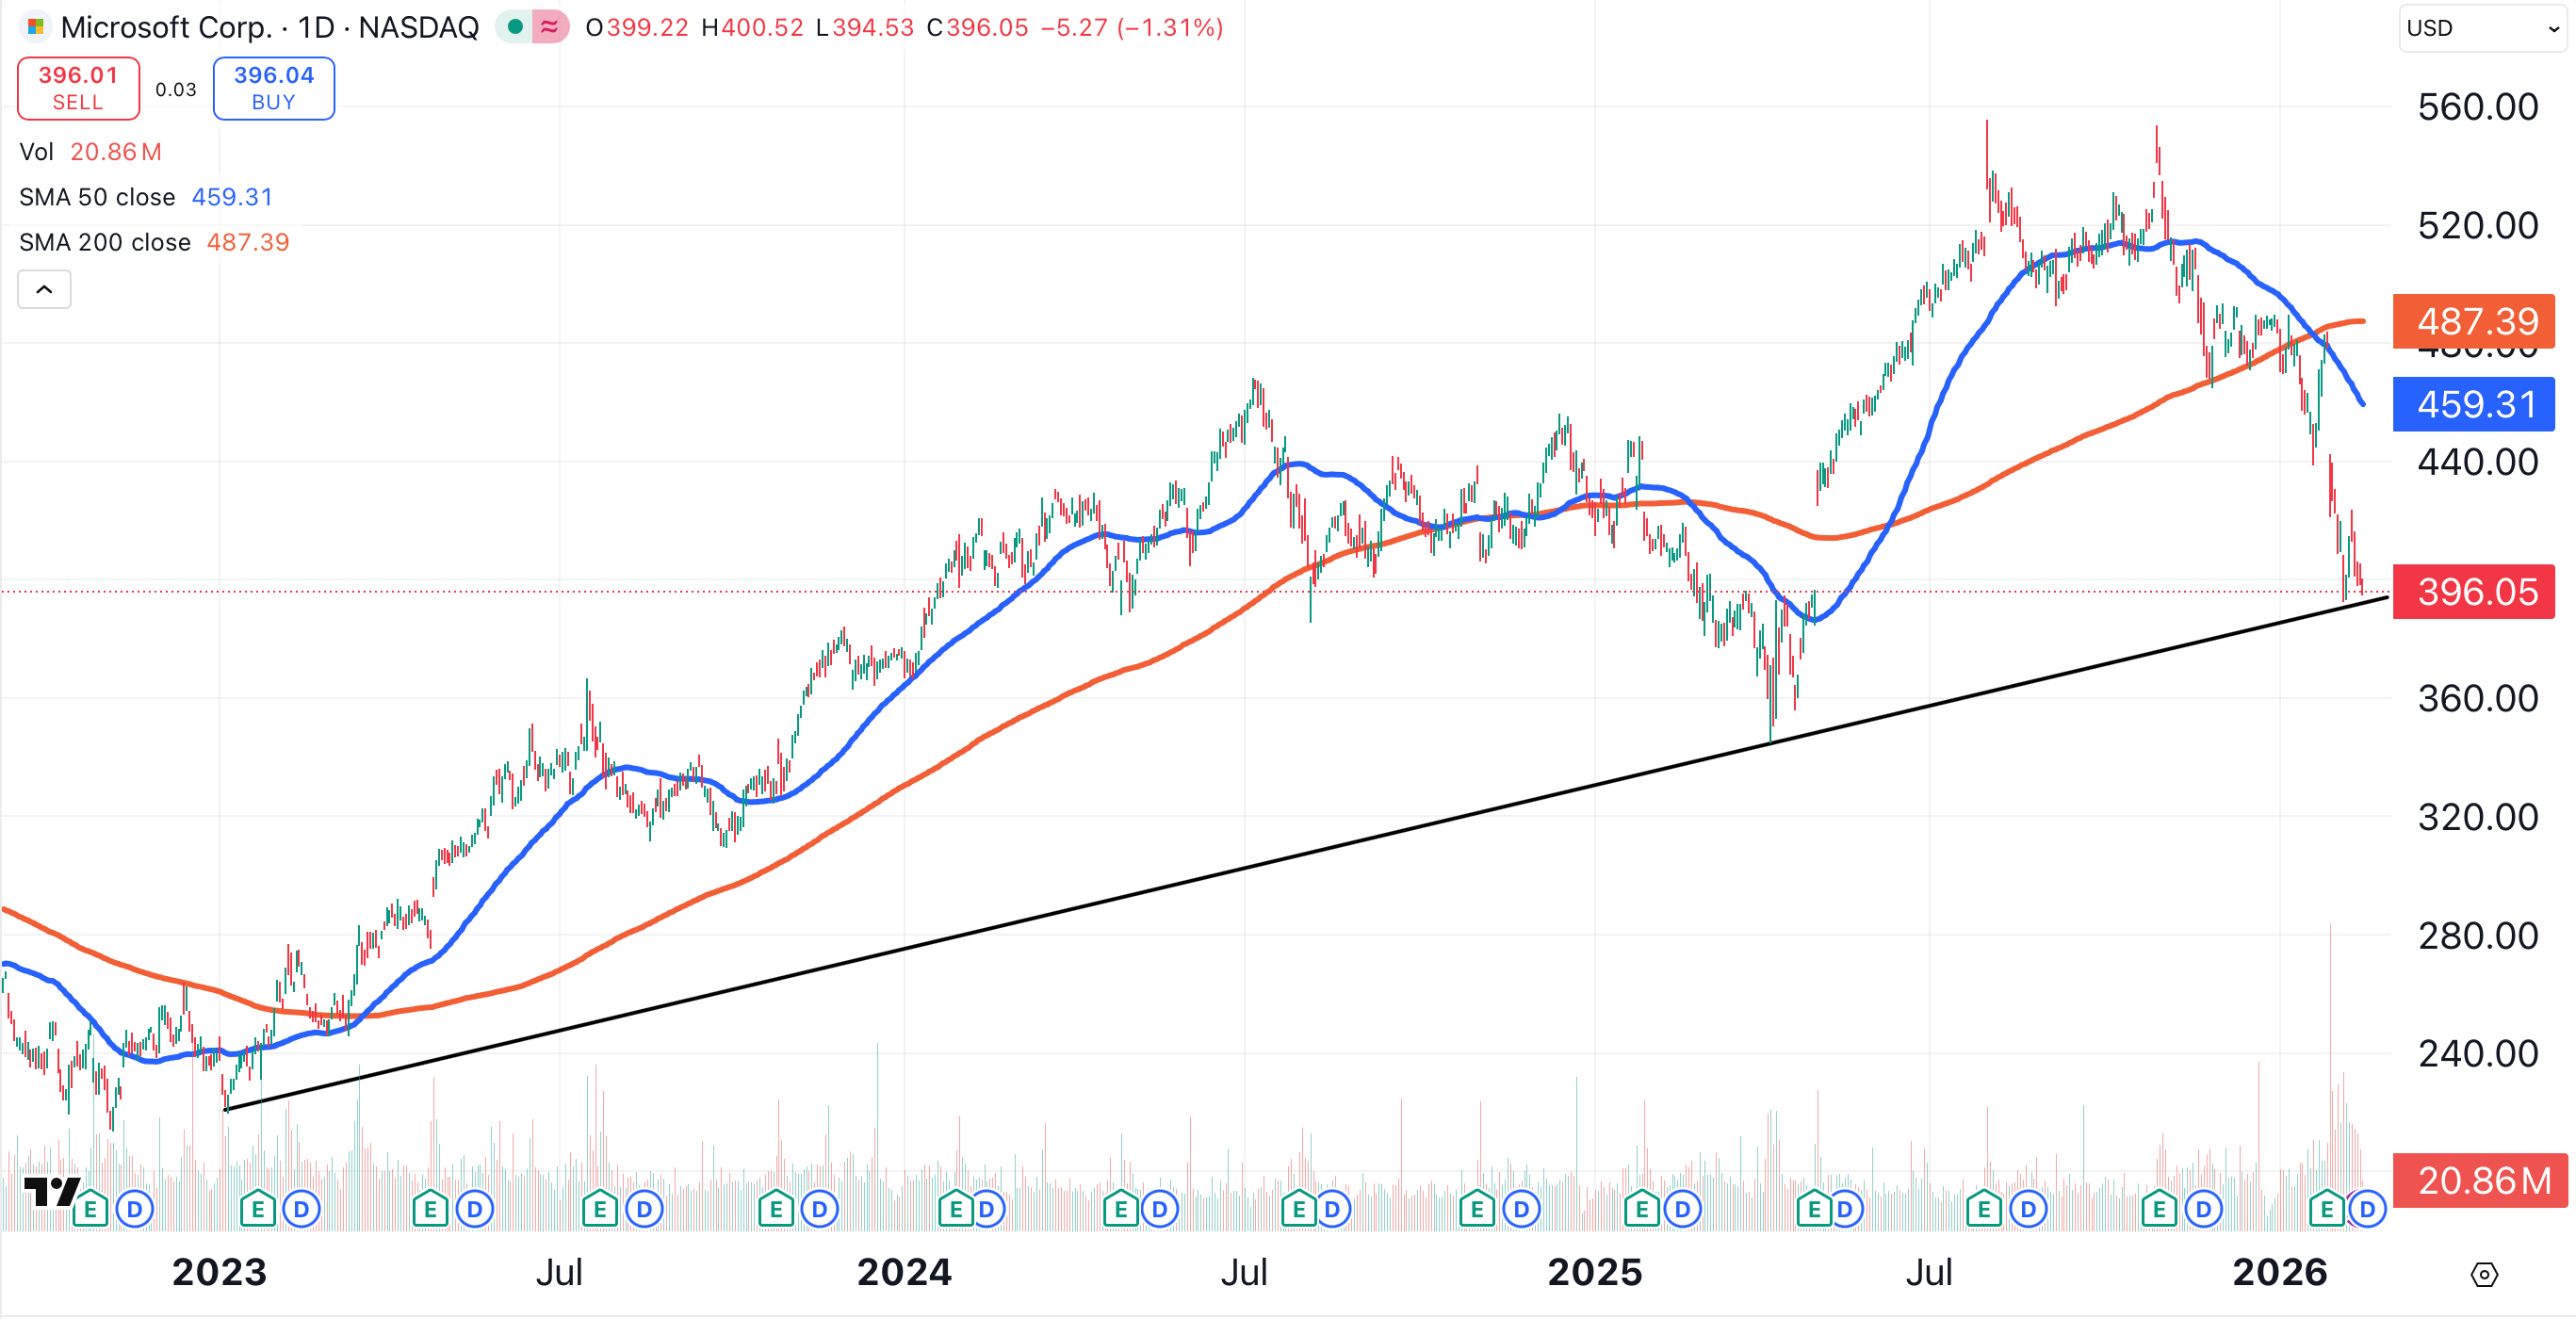
Microsoft is already trading well below its 50-day (blue) and 200-day (red) moving averages. The stock could see a temporary bounce if that trend line holds, but Microsoft’s underperformance compared to the broader market is likely to continue.
GRADE: C-
At the time of publication, Ponsi was long AAPL.
