Grading Nvidia and Top Semiconductor Stock Winners as Sector Struggles
These charts demonstrate the huge gulf between the winners and the losers in this sector and I'm picking one to buy.
You've reached your free article limit
You've read 0 of 1 free Pro articles.
Semiconductor stocks haven’t been great lately, but there are a few names that are outperforming both the sector and the overall market. Recently, the bullish charts of several semi stocks have been overshadowed by the weaker names in the sector.
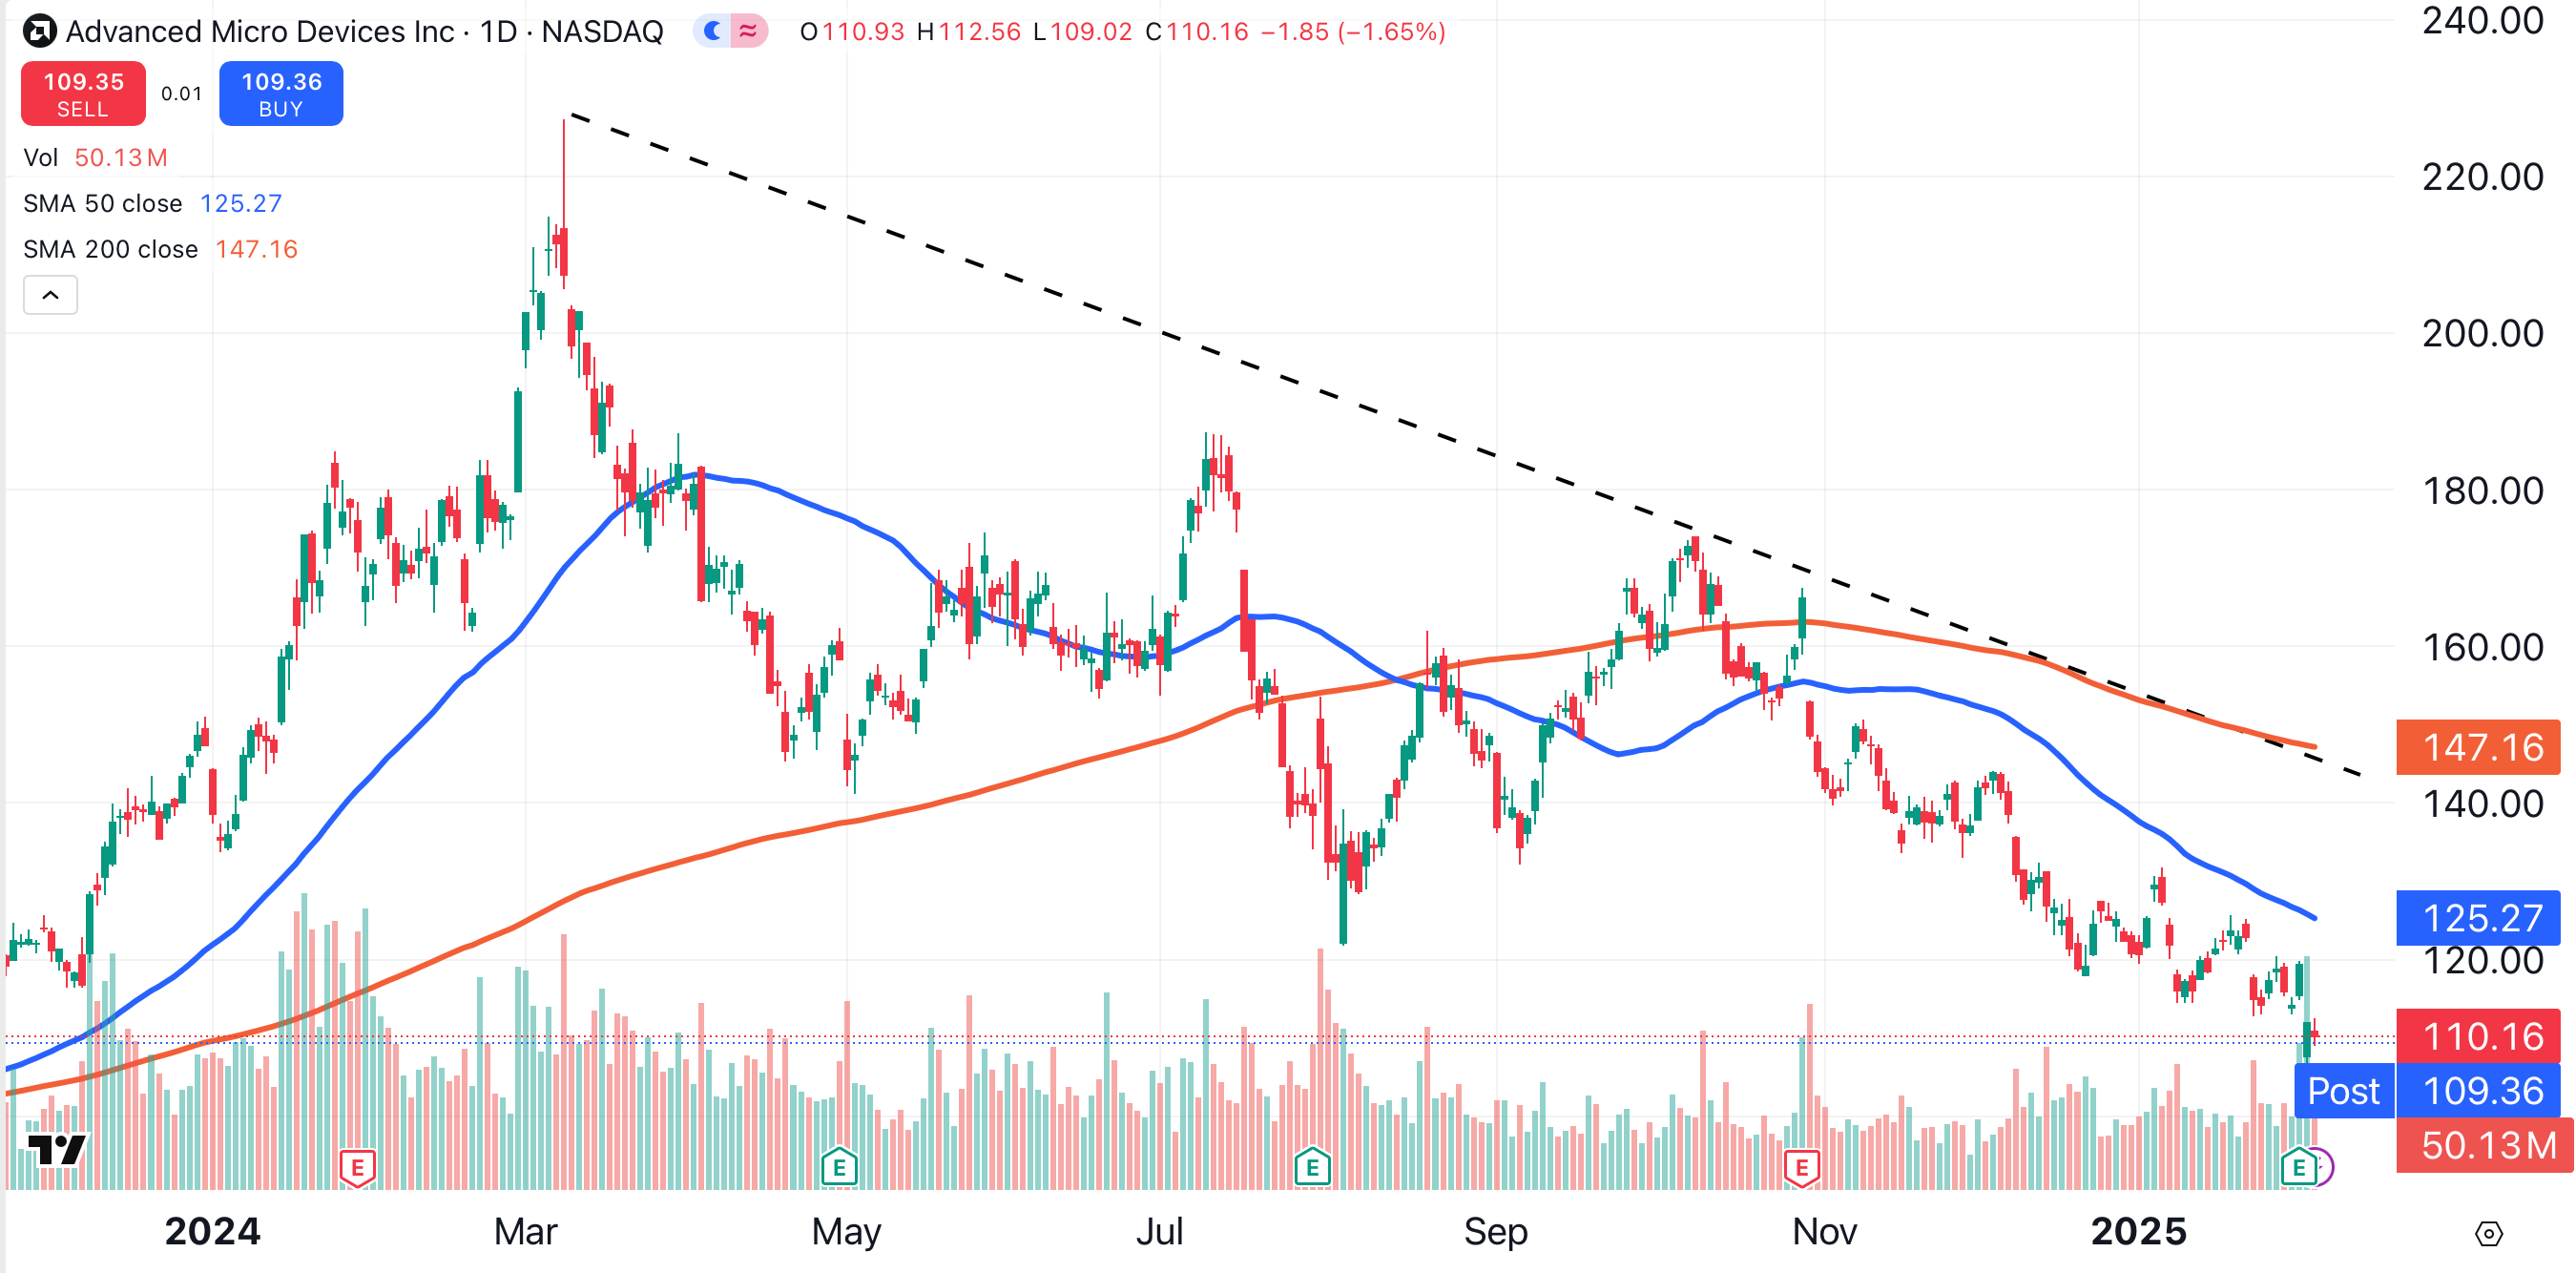
For example, Advanced Micro Devices AMD fell to a 52-week low this week, after reporting earnings. The Santa Clara, California-based semiconductor provider beat earnings expectations, but investors were dismayed with the company’s revenue from data centers.
AMD shares have fallen 15% over the past month. The stock is trading below its 50-day moving average (blue), 200-day moving average (red), and its bearish trend line (black dotted line).
Advanced Micro isn’t alone. Overall, the semiconductor sector has been a disappointment.
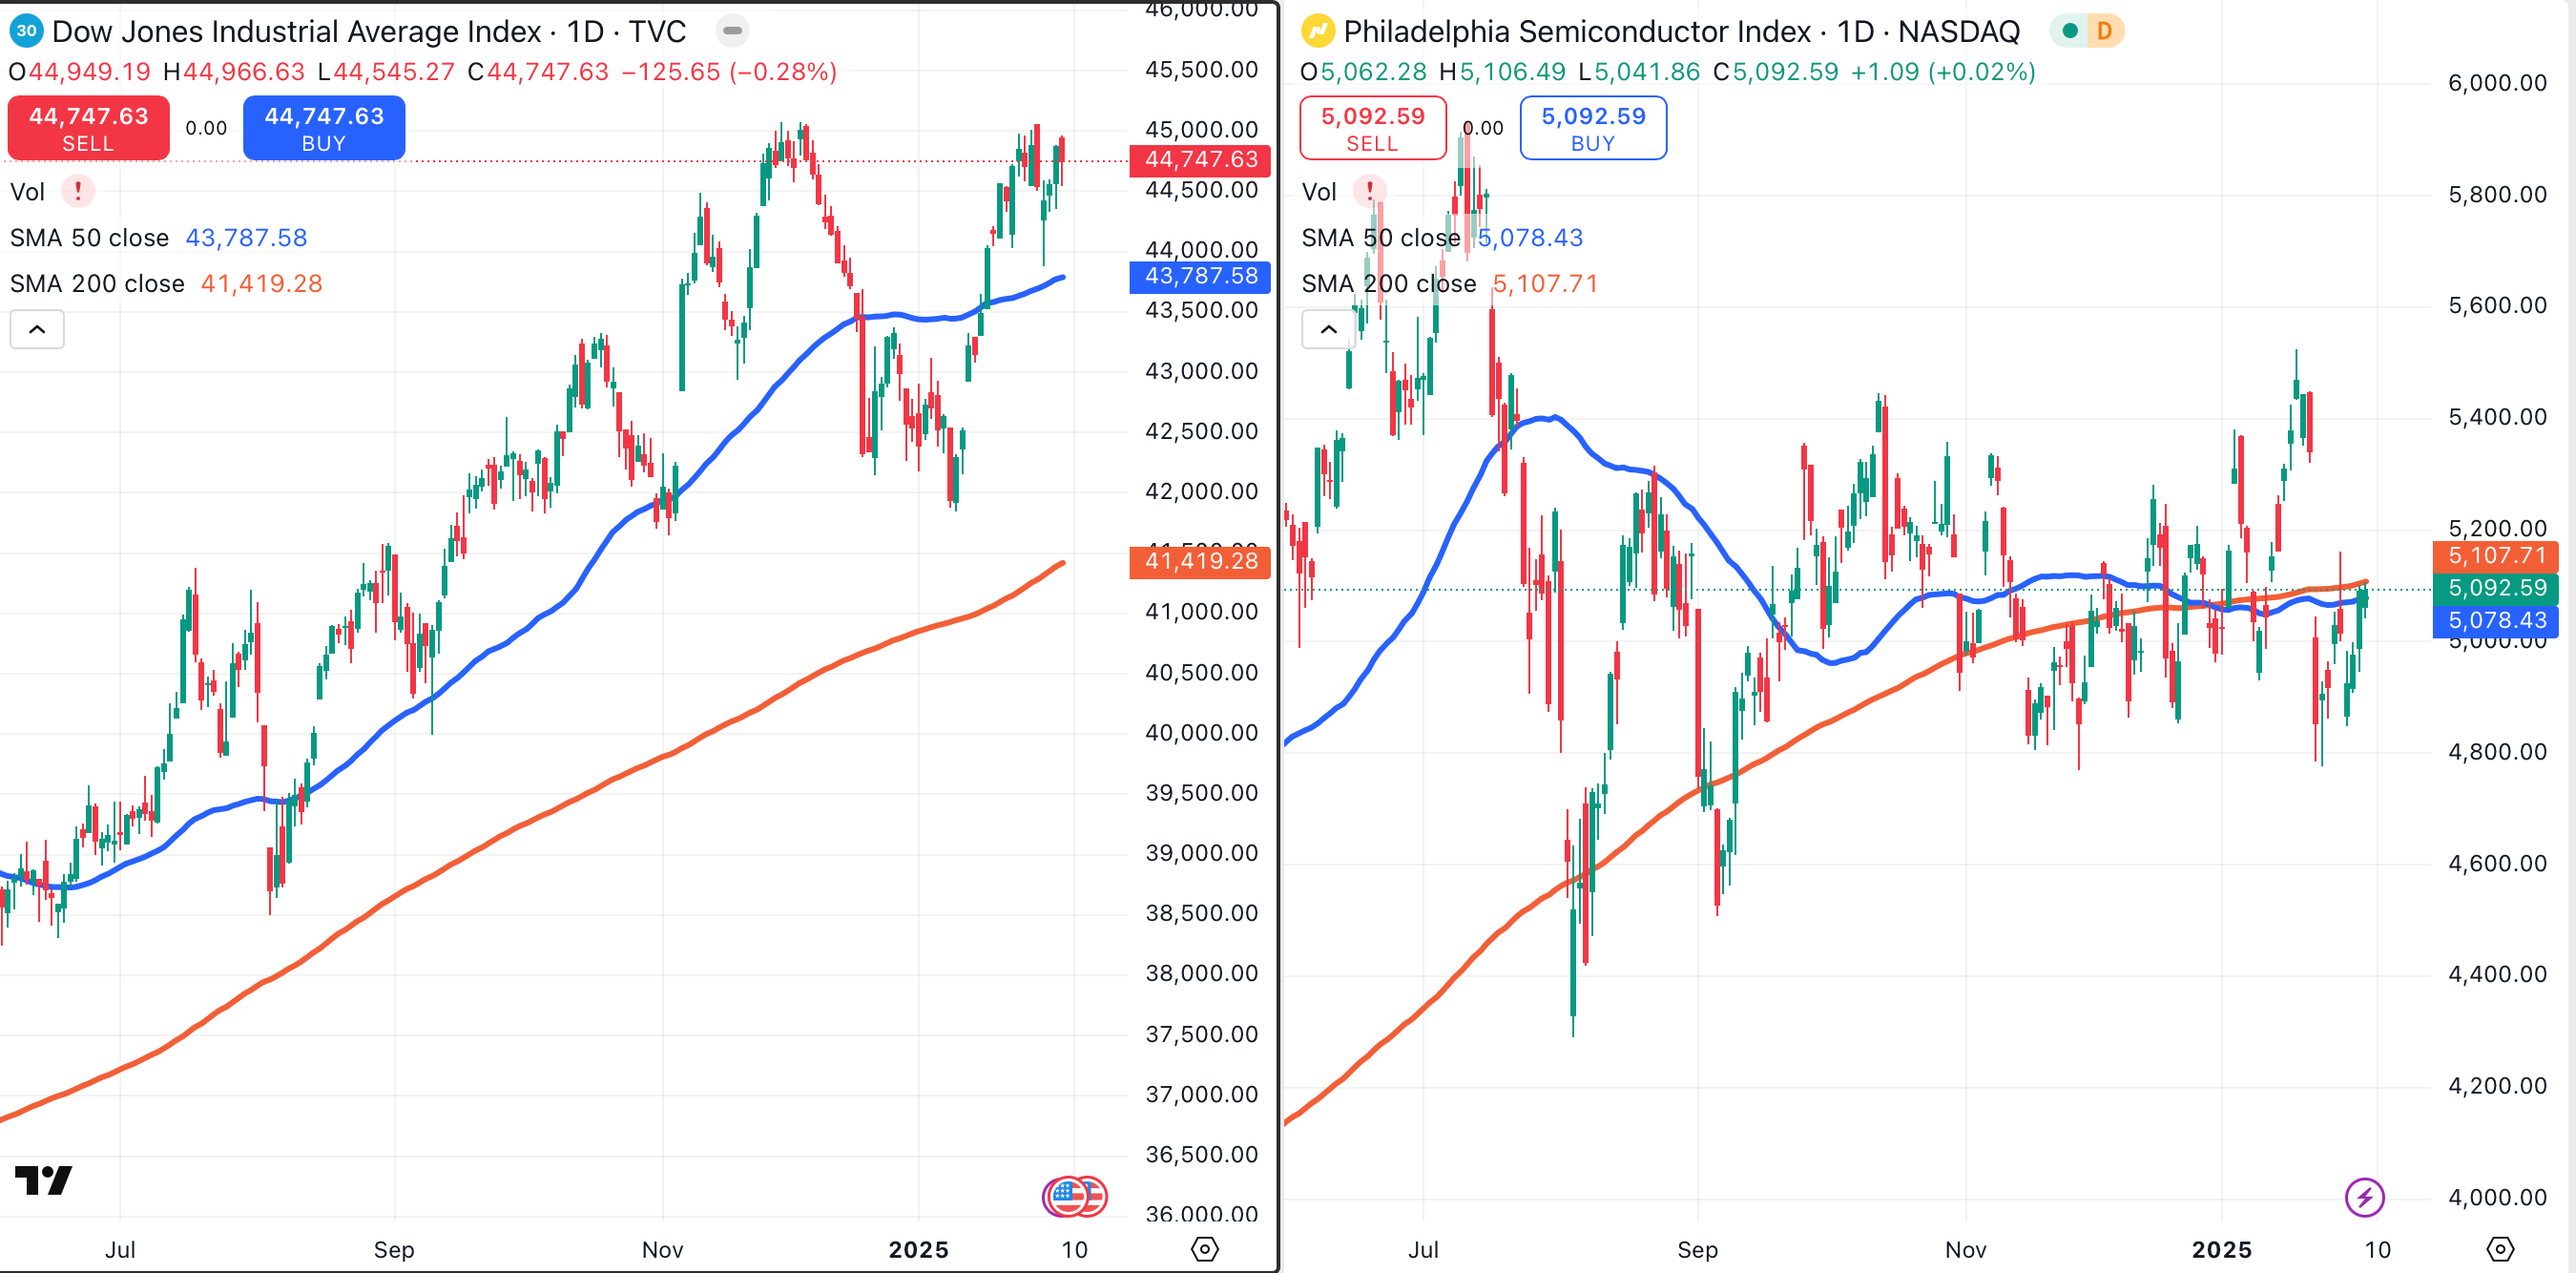
This comparison chart of the Dow Jones Industrial Average (left chart) and the PHLX Semiconductor Index, or SOX (right chart), demonstrates just how badly the semis have underperformed the broader market.
The Dow remains in a bullish trend, and is trading within shouting distance of its all-time high. The PHLX Semiconductor Index has moved sideways for the past six months.
The damage isn’t contained to Advanced Micro Devices. The charts of Qualcomm Inc. QCOM, Intel Corp. INTC and Micron Technology MU all have a similar look, and are all trading below their respective 200-day MAs.
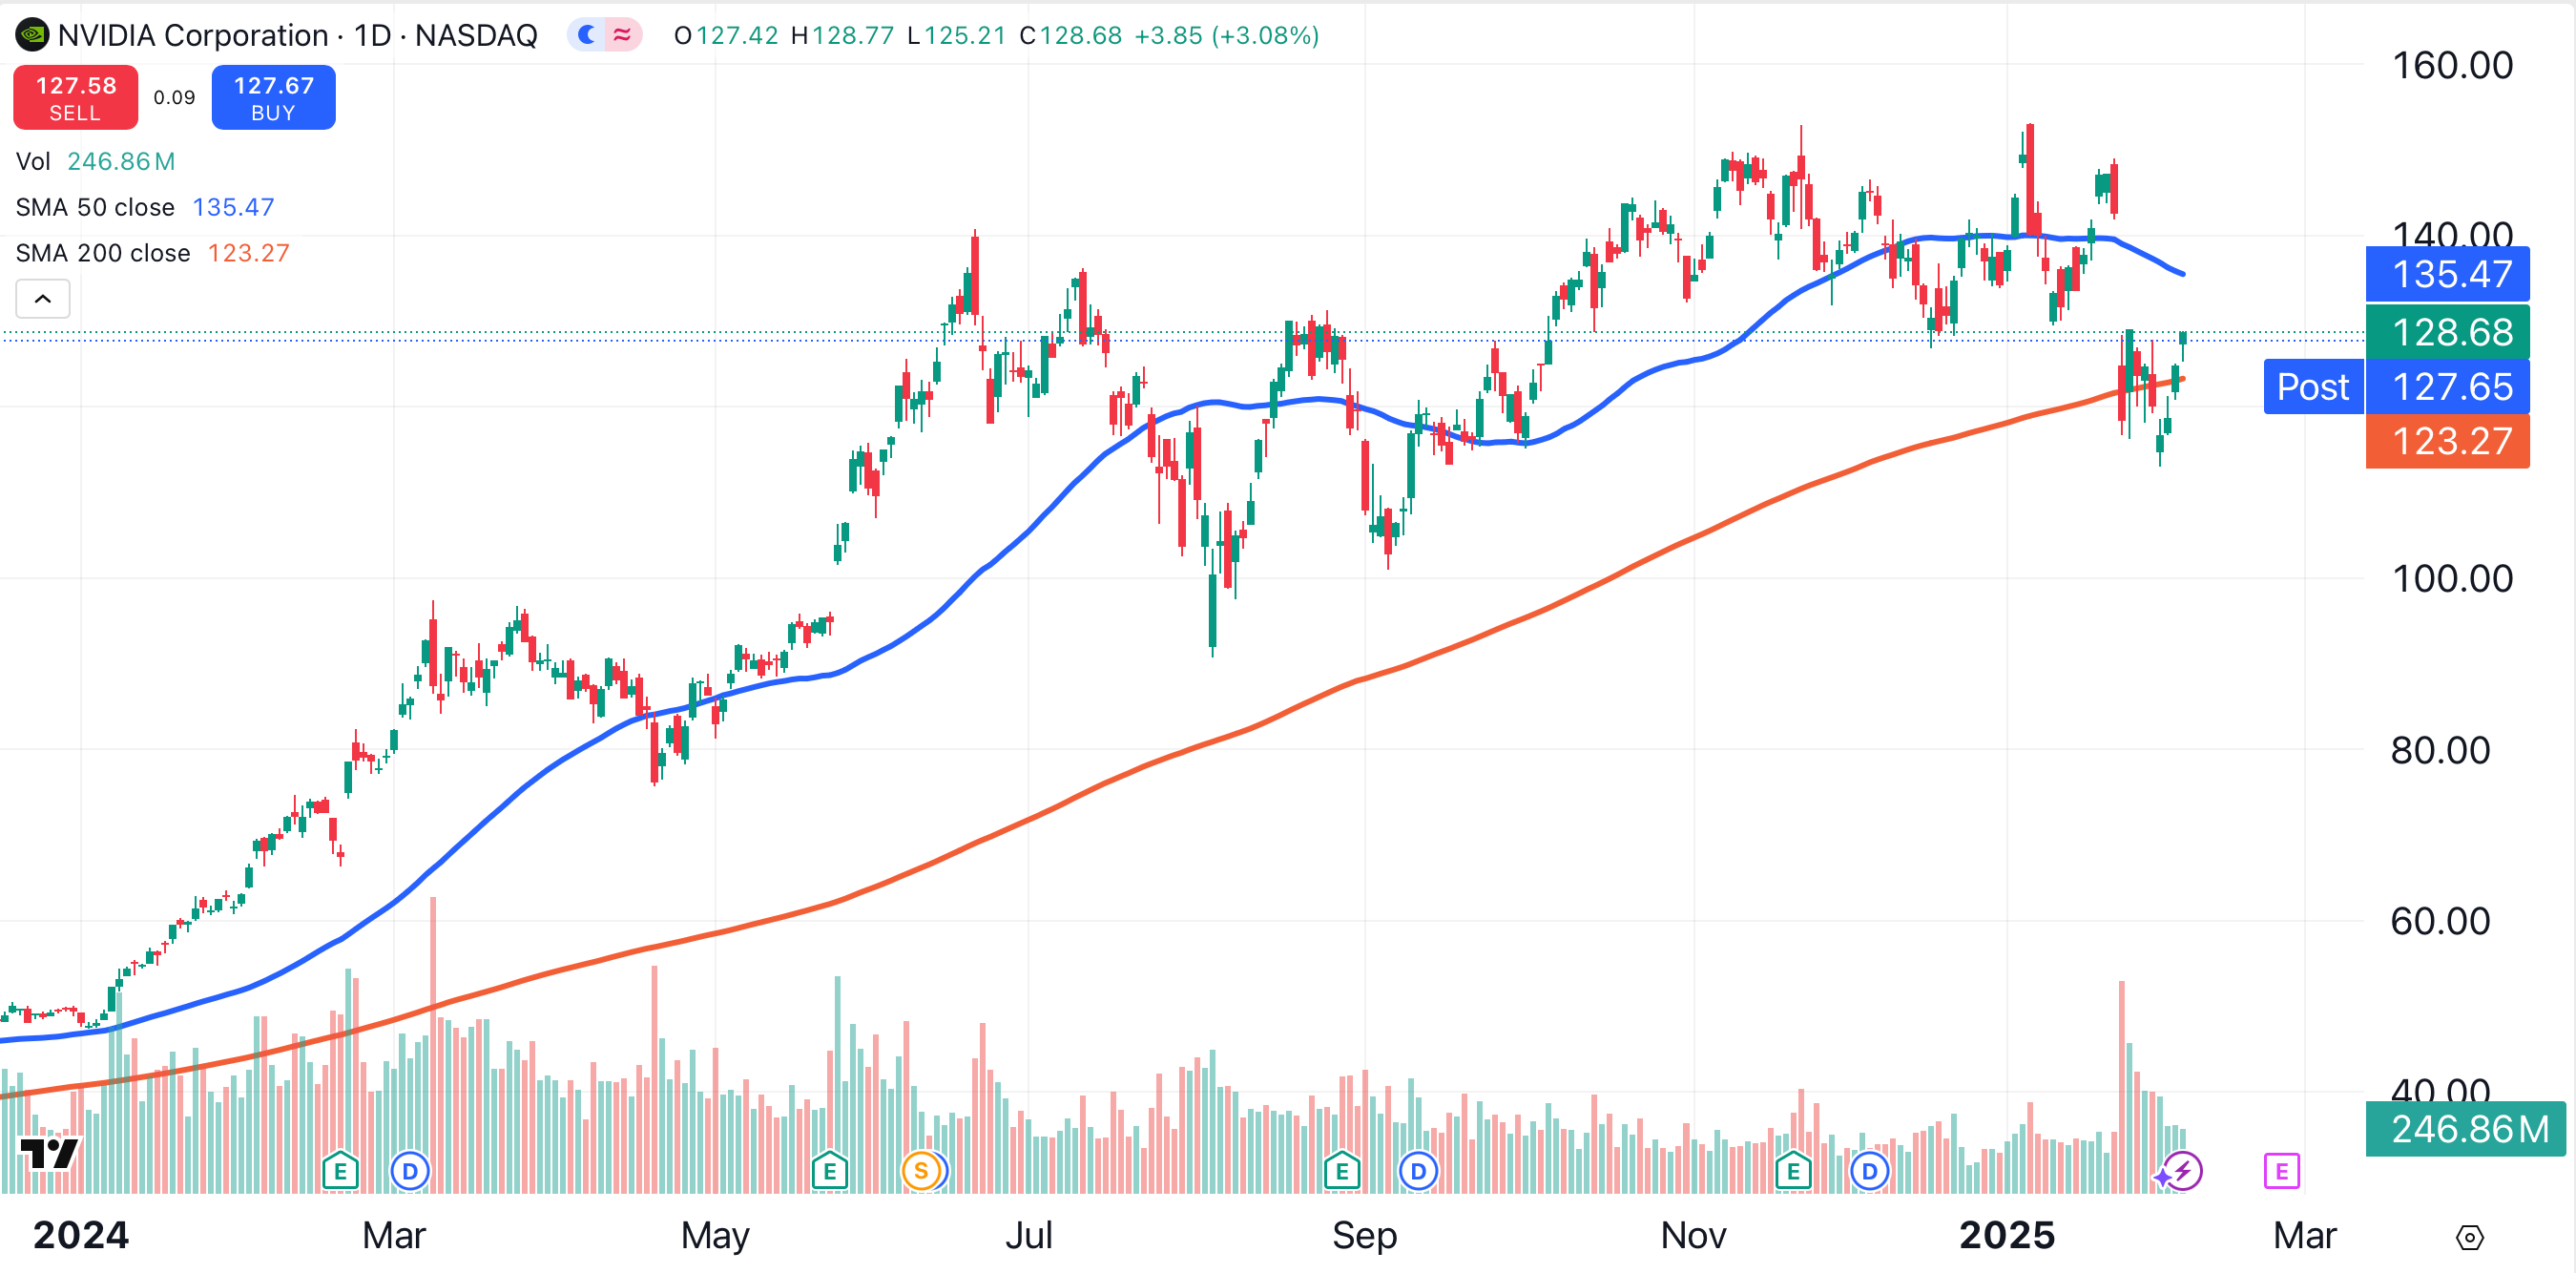
Fortunately, the news for semiconductor stocks isn’t all bad. For example, Nvidia NVDA has been soft recently, and has pulled back to its 200-day moving average (red).
However, the stock’s bullish trend remains intact. Nvidia shares have climbed by 30% over the past six months.
The manufacturer of AI-related chips is trapped between its 50-day and 200-day MAs. Nvidia’s 50-day moving average is tilting downward for the first time since September. Nvidia is scheduled to report earnings on February 26.
GRADE: B
Now, compare Nvidia’s chart to Broadcom AVGO. San Jose-based Broadcom has gained nearly 70% over the past six months.
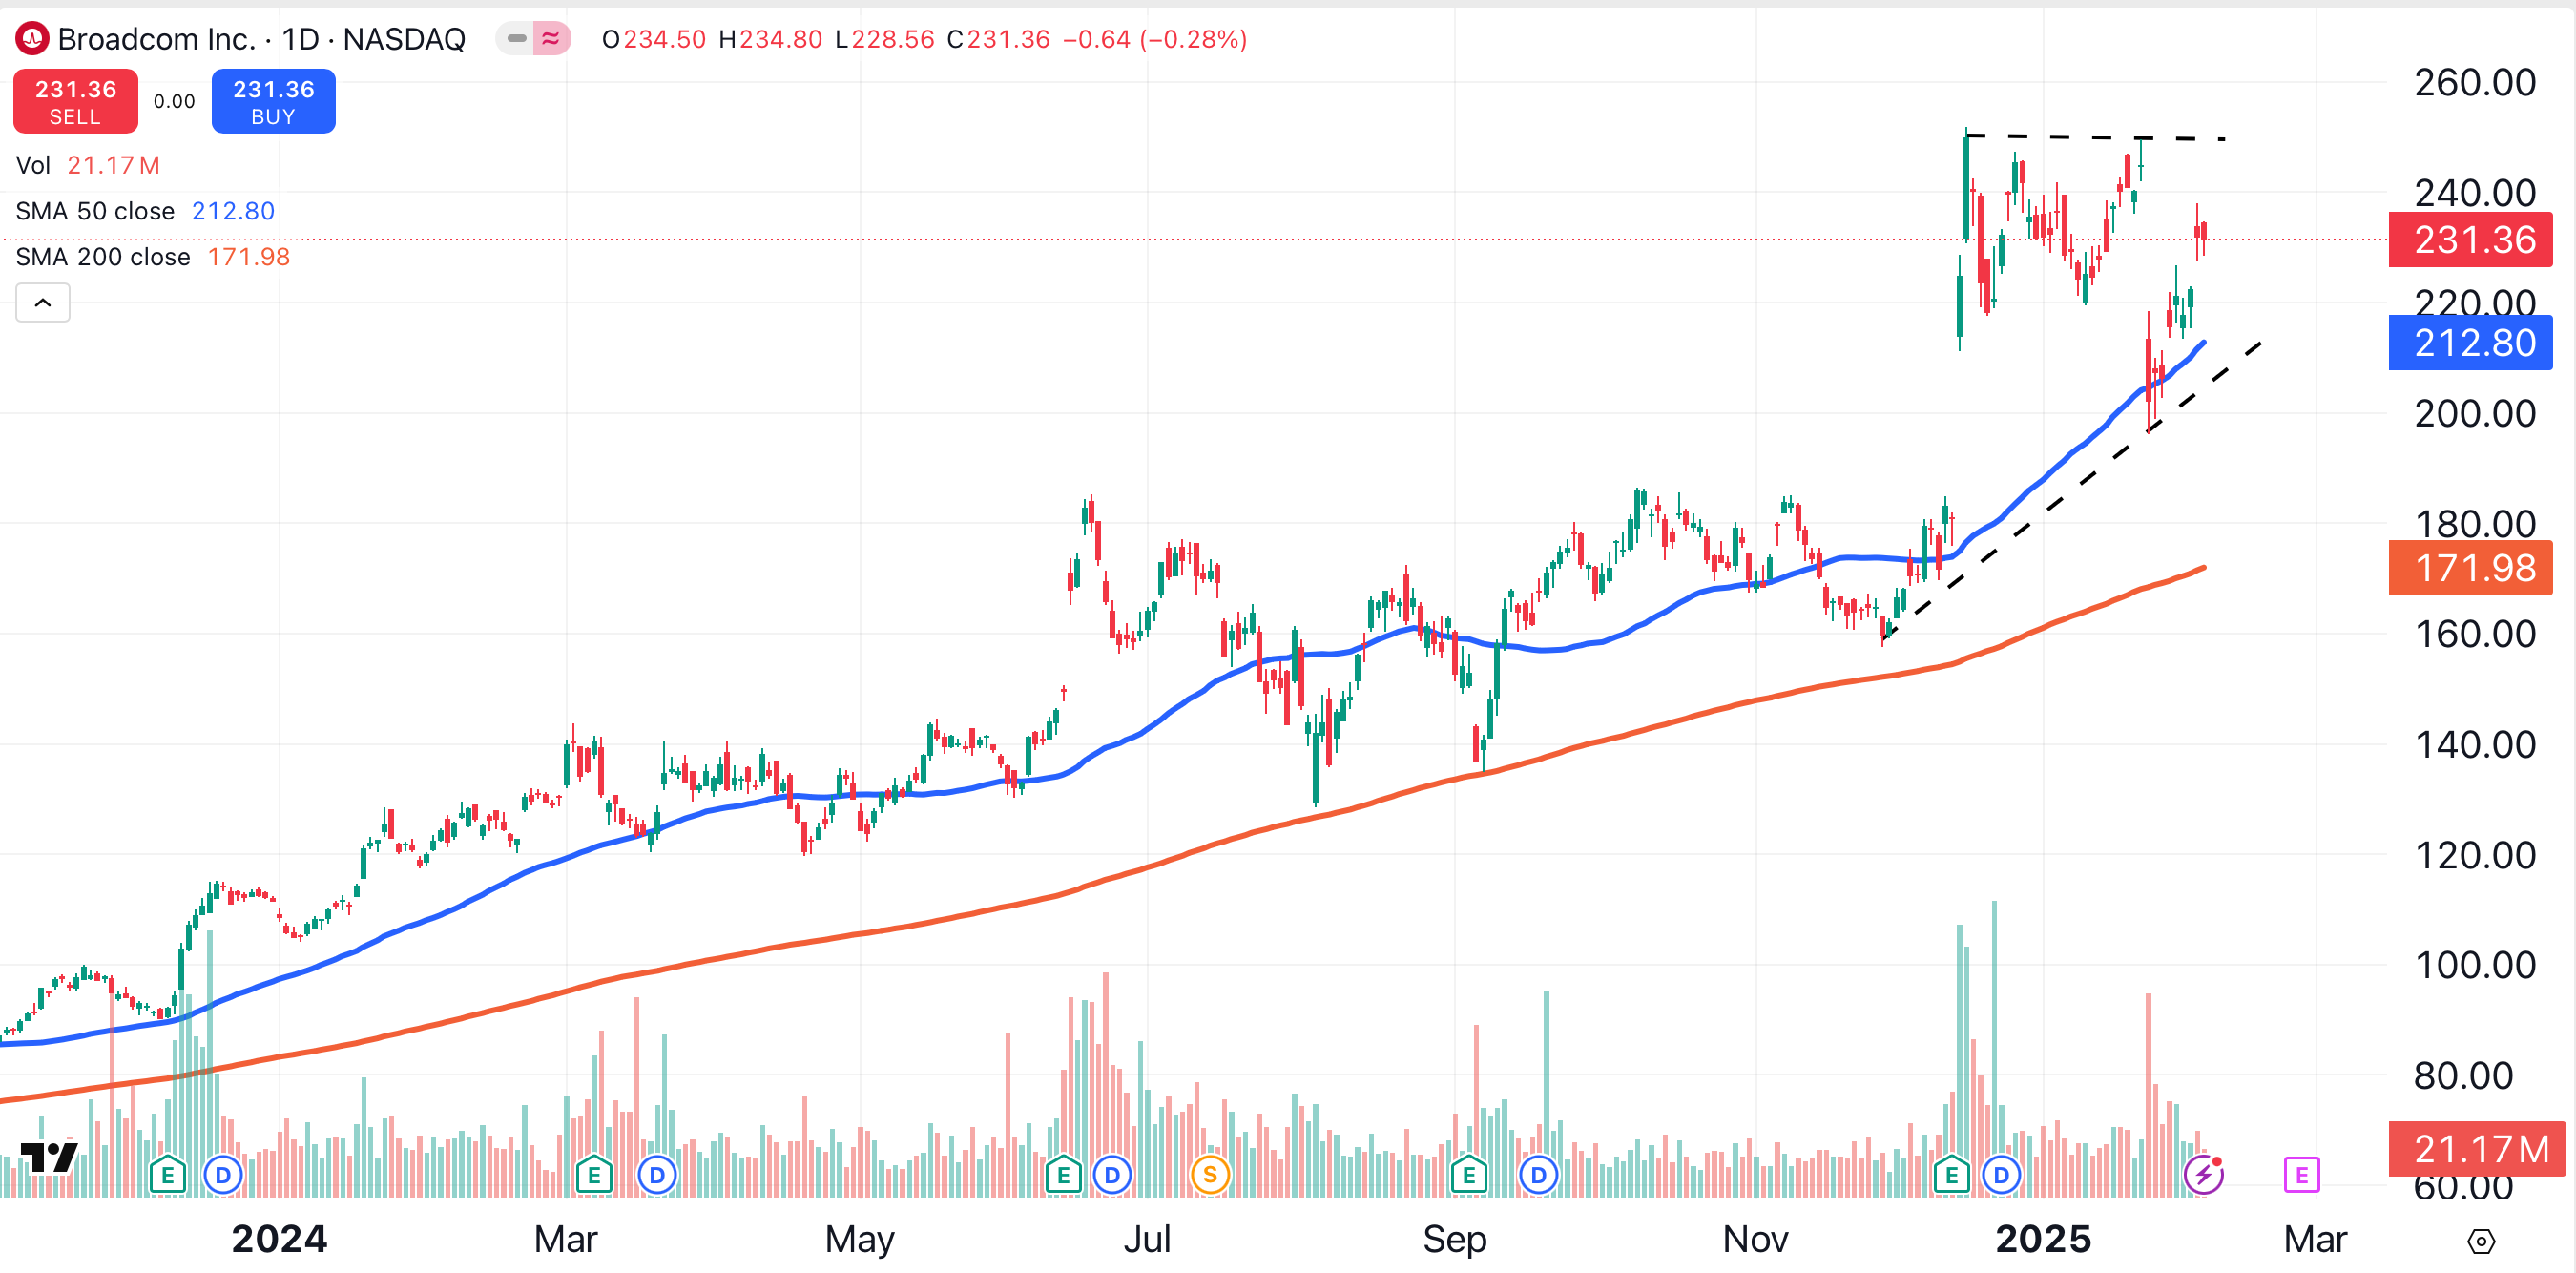
Broadcom is trading above its key moving averages, and has formed a bullish technical pattern known as an ascending triangle (black dotted lines). The pattern suggests Broadcom could eventually reach $300.
GRADE: A
While Broadcom is my top pick in this sector, Taiwan Semiconductor TSM also has an impressive chart.
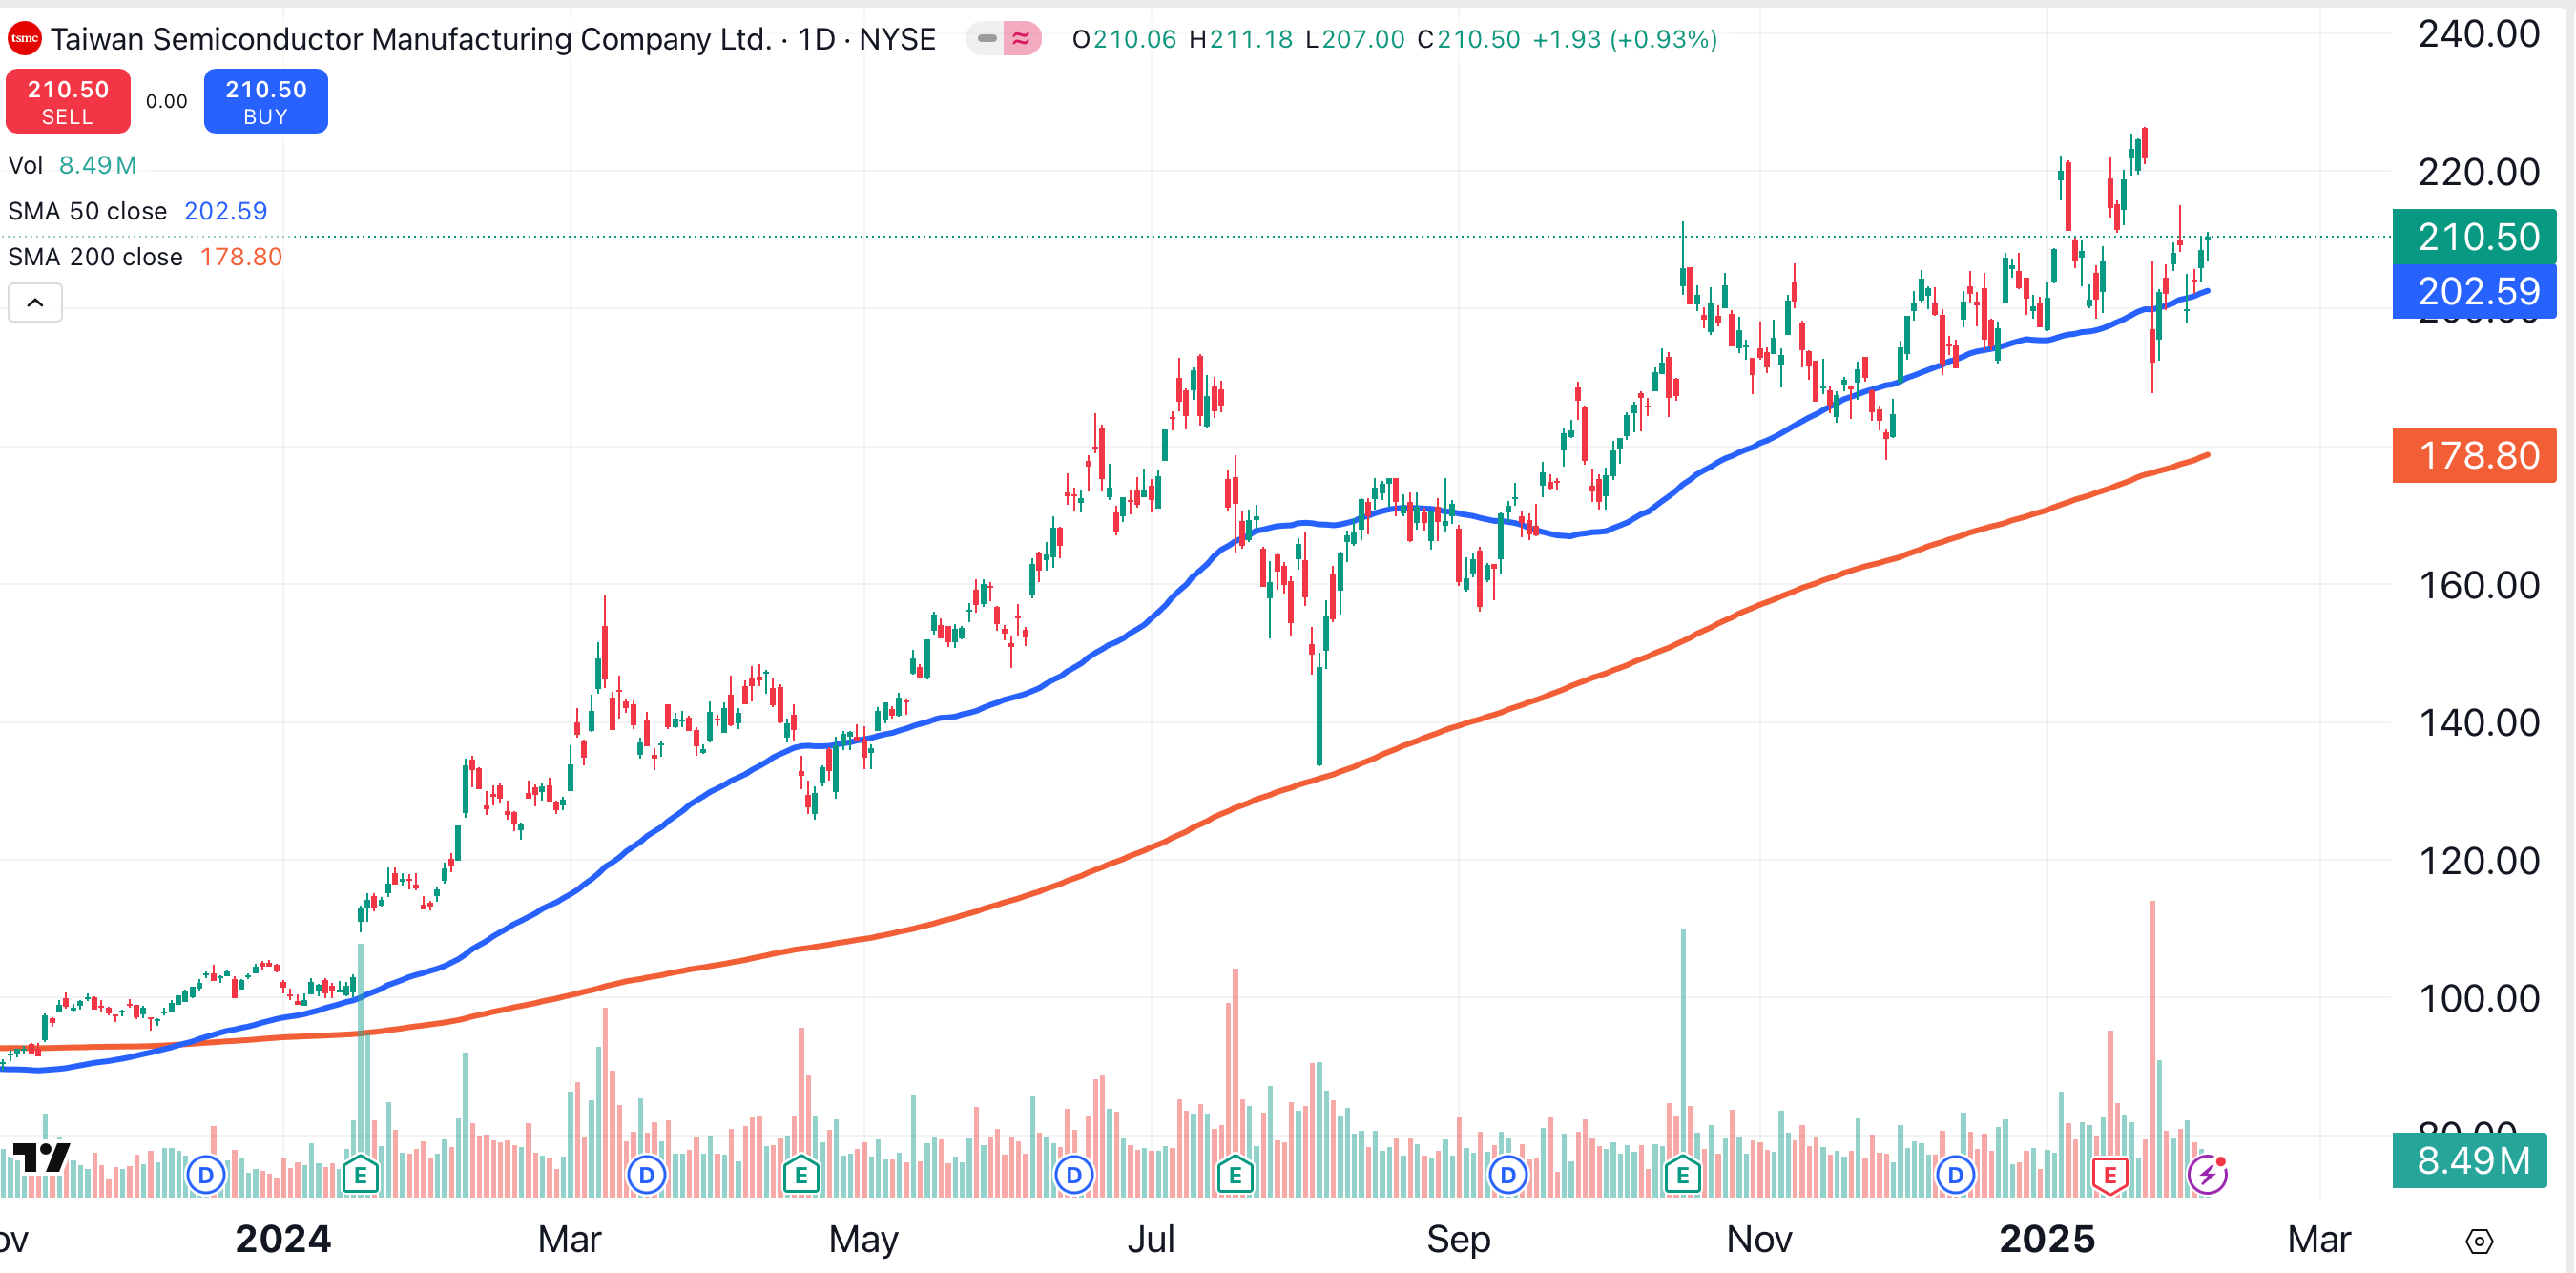
Despite a recent earnings miss, Taiwan Semiconductor remains in a bullish trend, and remains above its key moving averages. This stock has gained 36% over the past six months.
GRADE: A-
Clearly, there is a huge gulf between the winners and the losers in this sector. I'm sticking with Broadcom and adding Taiwan Semiconductor at current levels.
At the time of publication, Ponsi was long AVGO and TSM.
