Gold and Silver Have a Sentiment Problem
Precious metals had a big day, but now what? Here's what I recommend. Also, a look at the stubborn indicators, the SOX, Coinbase, Rocket Lab, MongoDB, Ethereum and much more!
You've reached your free article limit
You've read 0 of 1 free Pro articles.
The Market
The metals had a big day while the semis sat it out Tuesday. But I must report that the Daily Sentiment Index (DSI) on gold jumped to 88 Tuesday. My measured target is still in the $340 area for GLD but with the DSI at 88 I would be in favor of taking a little bit off the table.
The DSI for gold last got to this level when it tagged 87 in mid-April. Prior to that it got to 89 in May of 2024. Both led to a correction. And while we have not discussed silver much, its DSI is 87 so it, too, has a sentiment problem now.
As for the market as a whole, there wasn’t much selling Tuesday. Oh sure, it felt like there was but the downside volume got to about 75% on the NYSE. Over on the Nasdaq it was positive for most of the day. I guess it just shows us that when the mega-caps take a day off there is room for the others to grab some love.
But did any of the indicators change? They did not. Some day I will say the indicators changed, but today is not that day!
One thing I think was interesting was that with the exception of the semis (SOX), almost any index that got close to the 50-day moving average and tried to break it, ended up bouncing off it. For many this was the first trip to the 50 DMA since April. This is the first time the SOX broke under its 50 DMA since April. But keep in mind 50 trading days ago was the last week of June and the SOX peaked in early July so the SOX has been chopping around, using up time, allowing the moving average to catch up for months now.
In my view, not much changed except that with the DSI for the precious metals so high they probably need a rest. That’s the rotation.
New Ideas
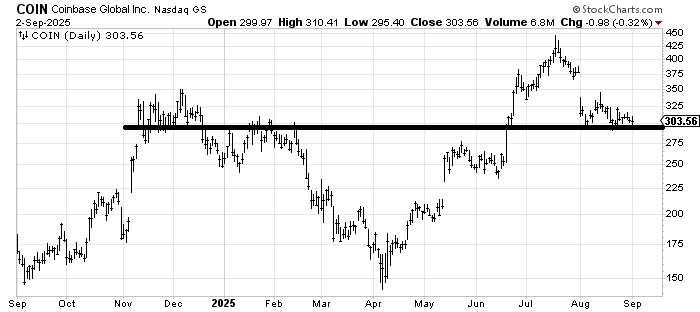
Prior to my vacation I discussed that I wanted a pattern to set up in certain stocks, such as Palantir PLTR and Coinbase COIN. Coinbase is coming along. Notice how it is struggling to break that $300-ish area and just keeps bouncing around. A move up and over $300-ish. I think I am a bit early.
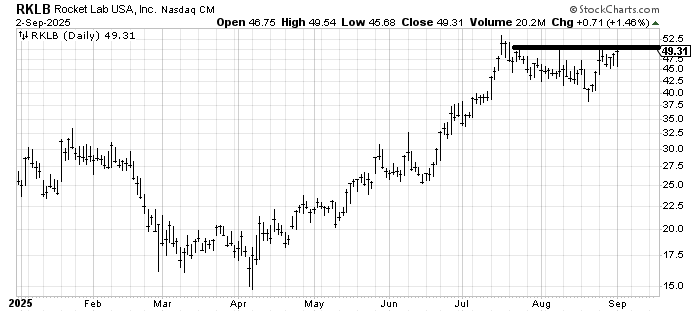
I was asked for a target on Rocket Lab RKLB, which I recommended about a week before my vacation. I do not have one yet. If it can break out I believe it would measure into the upper $50s but I would need to see how it breaks out. I am still a fan.
Today’s Indicator
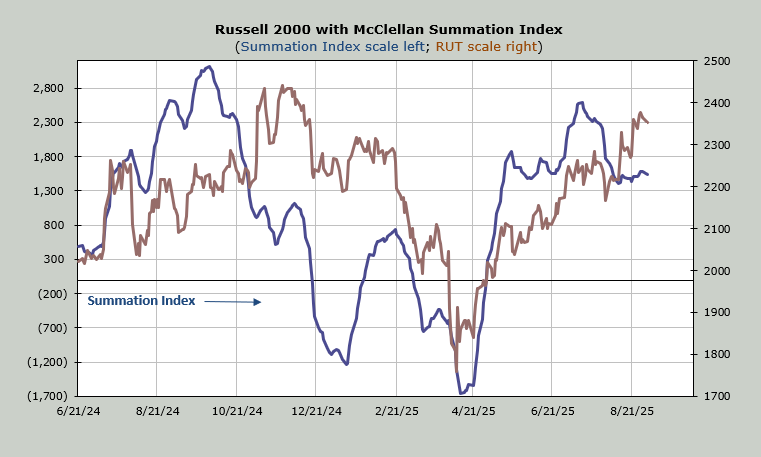
The McClellan Summation Index is still milling about. It still needs a net differential of +1,100 advancers minus decliners on the NYSE to stop the downward slant and more to turn it up with any conviction.
Q&A/Reader’s Feedback
Helene welcomes your questions about Top Stocks and her charting strategy and techniques. Please send an email directly to Helene with your questions. However, please remember that TheStreet.com Top Stocks is not intended to provide personalized investment advice. Email Helene here.
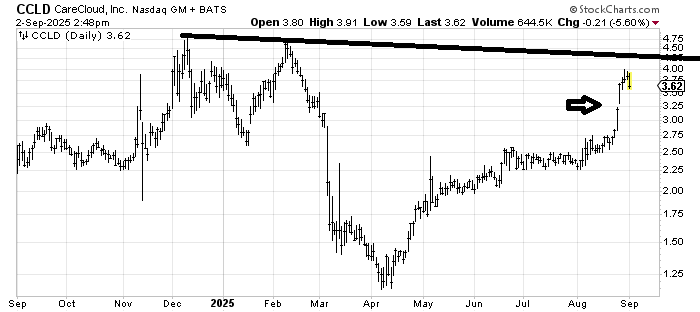
CareCloud (CCLD) had a nice spurt in late August and now seems to be digesting the move. My guess is the stock will rally again after the pullback (possibly to fill that tiny little gap around $3.25 — arrow on the chart). What I am unsure of is if the next rally can get over that resistance line. The chart tends to have spikes and then a whole lot of nothingness after. If it does rally after filling that gap ping me on this again and we can re-assess.
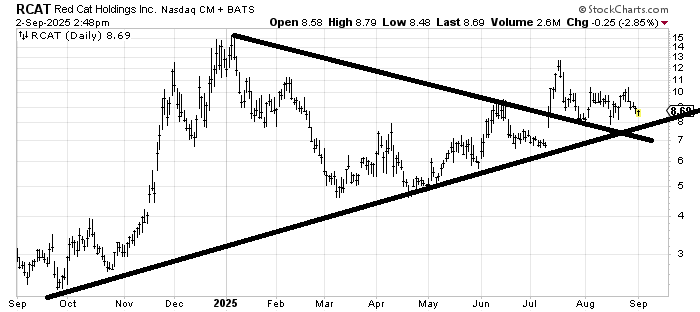
Red Cat Holdings RCAT needs to hold that uptrend line/support around $8-ish. I suppose it might even opt to fill the gap around $7. The chart looks mostly sideways to me.
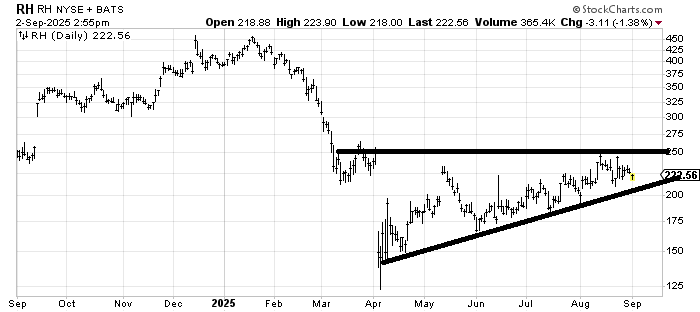
RH RH is like so many stocks: a whole lot of nothing. It tried to break out but couldn’t. So far it hasn’t been able to break down. Even if it breaks the uptrend line (around $200) there is still support all the way down.
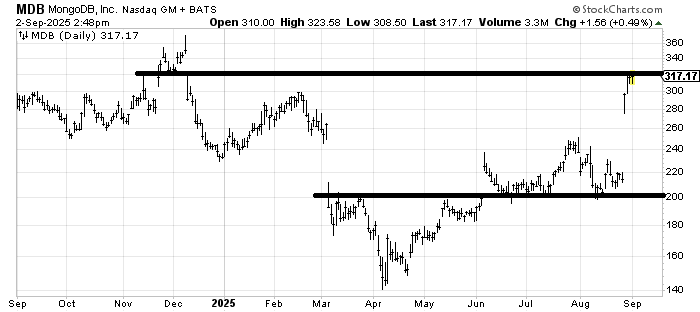
MongoDB MDB is at resistance. I would have loved it to fill that gap around $340 but it has not done so. I suspect it tries to do so. Can it pull back first? Yes, but if it comes back to that $220-240 area do you really want to hold on for such a pullback? The chart has so many gaps over the years my inclination is to hold with a tight stop rather than chase.
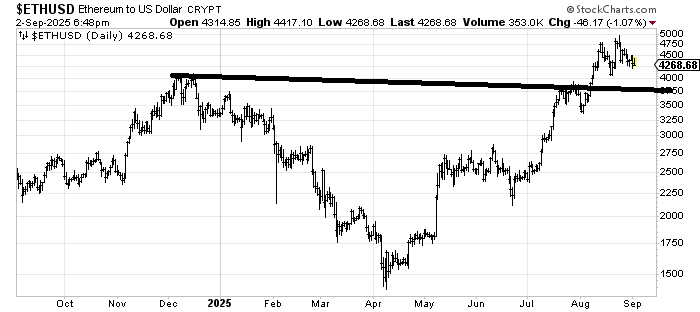
I cannot get excited about the chart of Ethereum ETH. If it came down to $3,750 (the line) I might be convinced it would rally from there. Longer term, the chart says it ought to measure to $5,700-ish. I just prefer when a pattern sets up or it’s down and out and this has neither.