Giving 'Credit' Where Credit's Due
Why the recent chart moves in Visa, Mastercard, and American Express could be a bullish sign for the economy.
You've reached your free article limit
You've read 0 of 1 free Pro articles.
Is the bull run for stocks about to resume? Over the past month or so, markets have seen intermittent bouts of volatility, but little progress has been made.
Overall, the S&P 500 (left chart) and the Nasdaq Composite (right chart) continue to move in a sideways direction. The good news is that both consolidations (shaded yellow) are likely to resolve with a resumption of the existing bullish trends for these major indexes.
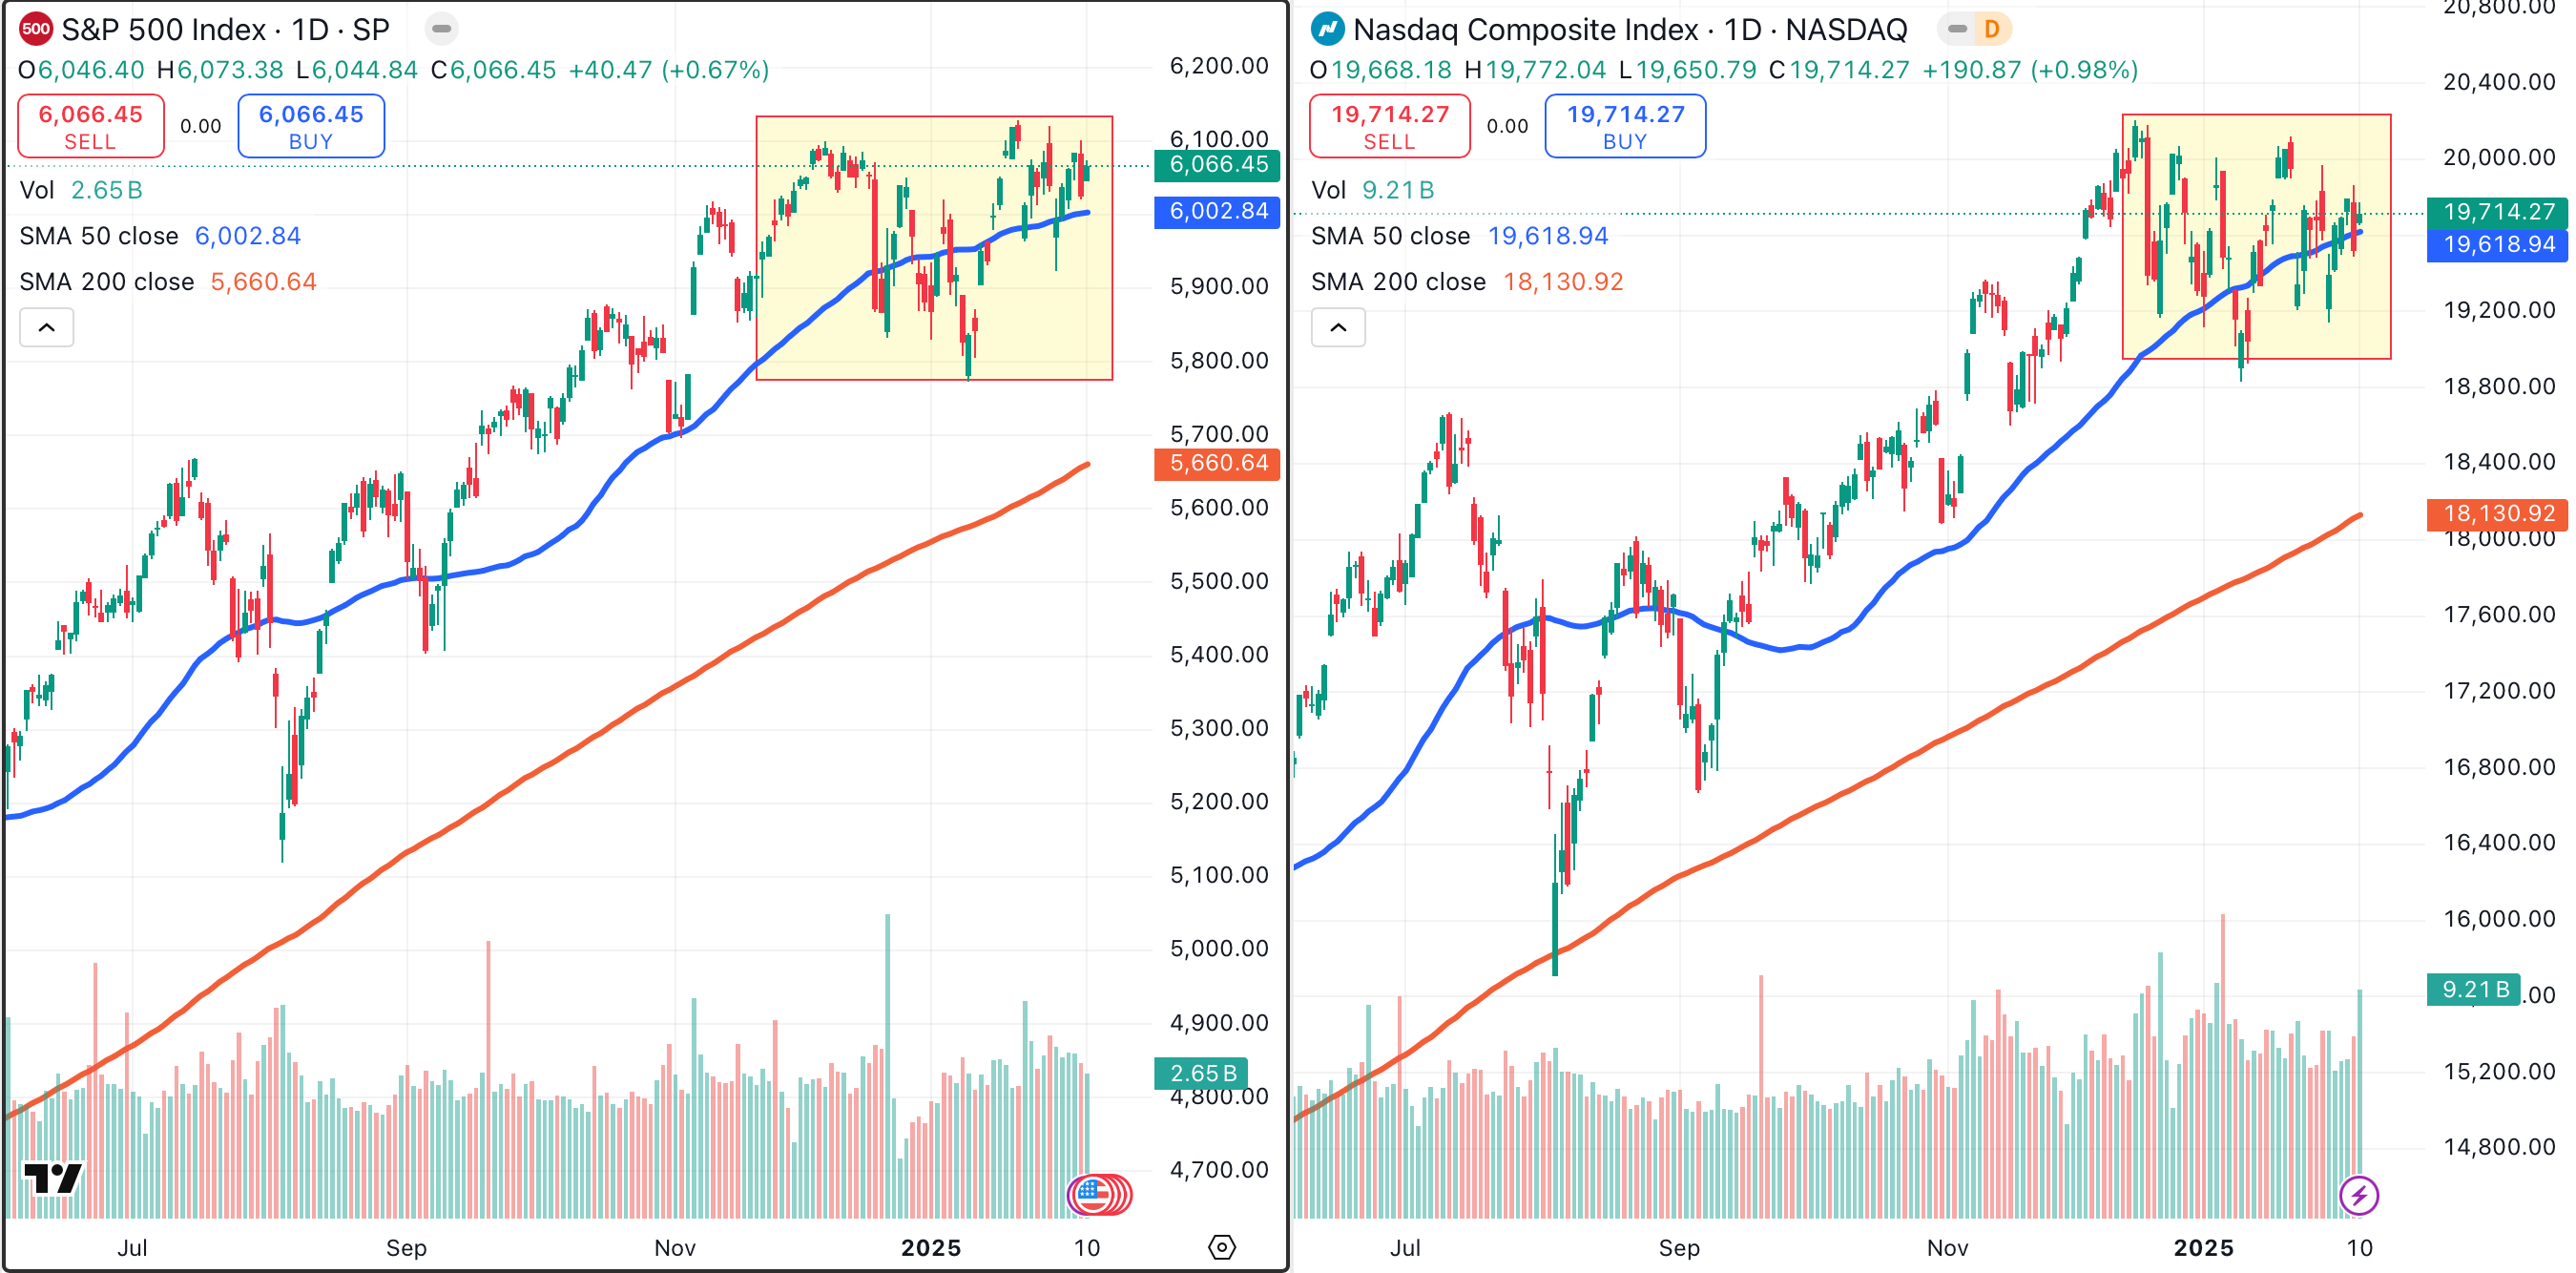
The S&P 500 hasn’t reached a new all-time high since Jan. 23, and the Nasdaq Composite has failed to do so since Dec. 16. Despite this minor malaise, the major moving averages for both indexes (200-day moving average = red, 50-day moving average = blue) are tilted higher, revealing that their respective bullish trends are intact.
Consolidations are normal market behavior after a major directional move. A consolidation is like sitting on the couch after a feast. You’re not going anywhere for a while, but eventually you'll get hungry and start moving again.
Not every sector is in consolidation mode. For example, the financial sector is outperforming the overall market right now. This could mean that when bullish trends for the major indexes resume, financial stocks are likely to be among the leaders.
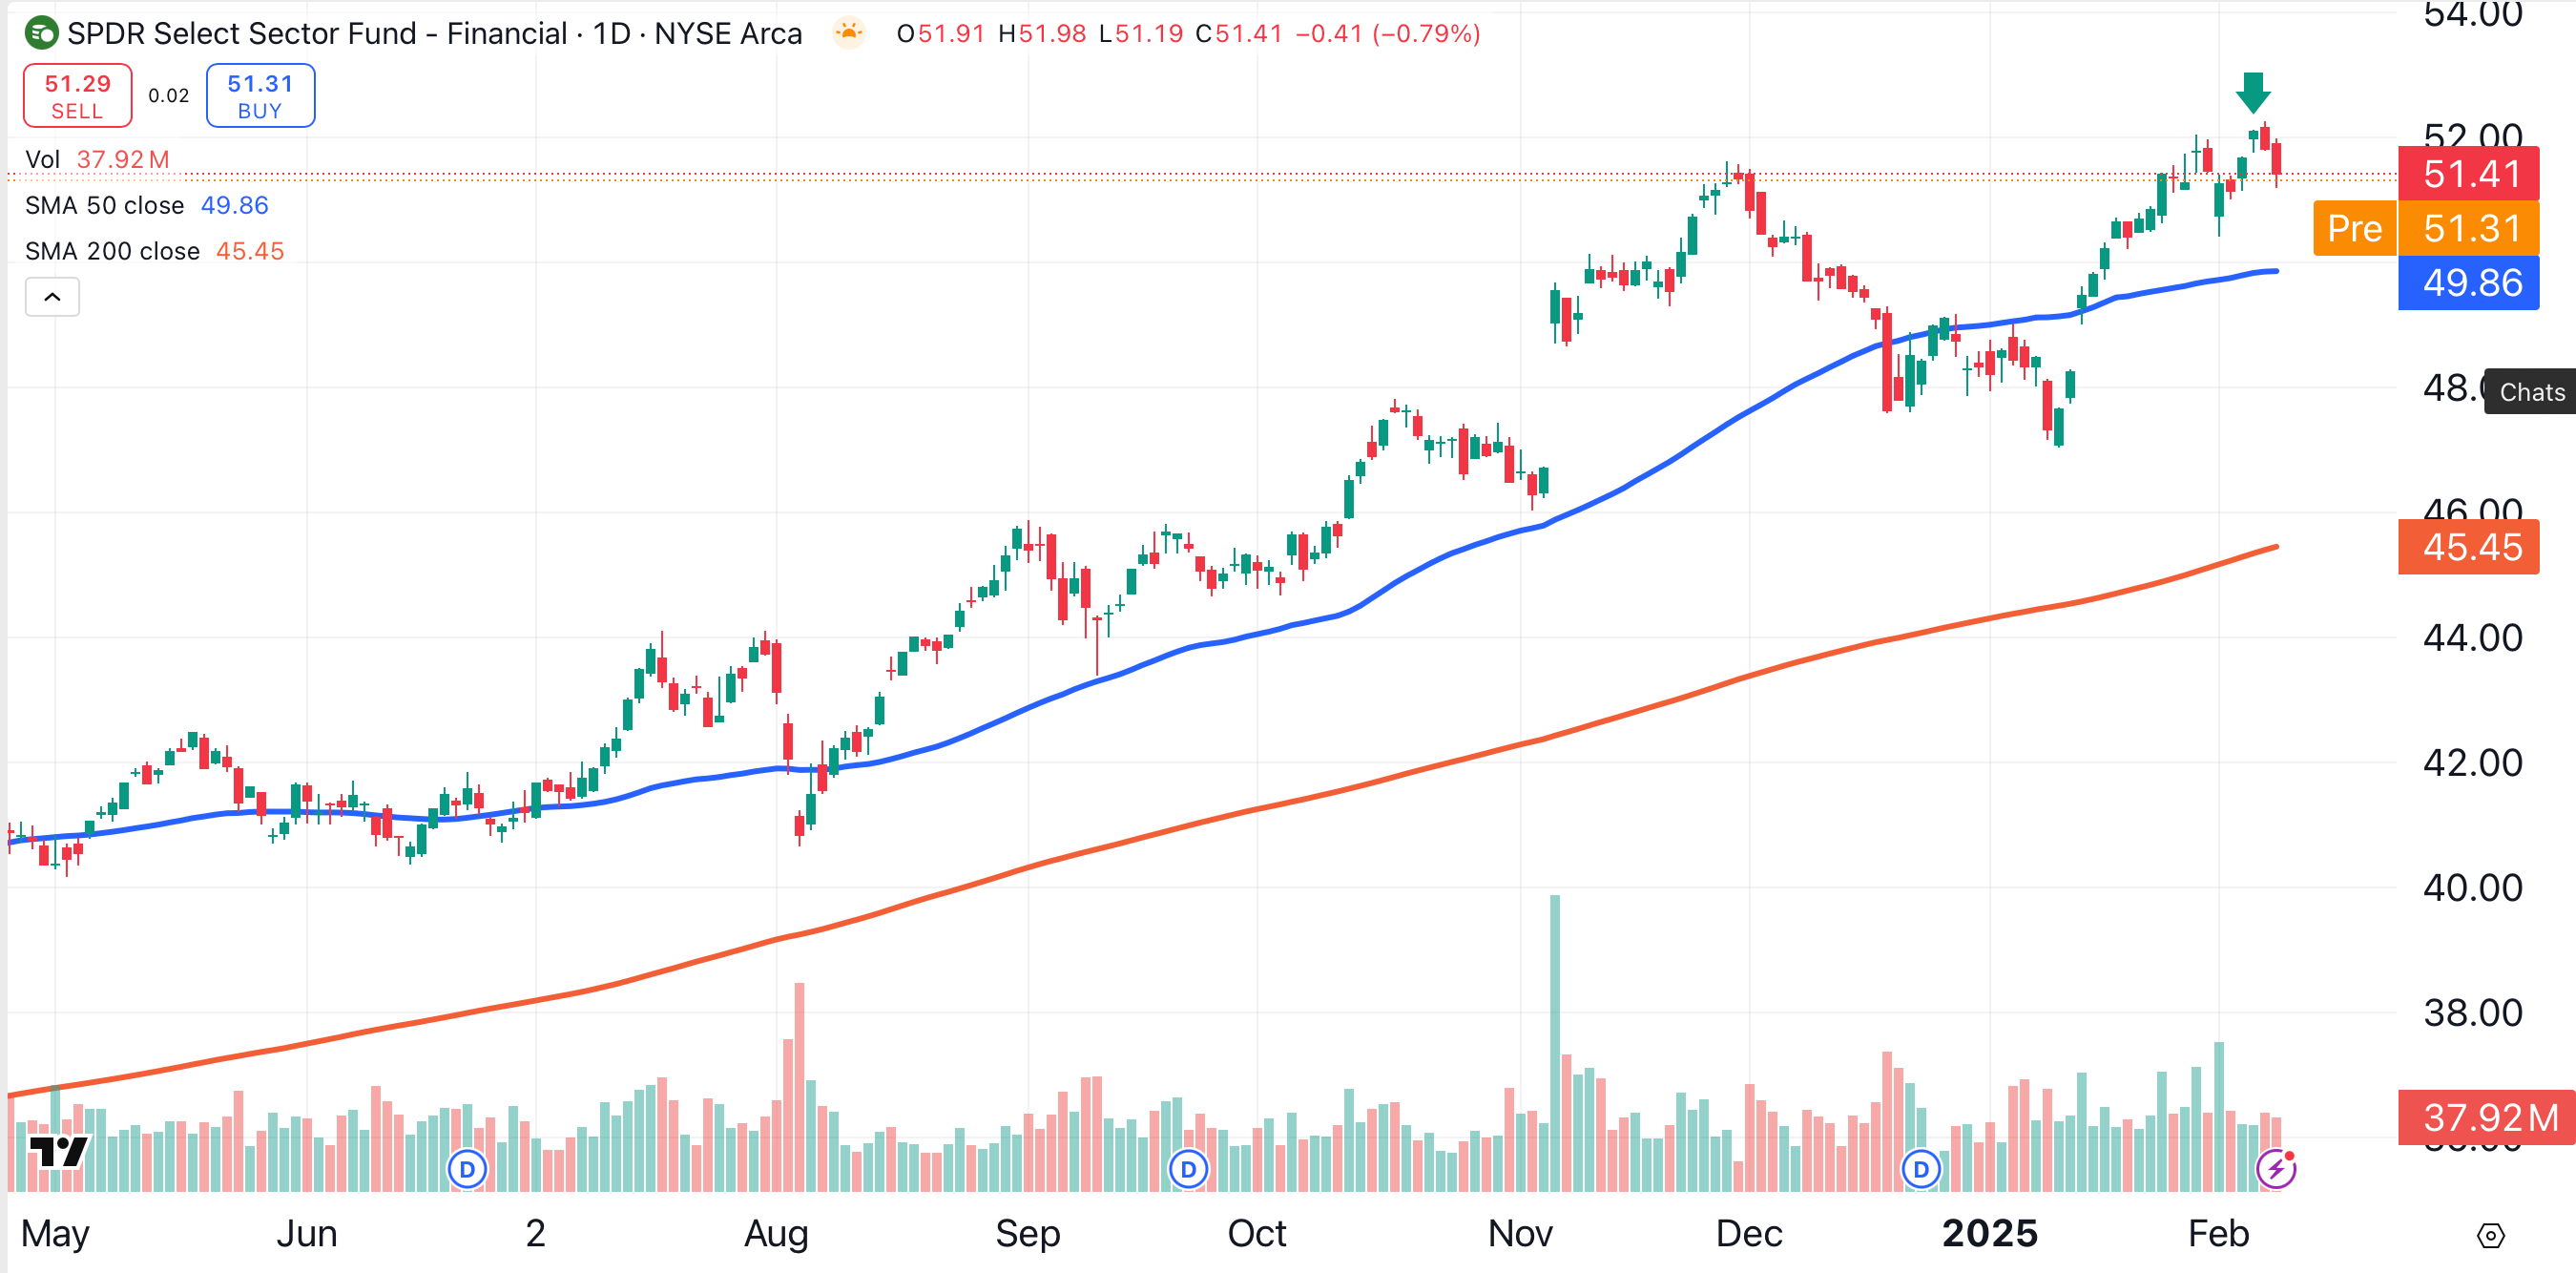
The financial sector, represented below by the Financial Select Sector SPDR Fund XLF, reached a fresh all-time high just last week (green arrow). The sector was bolstered by a series of strong earnings reports from financial institutions in January.
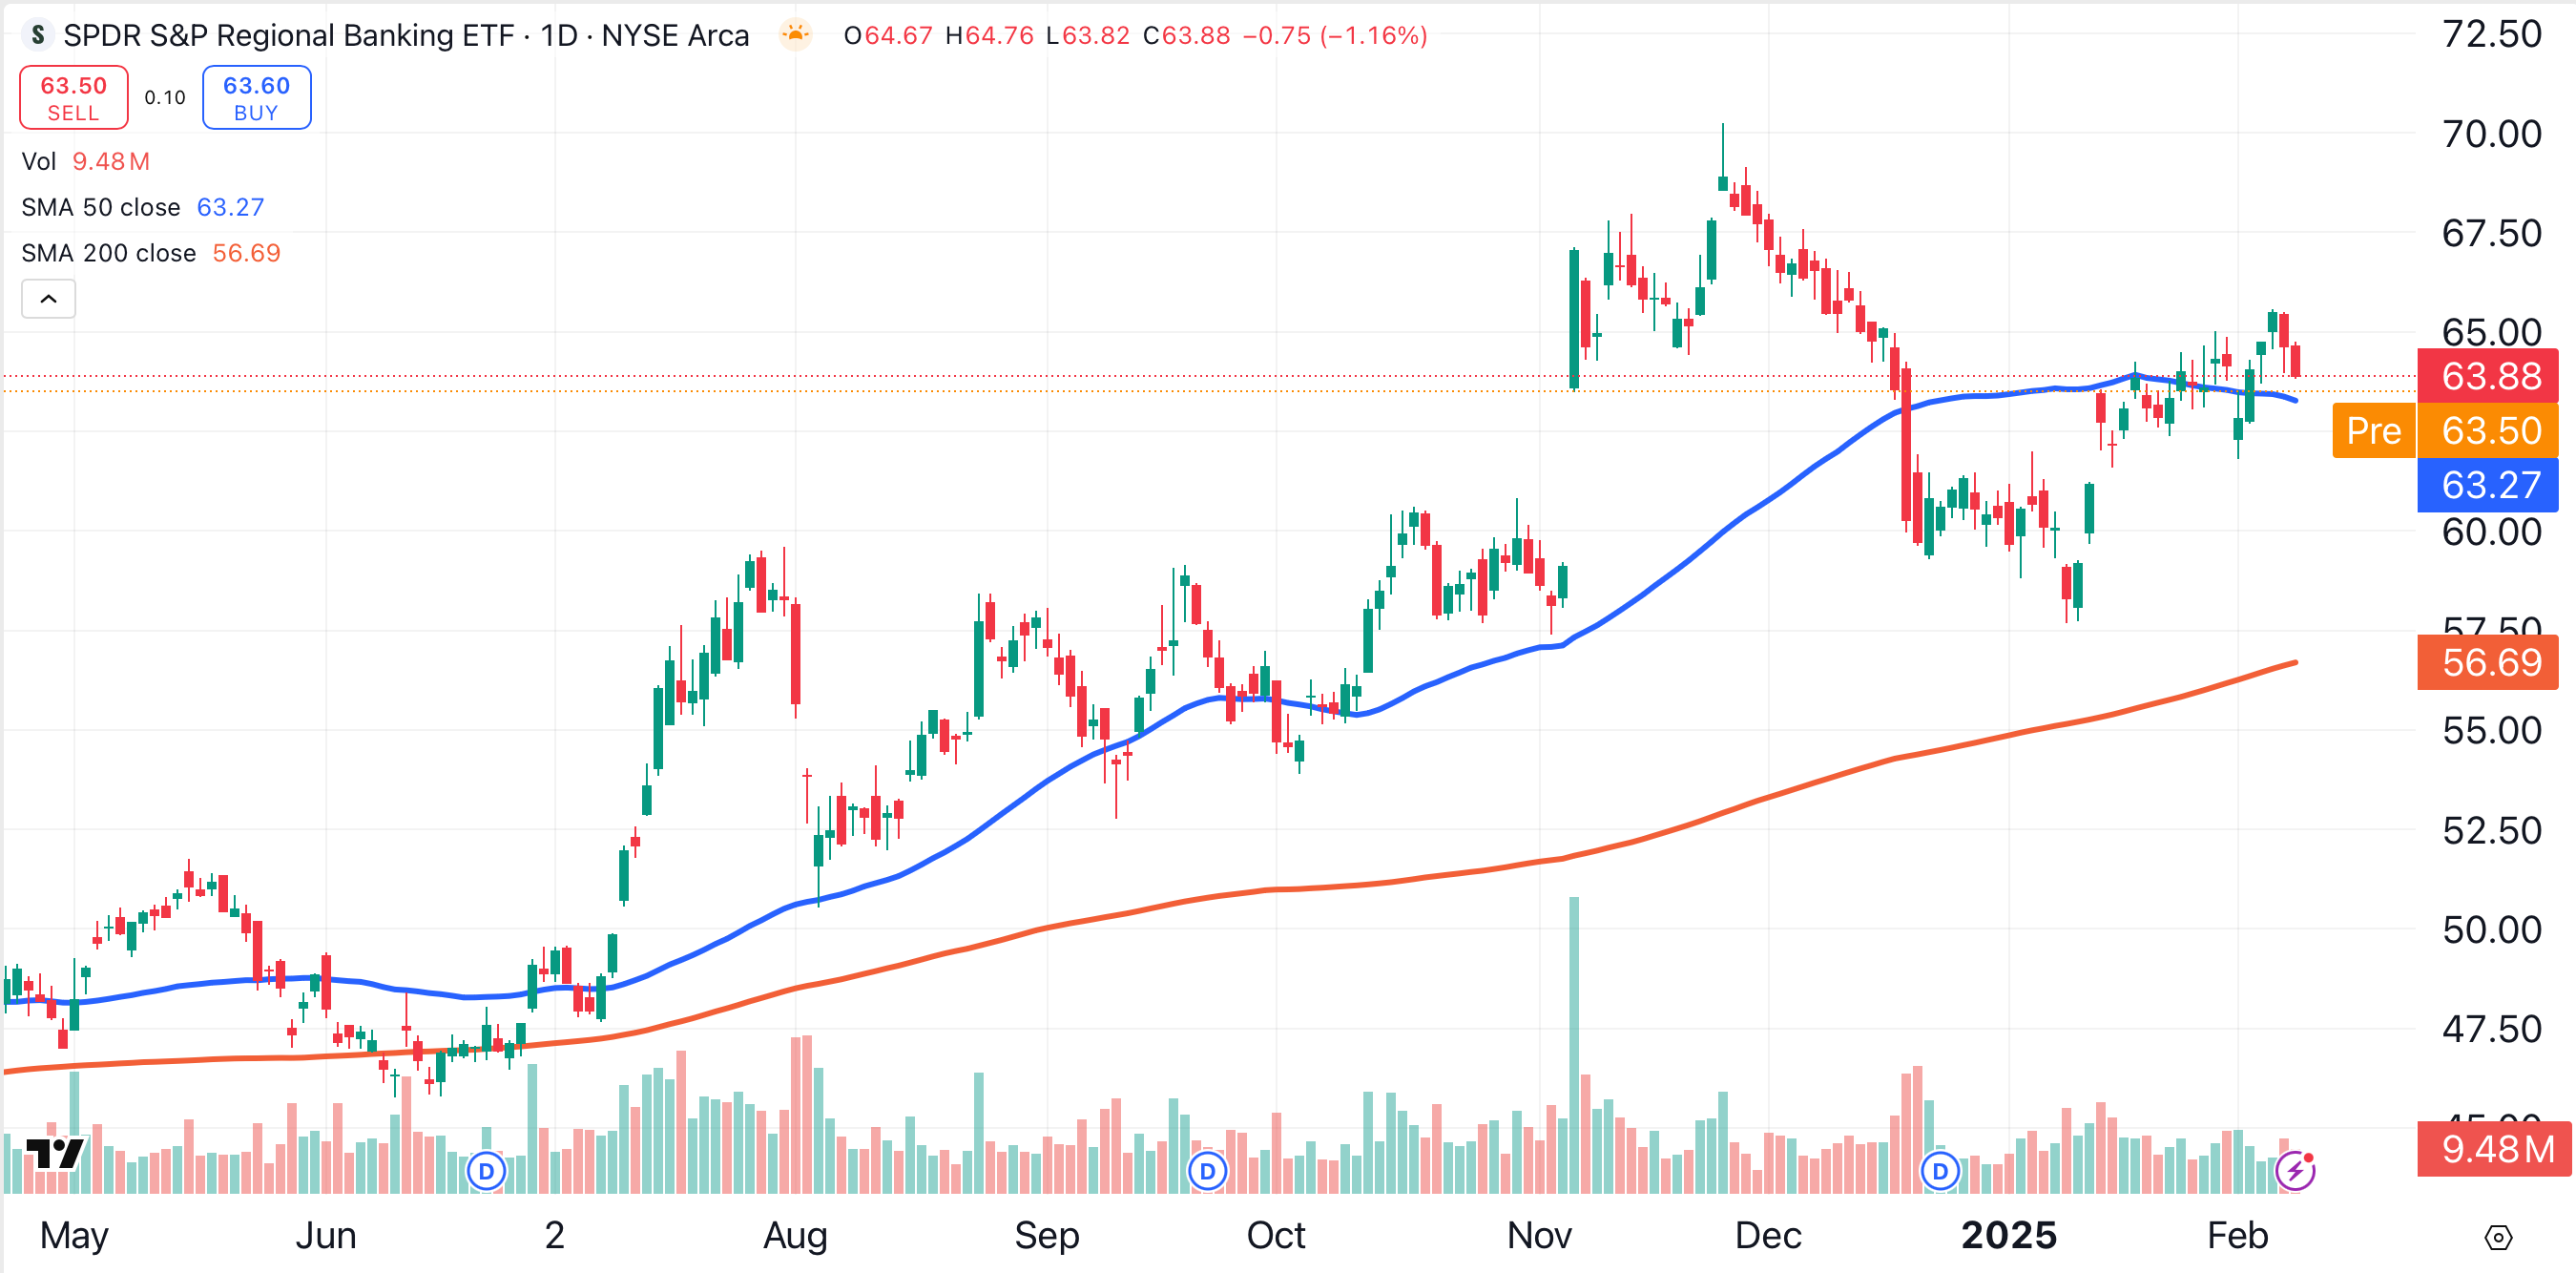
The positive action is mostly occurring in larger financial institutions. Smaller regional banks have seen less bullish participation, as indicated by the performance of the S&P Regional Banking ETF KRE.
Zooming in further, the sweet spot in the financial sector appears to be in the credit space.
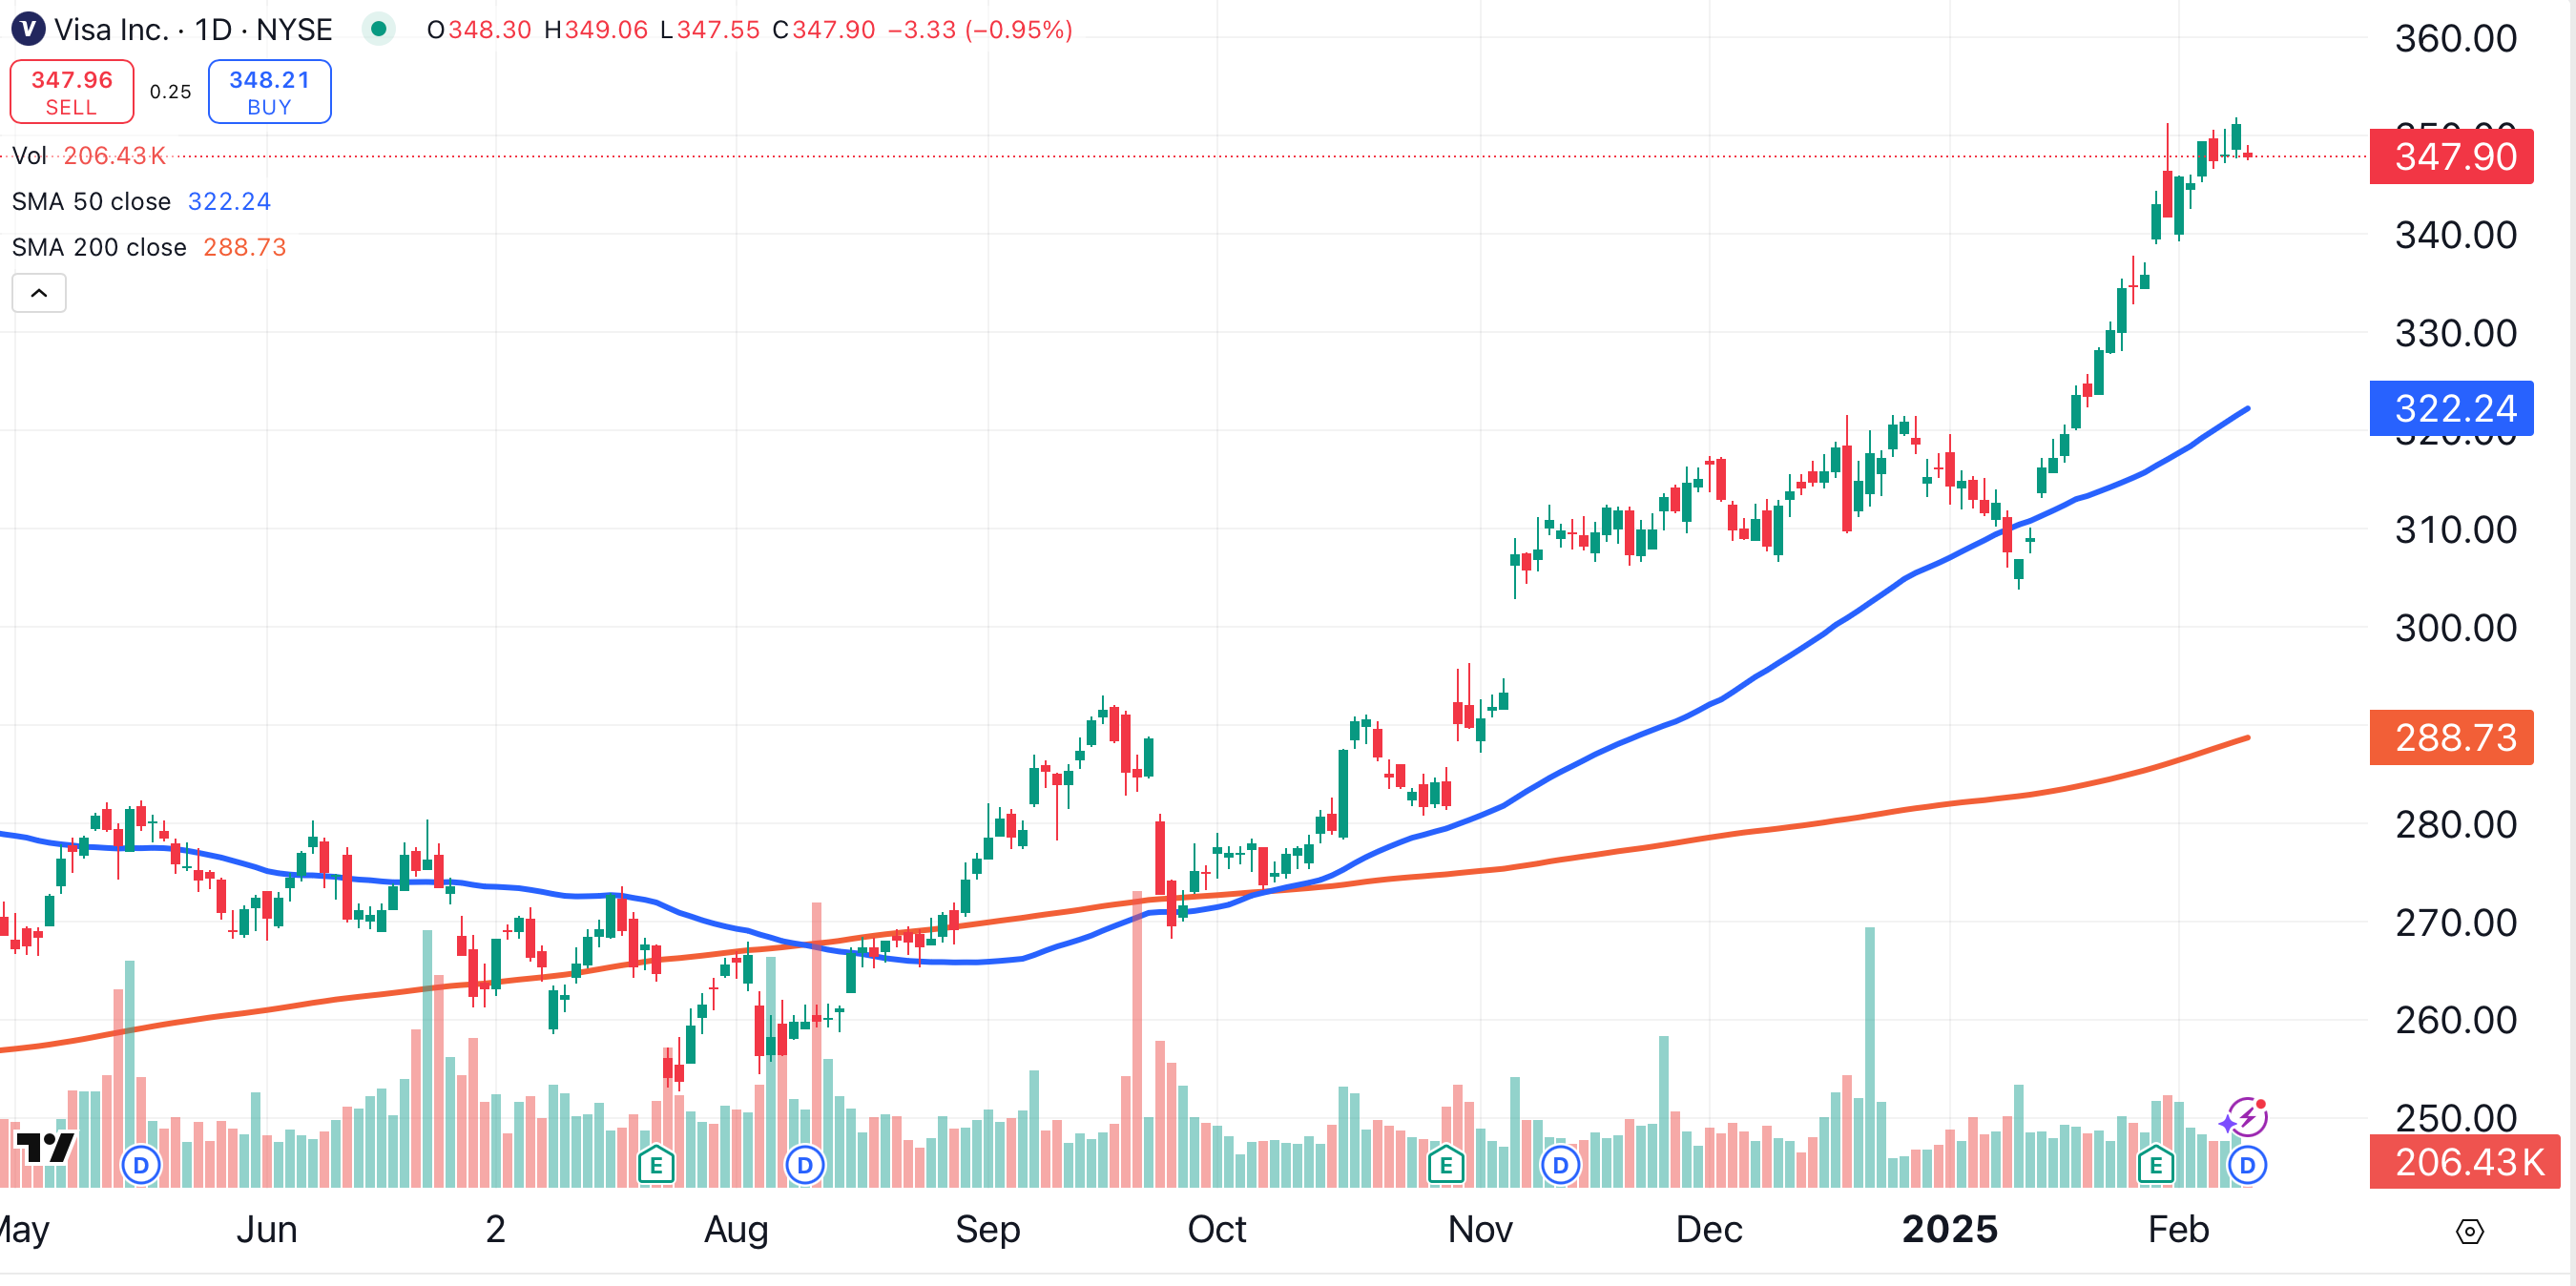
Looking at the major components of the XLF ETF, one of the strongest stocks is Visa V. The San Francisco-based credit provider closed at an all-time high on Monday, after handily beating estimates for earnings and revenue in its most recent quarterly report.
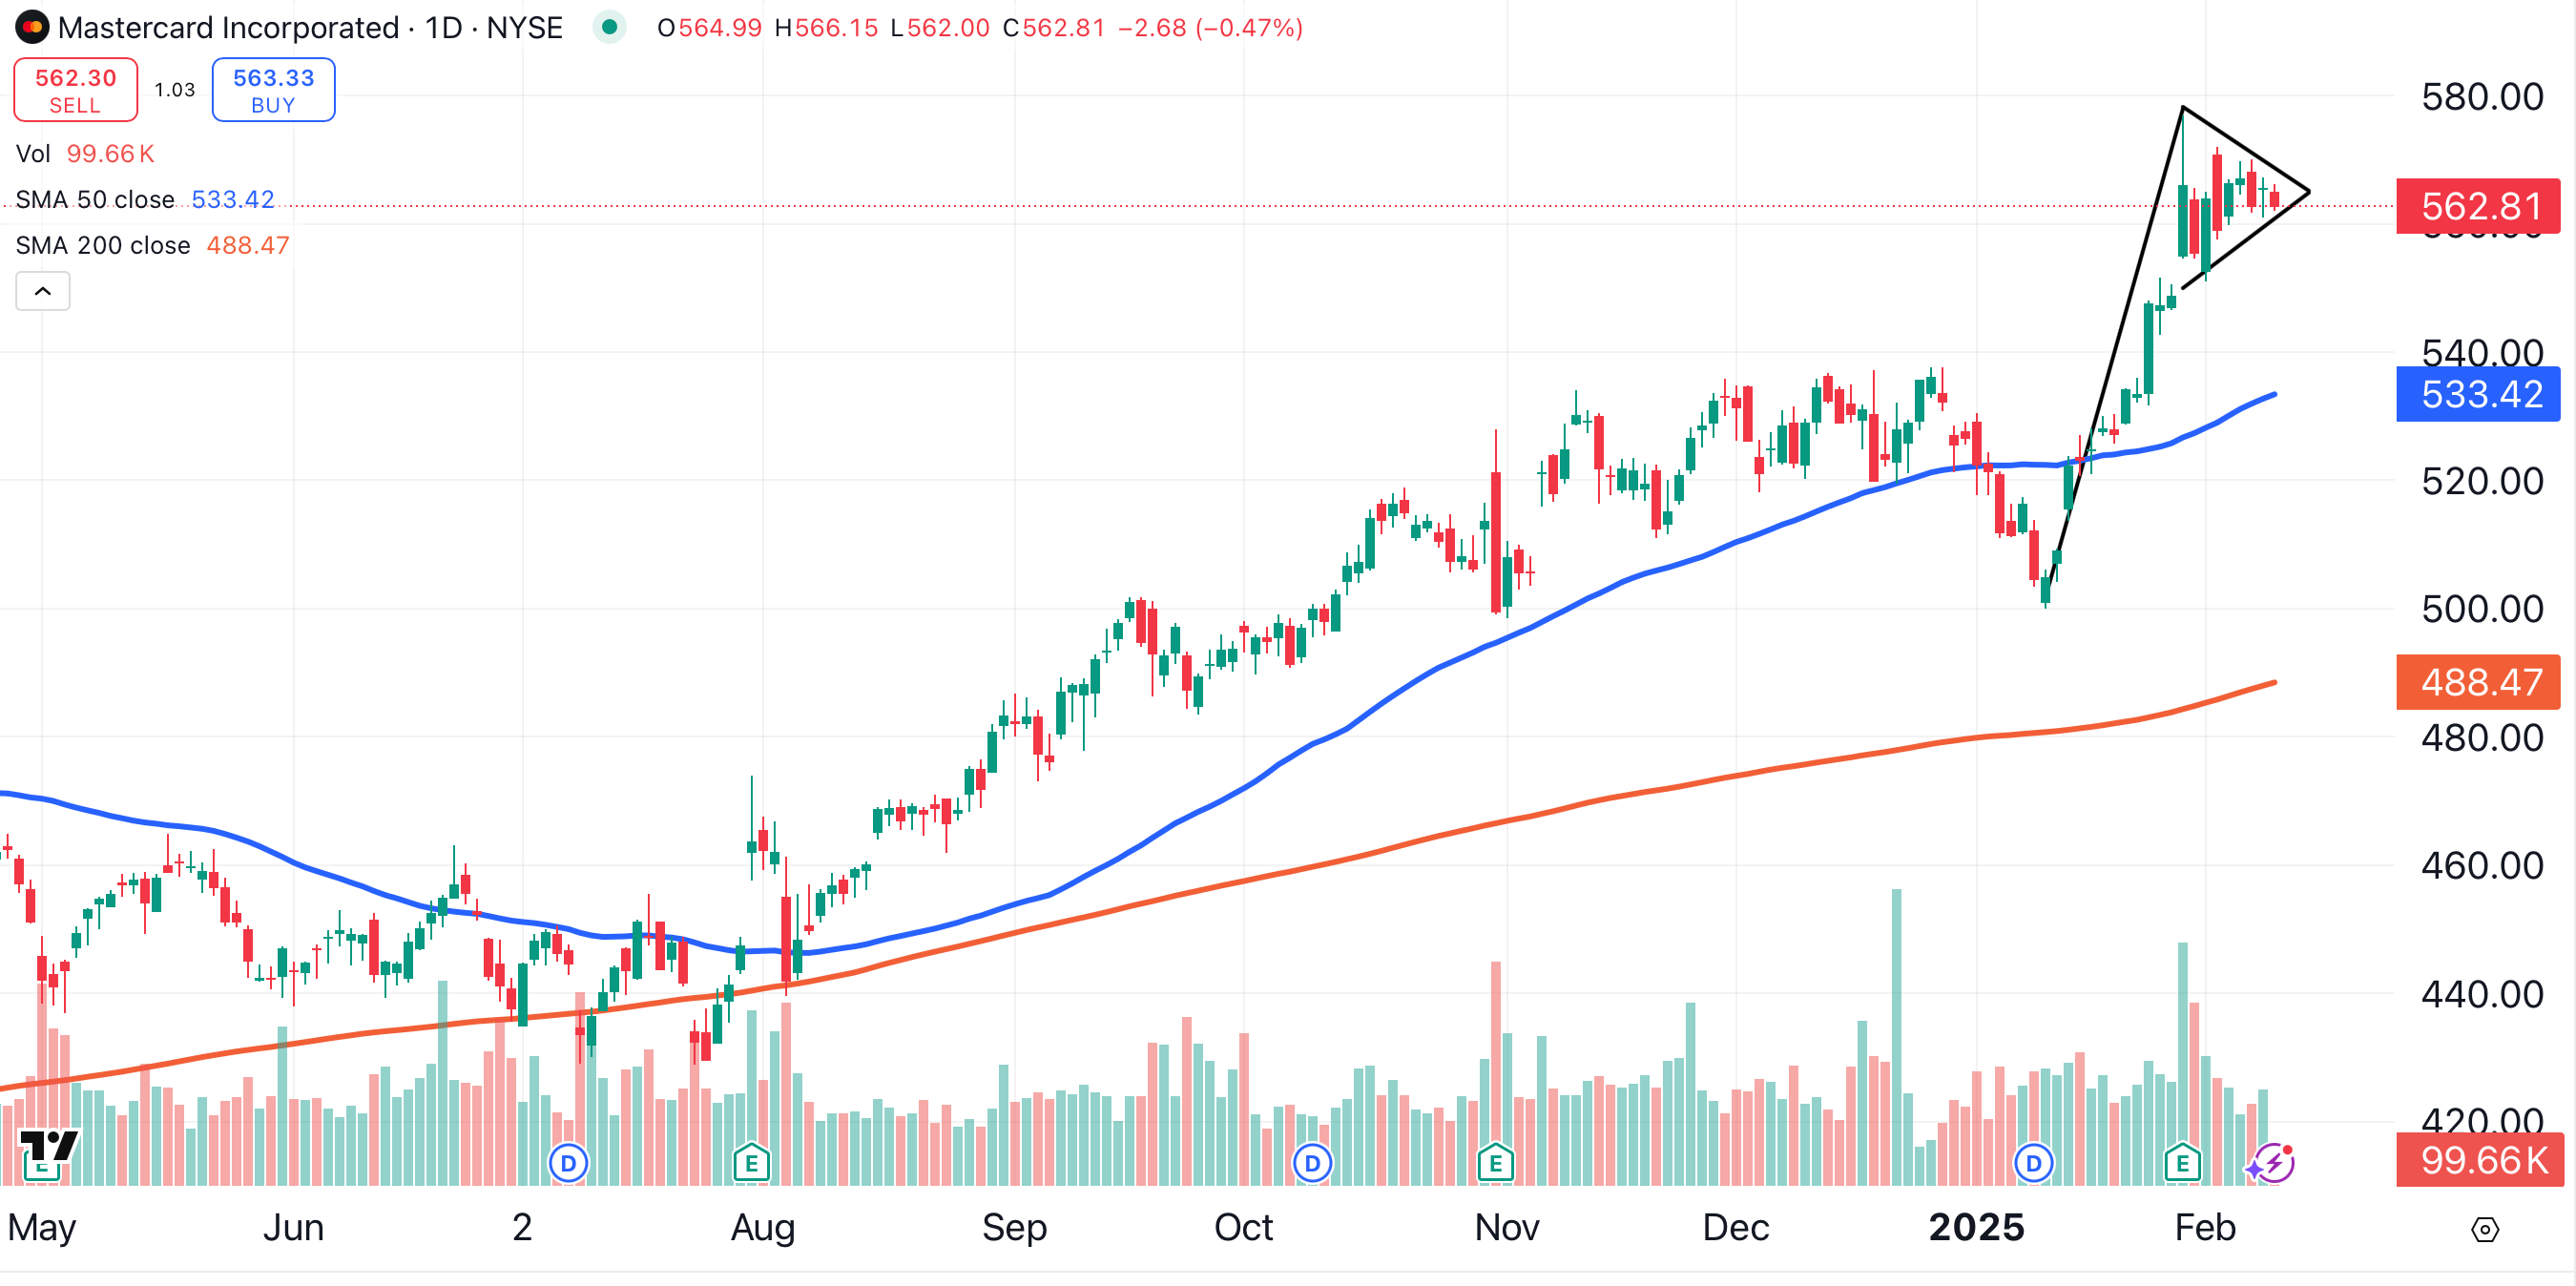
Mastercard MA also has an impressive chart. The credit provider has formed a bullish consolidation pattern known as a pennant (black lines). This pattern suggests that Mastercard could be headed to the $650 area.
Of the Big Three credit card providers, American Express AXP has the least impressive chart. Despite this, the New York-based icon is trending higher.
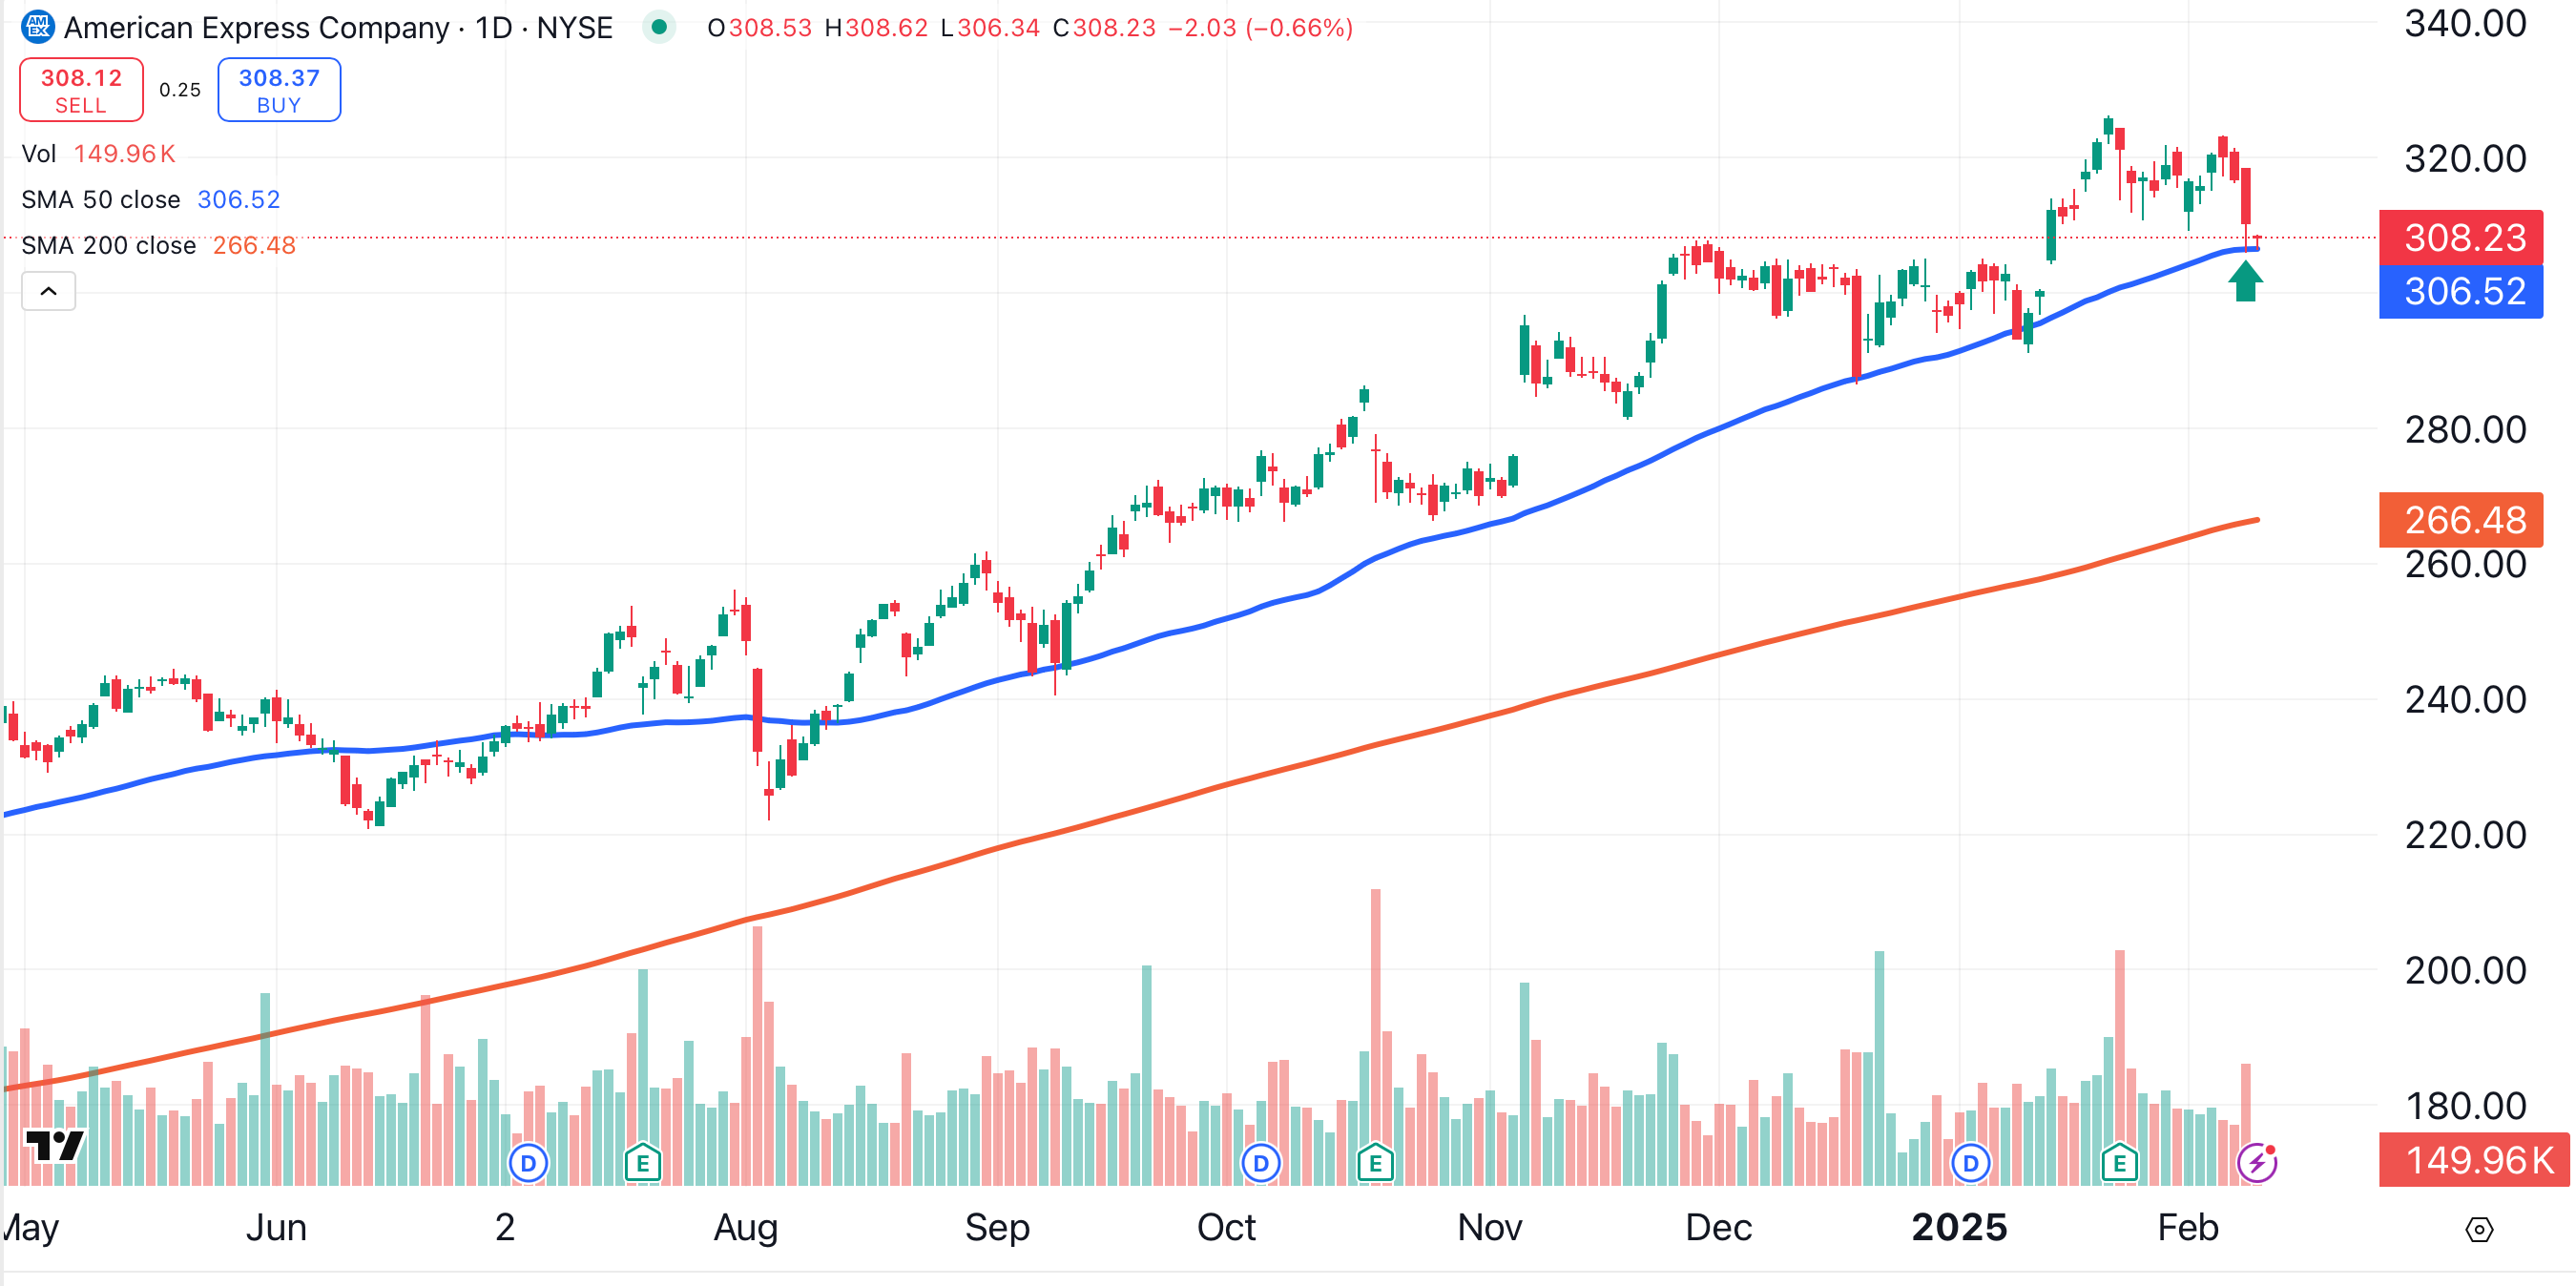
Amex barely squeaked by analysts’ estimates for earnings and revenue in its most recent quarter. Traders should keep an eye on the stock’s 50-day moving average (blue), which is currently being tested (green arrow).
Overall, the performance of these companies taken as a whole could be considered a bullish sign for the economy.
While the January employment report missed the mark by about 25,000 jobs, this was more than offset by a 50,000 positive revision for December. Rates are likely to remain higher for longer. Fed Chairman Powell indicated on Tuesday morning that the Federal Open Market Committee is in no hurry to further reduce interest rates.
