'Giddy Up'? Not With This Beloved Group Still Lagging
The market’s 'giddy' debate is missing one key thing, while sentiment looks a lot different than last October. Plus, Oracle, Meta, First Solar and much more!
You've reached your free article limit
You've read 0 of 1 free Pro articles.
The Market
It’s time to go back to the topic of sentiment because my inbox is filled with "aren’t we giddy by now?" We are and we aren’t.
I think folks got giddy when it comes to silver and some of the other metals a few weeks ago. And maybe a little giddy when it comes to the 493. And the non-stop chatter about how great financials are in the last few weeks is bordering on giddy (see my comments from early last week that I think this is where the banks stall out), but I do not think folks are giddy on the mega-cap tech stocks.
Who can’t see that the Nasdaq hasn’t made a new high? Who can’t see that the QQQs have been lagging? Oh I know everyone (including me!) welcomes the 493 rally but if you are asking about giddiness, that’s where it lies: in the banks, metals and the 493.
Thursday evening we looked at a lot of tech charts (and many more down below) and we know just from a glance that these charts are laggards and possible tops. Folks can get giddy about certain groups, but the overall market? With Beloved Tech lagging, it's not giddy.
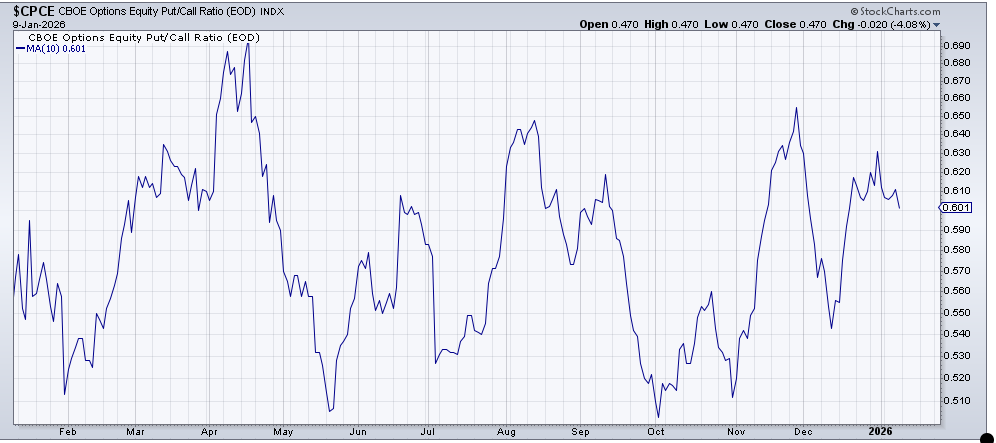
Think back to late October. That was giddy. The DSI for the S&P 500 and Nasdaq were pushing toward 90, although not over it. The DSI for the VIX was so close to single digits. The 10-day moving average of the equity put/call ratio got down to under 0.51 in early October and by late October it was back to that 0.51 area again.
Now, despite two straight days of readings for the equity put/call ratio below 0.50 (that’s the 493 giddiness I see) the 10-day moving average of this metric is at 0.60. I suspect by the end of this week we could see this back under 0.55, but up here it does not show giddiness.
It’s true that all the sentiment indicators I follow are very elevated, showing an awful lot of complacency overall. The DSI for the S&P is at 71 and the Nasdaq is at 73, which are pretty neutral. The DSI for the VIX is 16, which is why I keep thinking we are due for another bout of volatility.
I keep wondering what if the mega-cap tech stocks have a little fling to the upside? My guess is that would get folks into giddy from complacent.
New Ideas
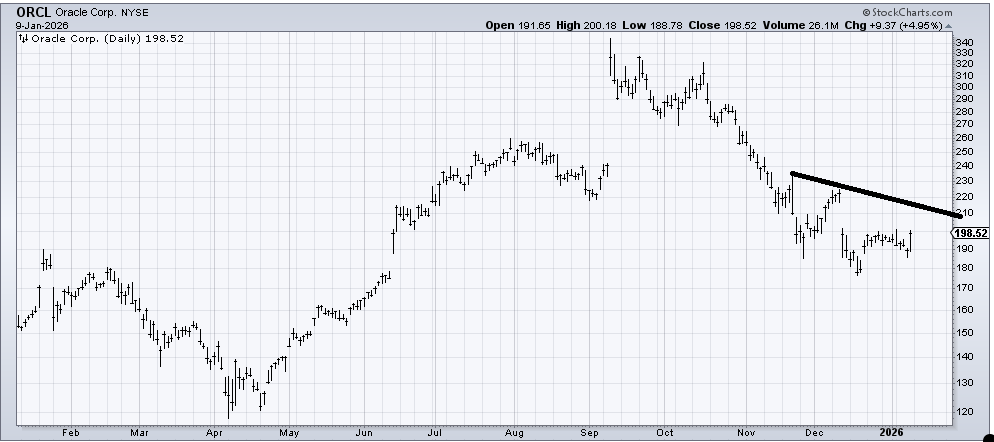
As per the discussion above, what if, on a short-term basis, a stock like Oracle (ORCL) , which has been left for dead because it is down 40% from the high and no one really wants to own it anymore, has a rally to fill that gap into the $210-220 area?
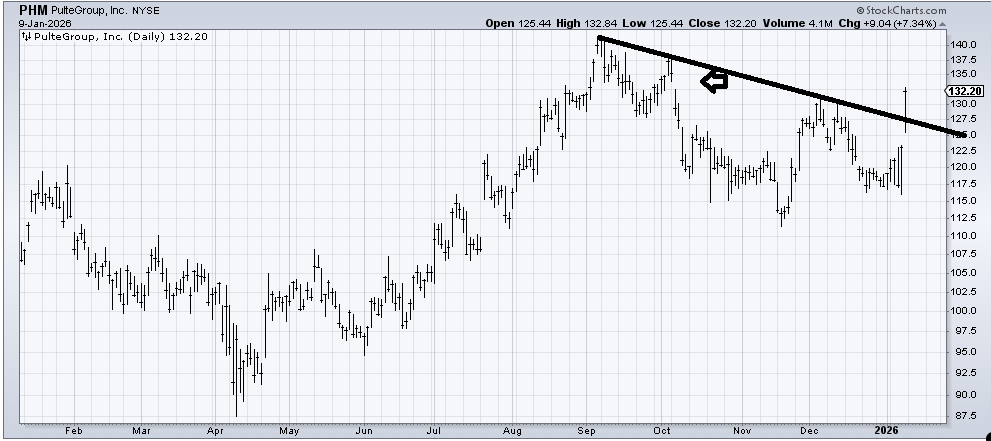
We got quite lucky last week with the move in PulteGroup (PHM) . While I like that it cleared resistance at $130 so readily and crossed the downtrend line, there is a short-term gap fill just overhead (arrow) around $134 that if you were trading it would be a good place to take a little off the table. I don’t have a longer-term target yet but am inclined to start with $140-145.
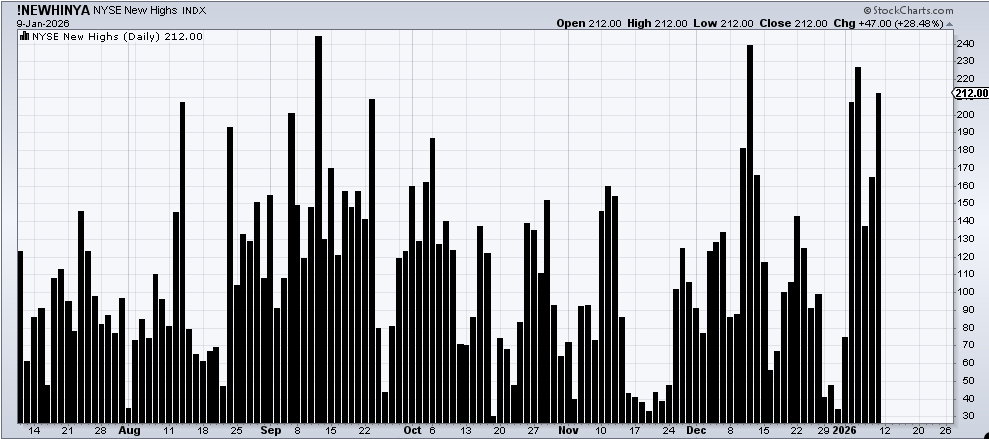
Today’s Indicator
The number of stocks making new highs is still meandering at best.
Q&A/Reader’s Feedback
Helene welcomes your questions about Top Stocks and her charting strategy and techniques. Please send an email directly to Helene with your questions. However, please remember that TheStreet.com Top Stocks is not intended to provide personalized investment advice. Email Helene here.
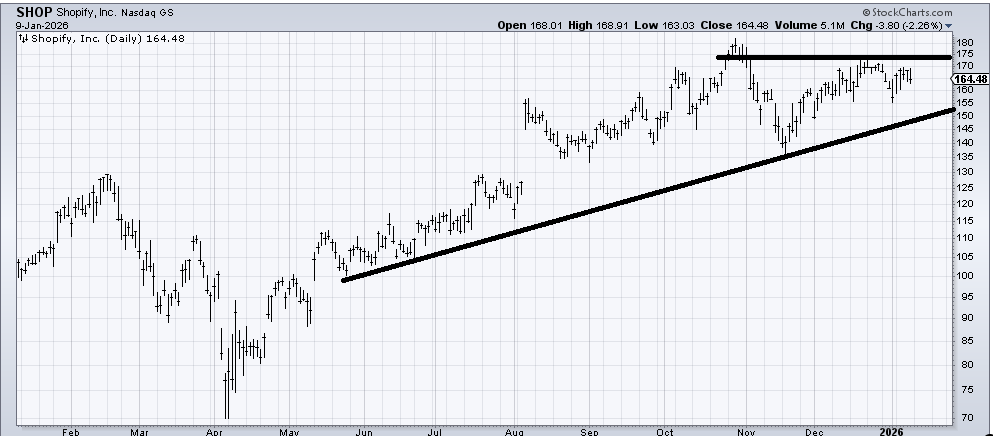
When we looked at Shopify (SHOP) a few weeks ago, I said I thought it was trapped between (roughly) these two lines and I still think that is the case. I would consider myself wrong if it can gap up over $175, but I think it's more likely the stock tags that lower line in the coming weeks.
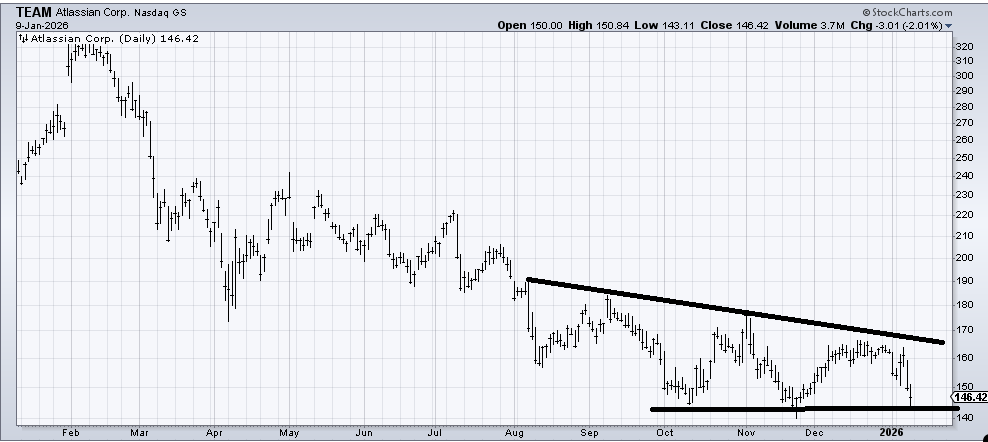
I’m not sure I trust Atlassian (TEAM) to hold here. The stock hasn’t made a higher high since February, which is the definition of a downtrend. If it breaks this $140 area it will look like a new leg down, so if you want to bottom fish that’s the stop I would use.
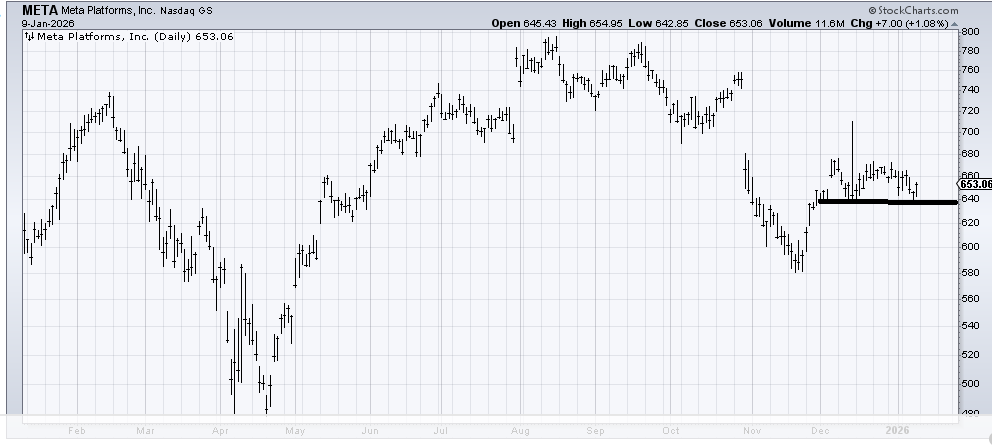
I have been thinking Meta (META) would rally back to that $680 area, and so far that has been the wrong call. Yet as long as it doesn’t break $640 I am inclined to stick with that view.
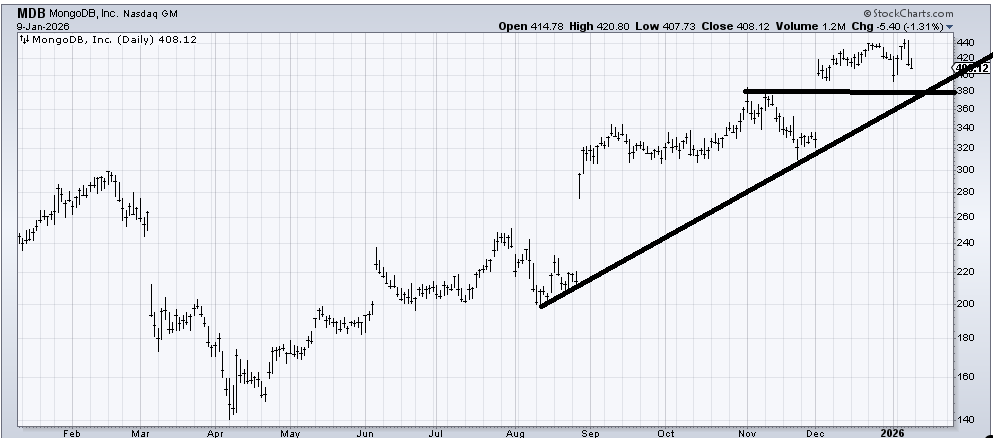
MongoDB (MDB) looks to me as if it is inclined to fill that minor gap near $380. If it gaps under there then it would leave these last six weeks of trading as an island overhead, which would be quite bearish.
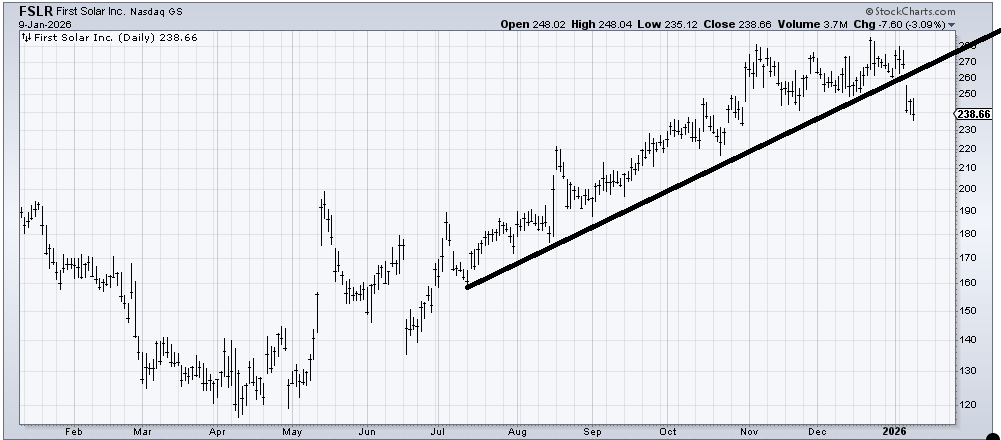
First Solar (FSLR) looks broken to me. Oh sure it’s getting oversold in the short term but I am a seller into rallies, especially if it can manage a rally into the $260-270 area.
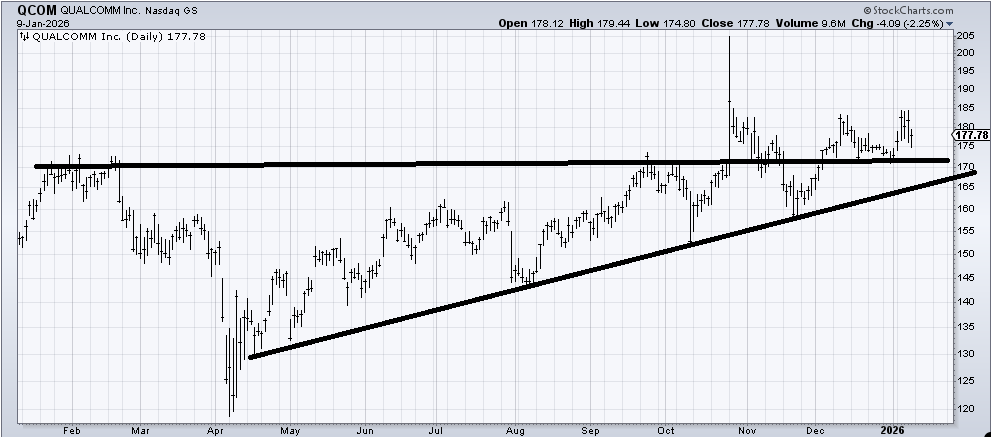
Qualcomm (QCOM) has this big base that it broke out of in October and with the exception of that dip under the breakout in November it has mostly been able to maintain it. I am inclined to think as long as the stock holds this $165-170 area this is just part of the sideways digestion. I just hope that spike to $205 wasn’t "it."
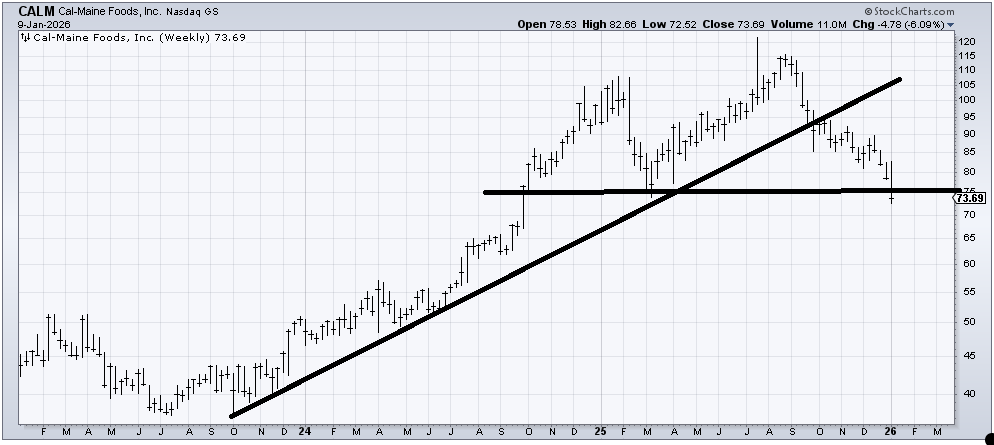
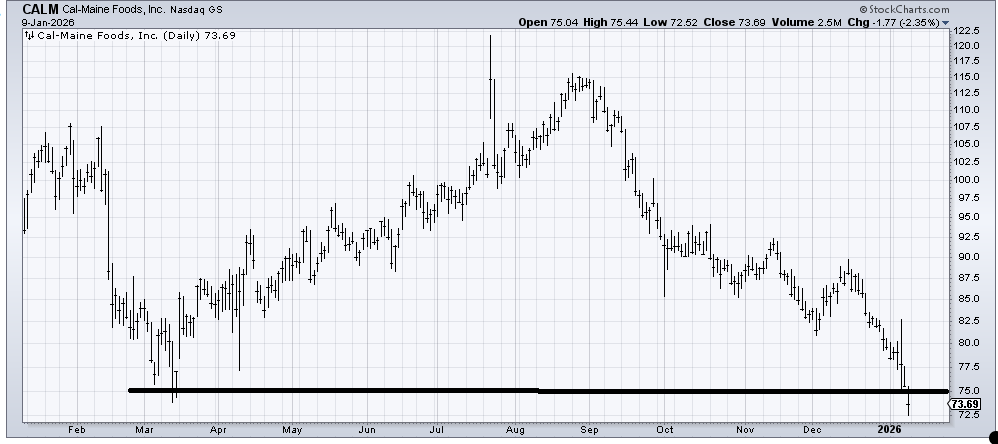
I am not interested in bottom fishing Cal-Maine Foods (CALM) even though it is getting oversold down here. The weekly chart shows the break of a long-term uptrend line back in the fall of last year and while there is some light support in this $70-75 area (flat line) I would say unless or until this builds a base of some sort I would stay away. What would get me to change my mind is a gap up over $75 that holds because then this would look like a false breakdown.
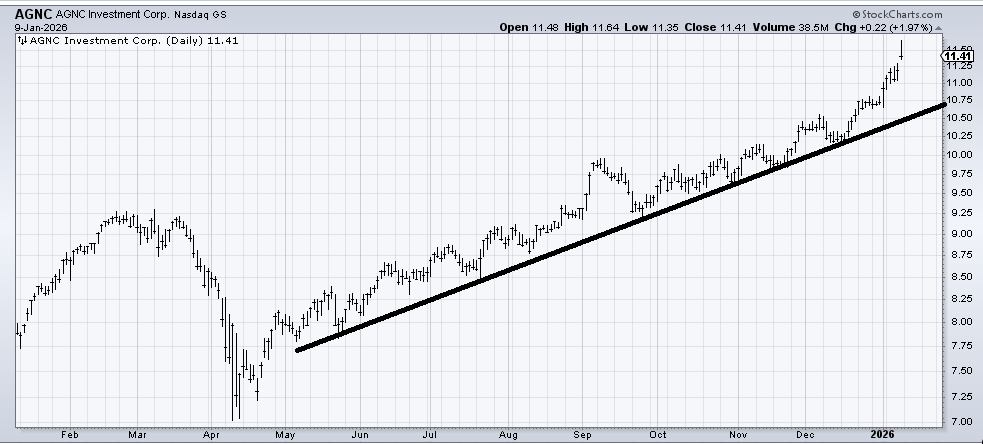
AGNC Investment (AGNC) hasn’t done anything wrong yet but I am a terrible chaser, not to mention it is at/near a measured target ($11.25-11.50). What would turn the chart bearish is a gap down under $11.25 that cannot refill because that would leave Friday’s action as an island. If the stock pulls back to the uptrend line I might have another look at it.
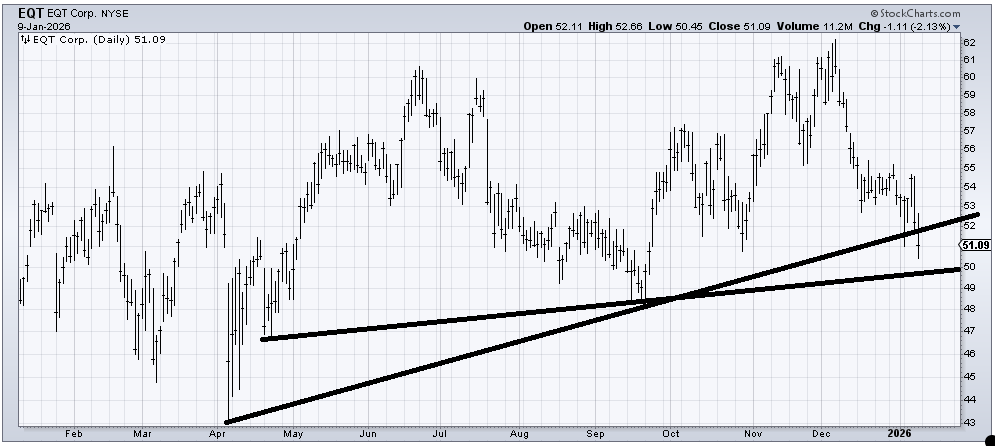
Every few months I get asked about EQT Corp. (EQT) and I think my answer is so very neutral, and now I see the stock is exactly where it was a year ago! I suspect that $48-50 area sees another bounce. But if $48 gives way you can see on the weekly chart there is support all the way to the low $40s, but it will leave a broken uptrend line in its wake.
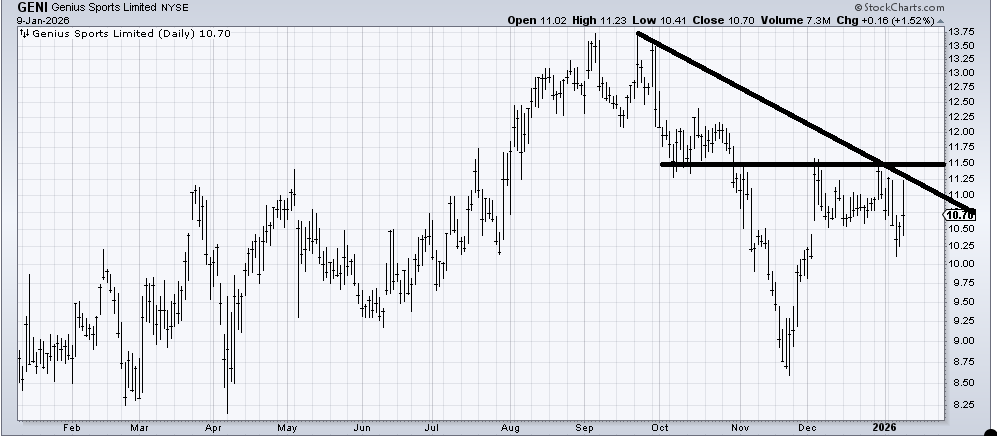
Genius Sports (GENI) filled the gap from early December but that seems like the best I can say about it. I’d love to say a move over $11.50 is a breakout, but there are layers of resistance overhead. Let me just say that a push above $11.50 would at least take it out of the danger zone. I think it tries to get over it.
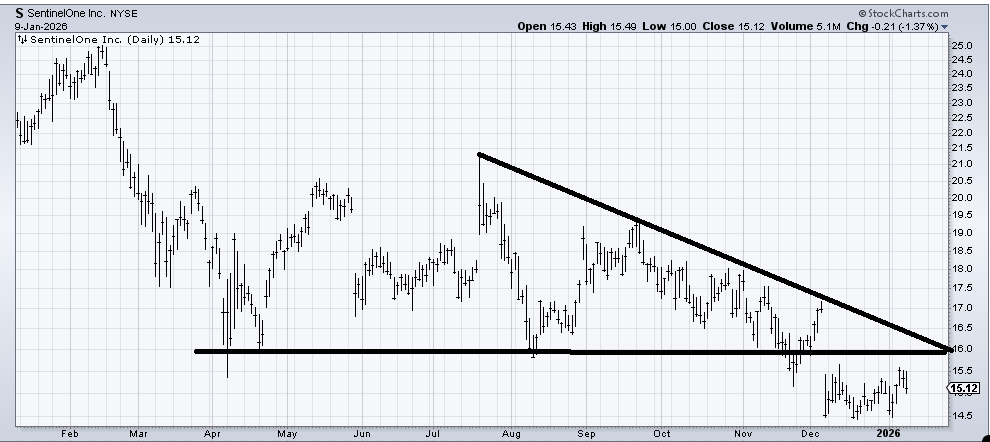
Long-time readers know that I have a tendency to look at charts that are down and out and try and see something good in them (and vice versa!). I find myself staring at the chart of SentenelOne (S) and thinking, "imagine if it can gap up over $16 and leave this last month of trading down here as an island." If it can’t get back over $16 in a hurry then I think it’s going to $12. But often a breakdown with no follow through is worth watching.
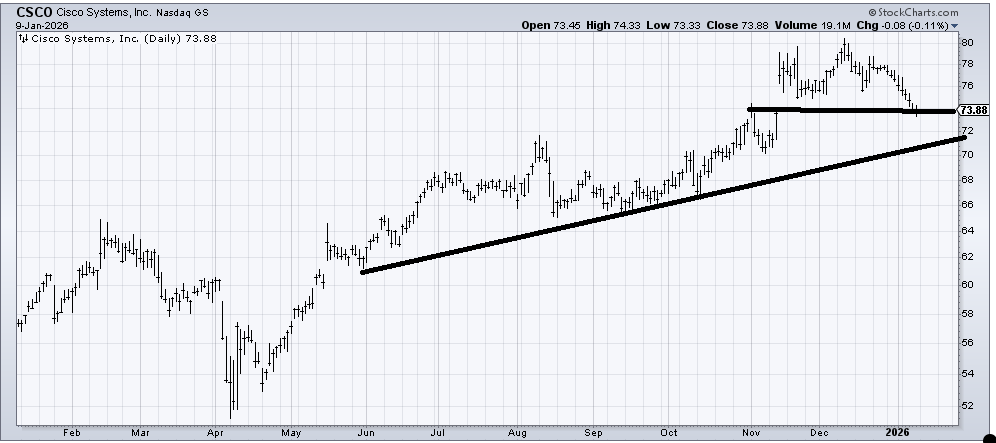
Cisco Systems (CSCO) looks terrible but it has been down eight or nine straight days and it has filled the gap so I’m inclined to look for a bounce in the near term . If it rallies and can’t get up and over $75-76 then I’d look for a move to the lower $70s in the next month or so.