Four Reasons Why We Could See a Pullback Soon
The oscillators and sentiment indicate that a pullback could be close.
You've reached your free article limit
You've read 0 of 1 free Pro articles.
The Market
In the last six weeks, the S&P has only been red on a Friday once, and it was by three points. I bring this up because my Overbought/Oversold Oscillator says we should get one more day of rallying, and then we will be short-term overbought.
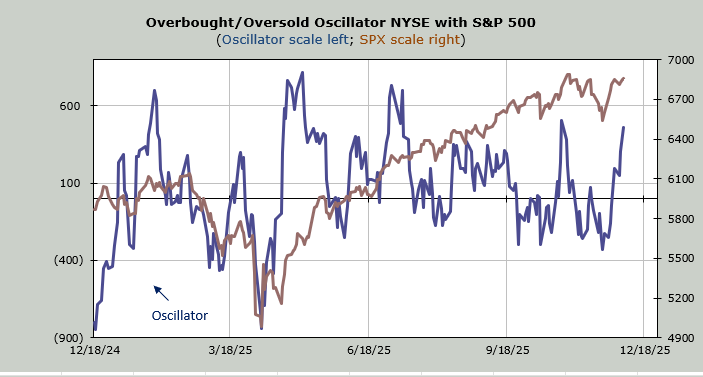
Naturally, the question will be, can’t we keep rallying even though we are overbought? First of all, the S&P has barely gone anywhere this week. It is up a whopping eight points on the week, so sure it’s possible we keep going since it hasn’t done much for the week. But my inclination is that we see a pullback.
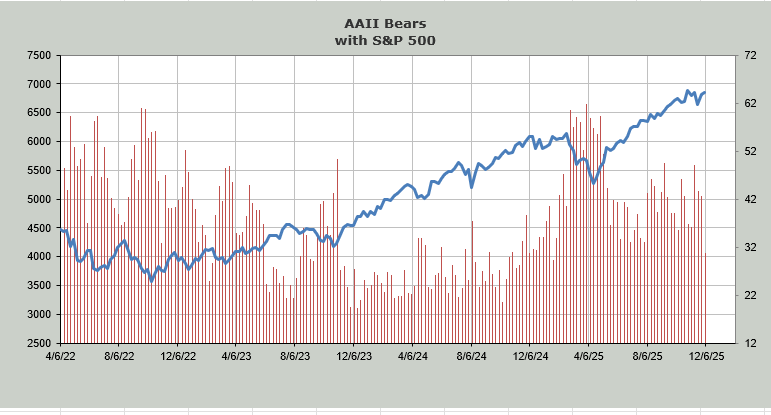
First of all, the day traders at AAII have gotten so bullish, I am a little bit surprised. I do wish Investors’ Intelligence had released their data this week, but it seems they took the week off, so we will be without confirming data from them until next week. Either way, the bulls jumped twelve points while the bears fell twelve points. That is a big change in sentiment.
More so, the bears are now the lowest (20%) since January. That is a change in sentiment that probably needs correcting.
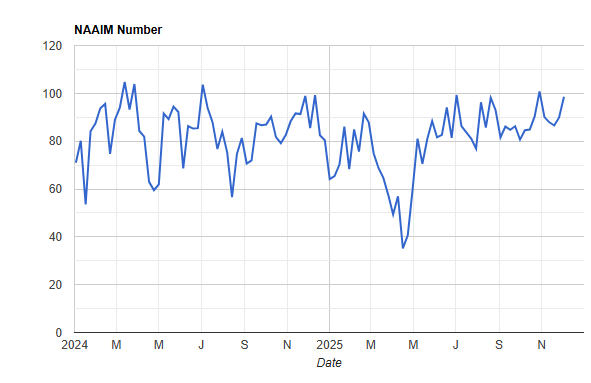
If we add to that the fact that the NAAIM folks increased their exposure to 98.5 this week (they were at 100.5 in late October), we can see a change in sentiment there as well.
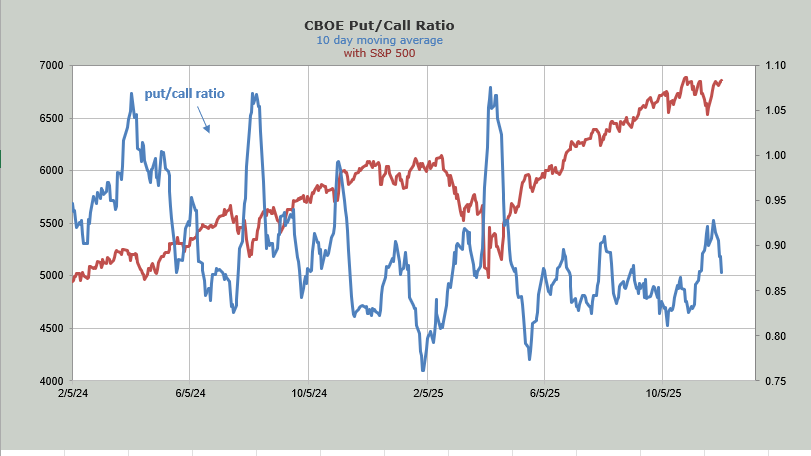
The ten-day moving average of the put/call ratio hasn’t sunk nearly as much as I thought it would, but there is always tomorrow! The chart is shown below.
Finally, the DSI for the VIX did not change; it remains at 15. So an up day tomorrow would take it down into the ‘yellow zone’.
A pullback next week would probably reset many of these indicators and get the market to back off the overbought reading. That’s what I think we’ll see.
New Ideas
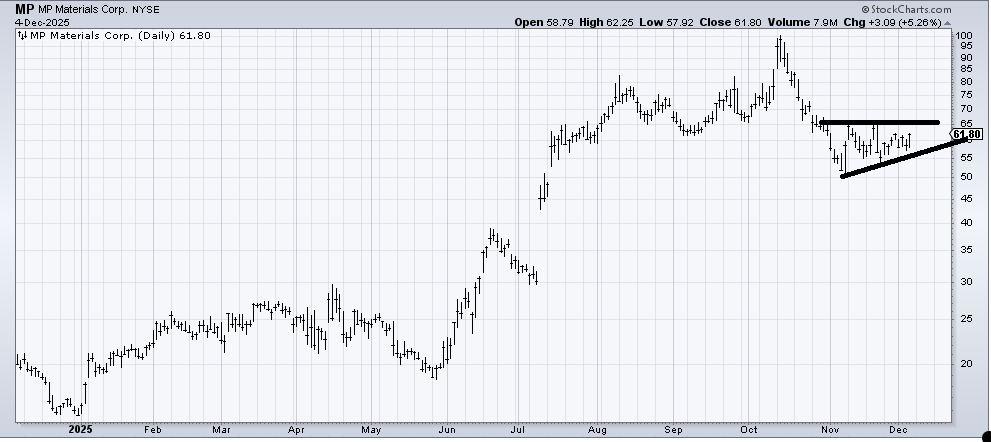
I was asked to follow up on MP Materials (MP) , which I recommended a few weeks ago, and while it’s up a bit from there, it’s mostly sideways. It did, in fact, pop to 65, which was my initial target, but it’s now spent the last month sideways, so I still think it ought to rally. I do not want to see it back under 55-ish, though.
Today’s Indicator
The ten-day moving average of the put/call ratio is discussed above.
Q&A/Reader’s Feedback
Helene welcomes your questions about Top Stocks and her charting strategy and techniques. Please send an email directly to Helene with your questions. However, please remember that TheStreet.com Top Stocks is not intended to provide personalized investment advice. Email Helene here.
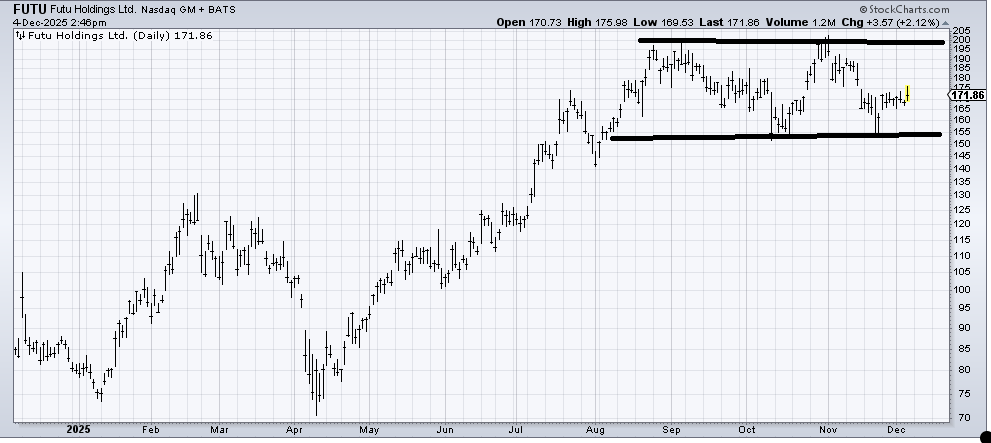
I would consider Futu (FUTU) a stock in a trading range for now. I’ll call it 150-200 because with it smack in the middle, I’m not sure which way it wants to go. If the chart cannot get up and over 180 in the next few weeks, I would get concerned that the next trip down it could break 150.
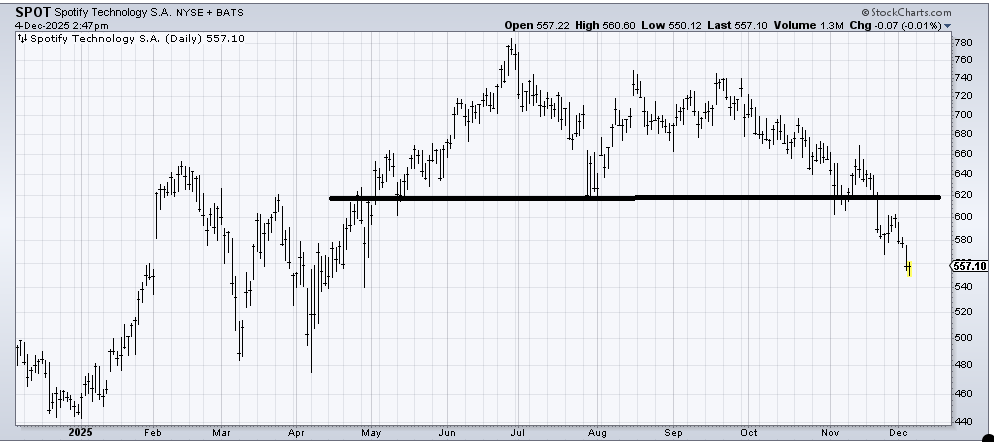
In the near term, Spotify (SPOT) is a little oversold, but if it rallies and can’t get over 580, I would say over the next few months the chart can make it down to 500-ish (measured target). So I’d watch what happens on a rally.
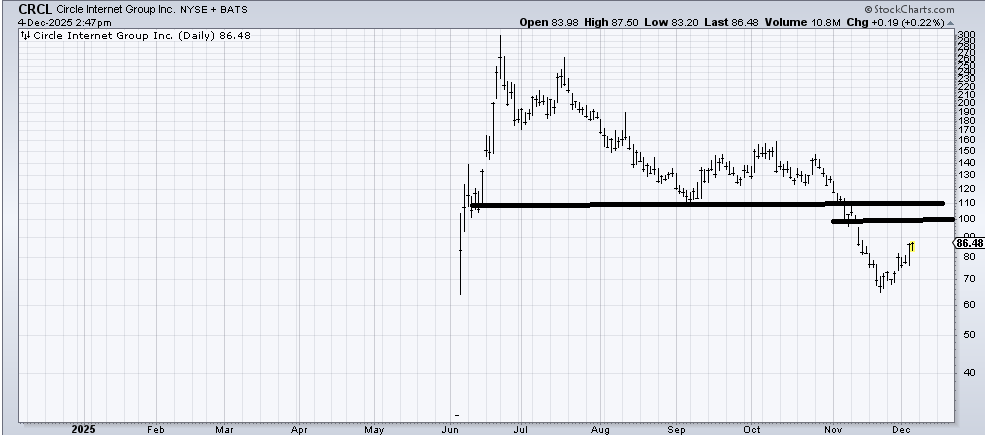
I can see Circle Internet (CRCL) rallying into that 100-110 area over the next few weeks. And then I’d look for it to come down again.
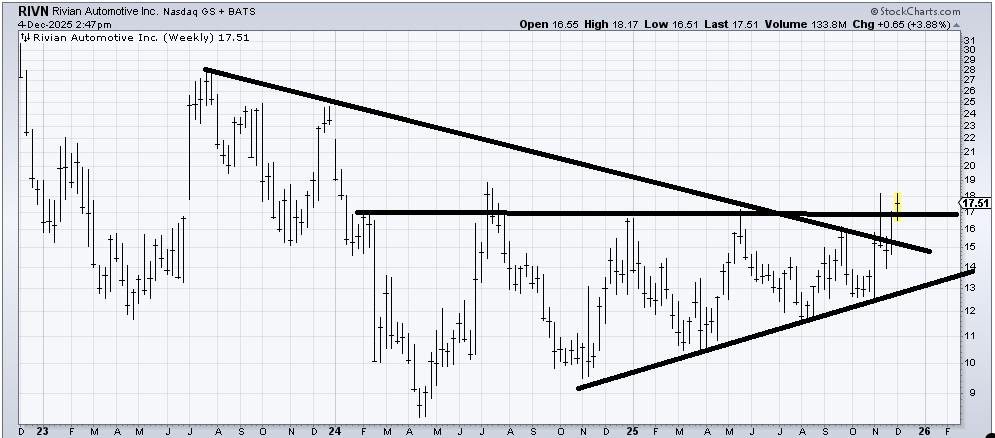
We looked at Rivian (RIVN) about a month ago, and I will repeat what I said then: this is a weekly chart with a big base. I don’t know when it will break out, but it ought to do so over time. A stop is far away, under 13.
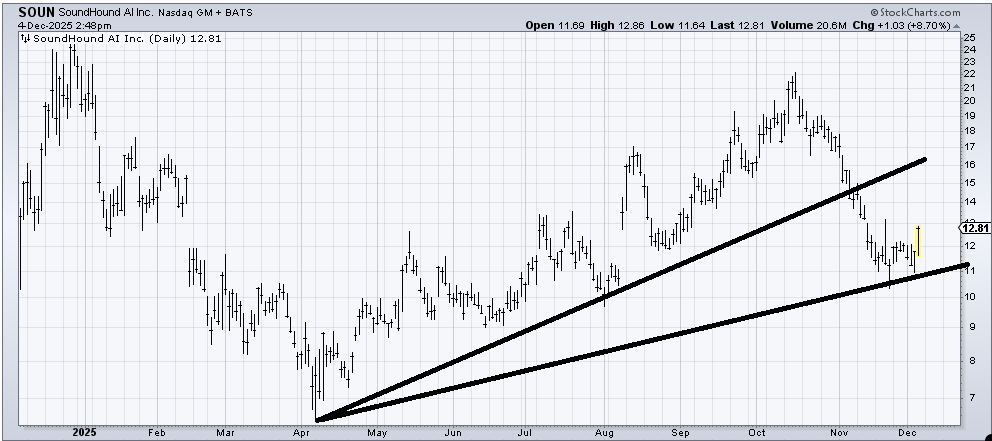
SoundHound (SOUN) has a good chance at rallying to 15 (not in a straight line). I will be wrong if it breaks 11-ish.
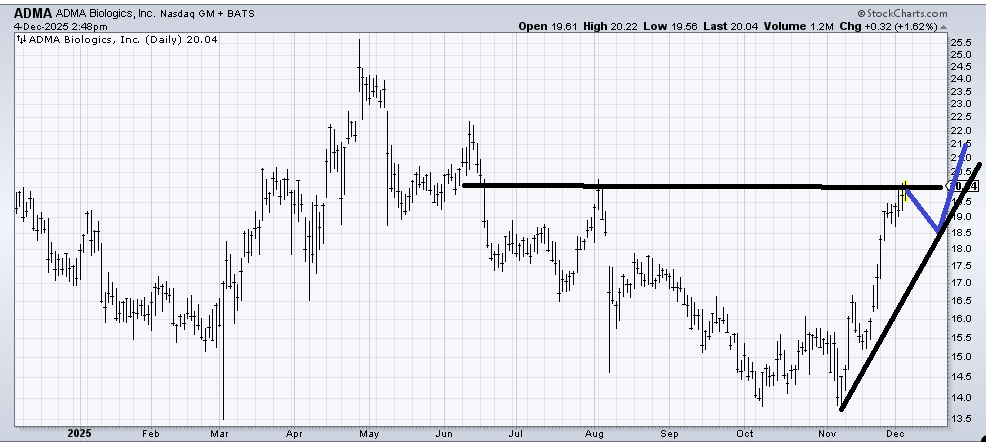
I would love to see ADMA Biologics (ADMA) pullback (the pattern is more important than the price) following something like I drew in blue.
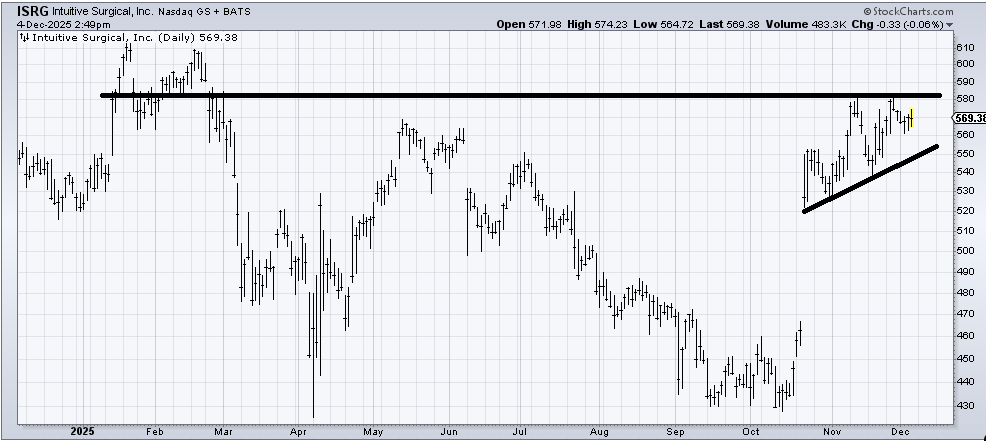
I would like to see Intuitive Surgical (ISRG) come down to that line around 550 just to see if it can hold it. If it breaks, it will have done something wrong. Mostly, it has had a nice run, but doesn’t inspire here.
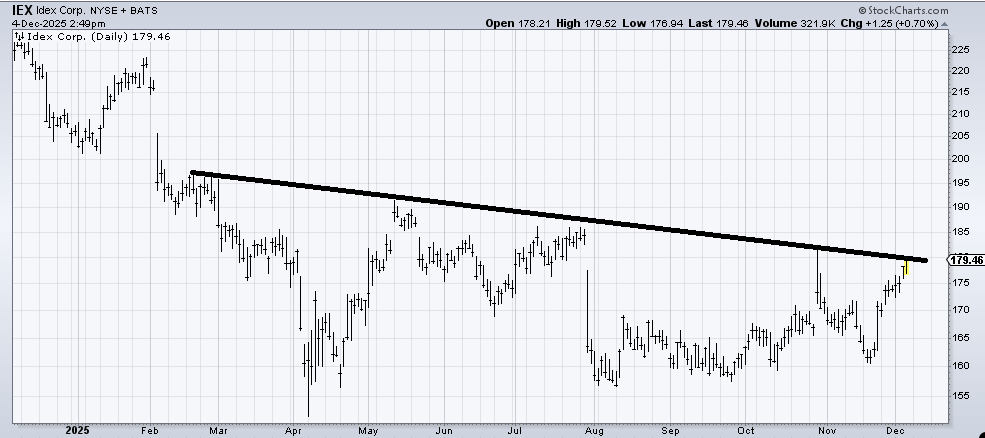
Idex (IEX) looks like a base in the making. This 180-185 area is decent resistance in the near term due to the spike high in late October and the gap down in July. But if it can break over that line, that changes the pattern that has been in place pretty much all year. I lean toward liking this chart, but it might be bumpy since it has a propensity to gap.
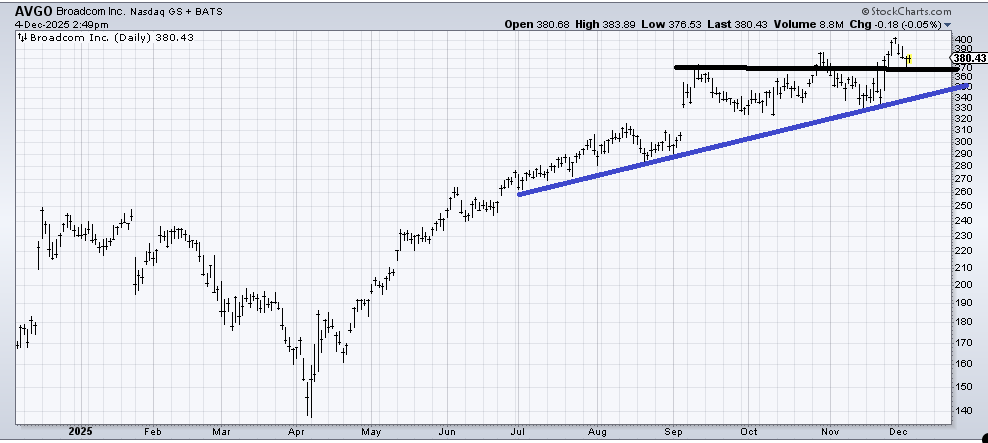
I have liked the chart of Broadcom (AVGO) for quite some time now. Most recently, I was a buyer around 330 in late September. The near term could just as easily hold here or come back to test the blue line. My inclination is just that as long as that blue line holds, the stock is in an uptrend.
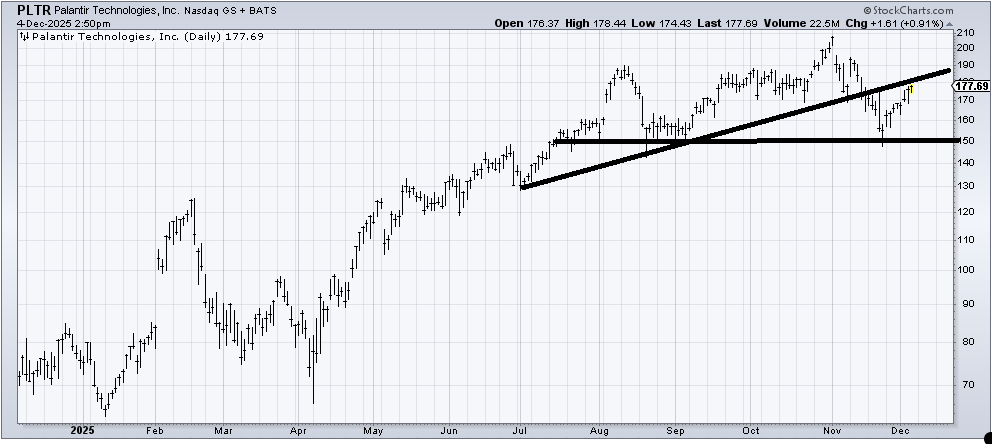
Palantir (PLTR) looks trapped between these two lines. That was a good shakeout down to 150. I just can’t get excited to buy it here. If it pulled back into that 162-165 area over the next week or so, I’d probably lean toward buying it for a trade.
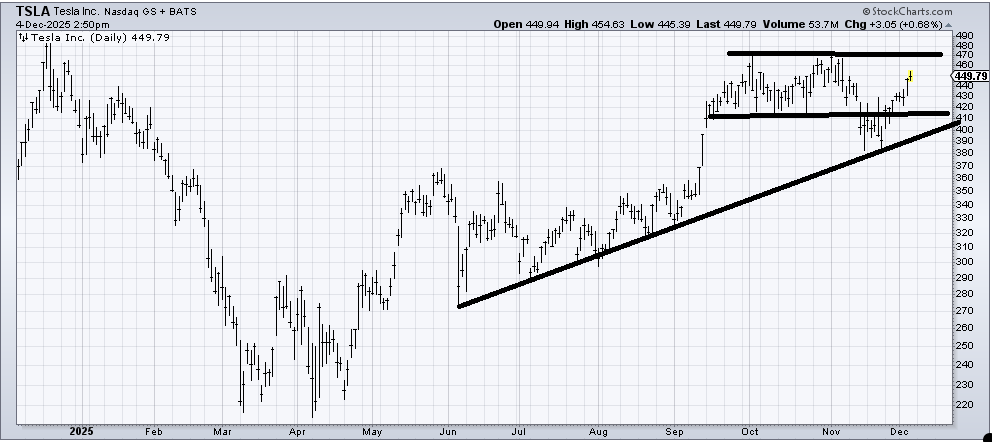
Tesla (TSLA) is up near resistance, but if the chart were bearish, it would not have gotten back over 420 so easily. I’d love to see it pull back toward that 410-420 area to see if there are buyers there again. Let’s see if it can pull back now that we’re overbought.