Follow the Charts: Where to Trim Tech and Embrace Rotation
Pharmaceutical, industrial and consumer stocks are in the sweet spot right now.
You've reached your free article limit
You've read 0 of 1 free Pro articles.
It’s rough out there, especially if you’re holding tech stocks. What first appeared as a rotation away from high-flying tech has morphed into a full-blown retreat. Some of the best-performing names of 2025 are radioactive right now.
If you’re still holding on and hoping for a rebound, you might get lucky, but there are no guarantees. At times like these, it’s important to try to be objective, and charts can help us in that regard.
How to Remain Objective
Look at any chart right now, and ask yourself, "Do I want to own this stock?" Forget the name of the stock, and the story behind it, and focus on the chart.
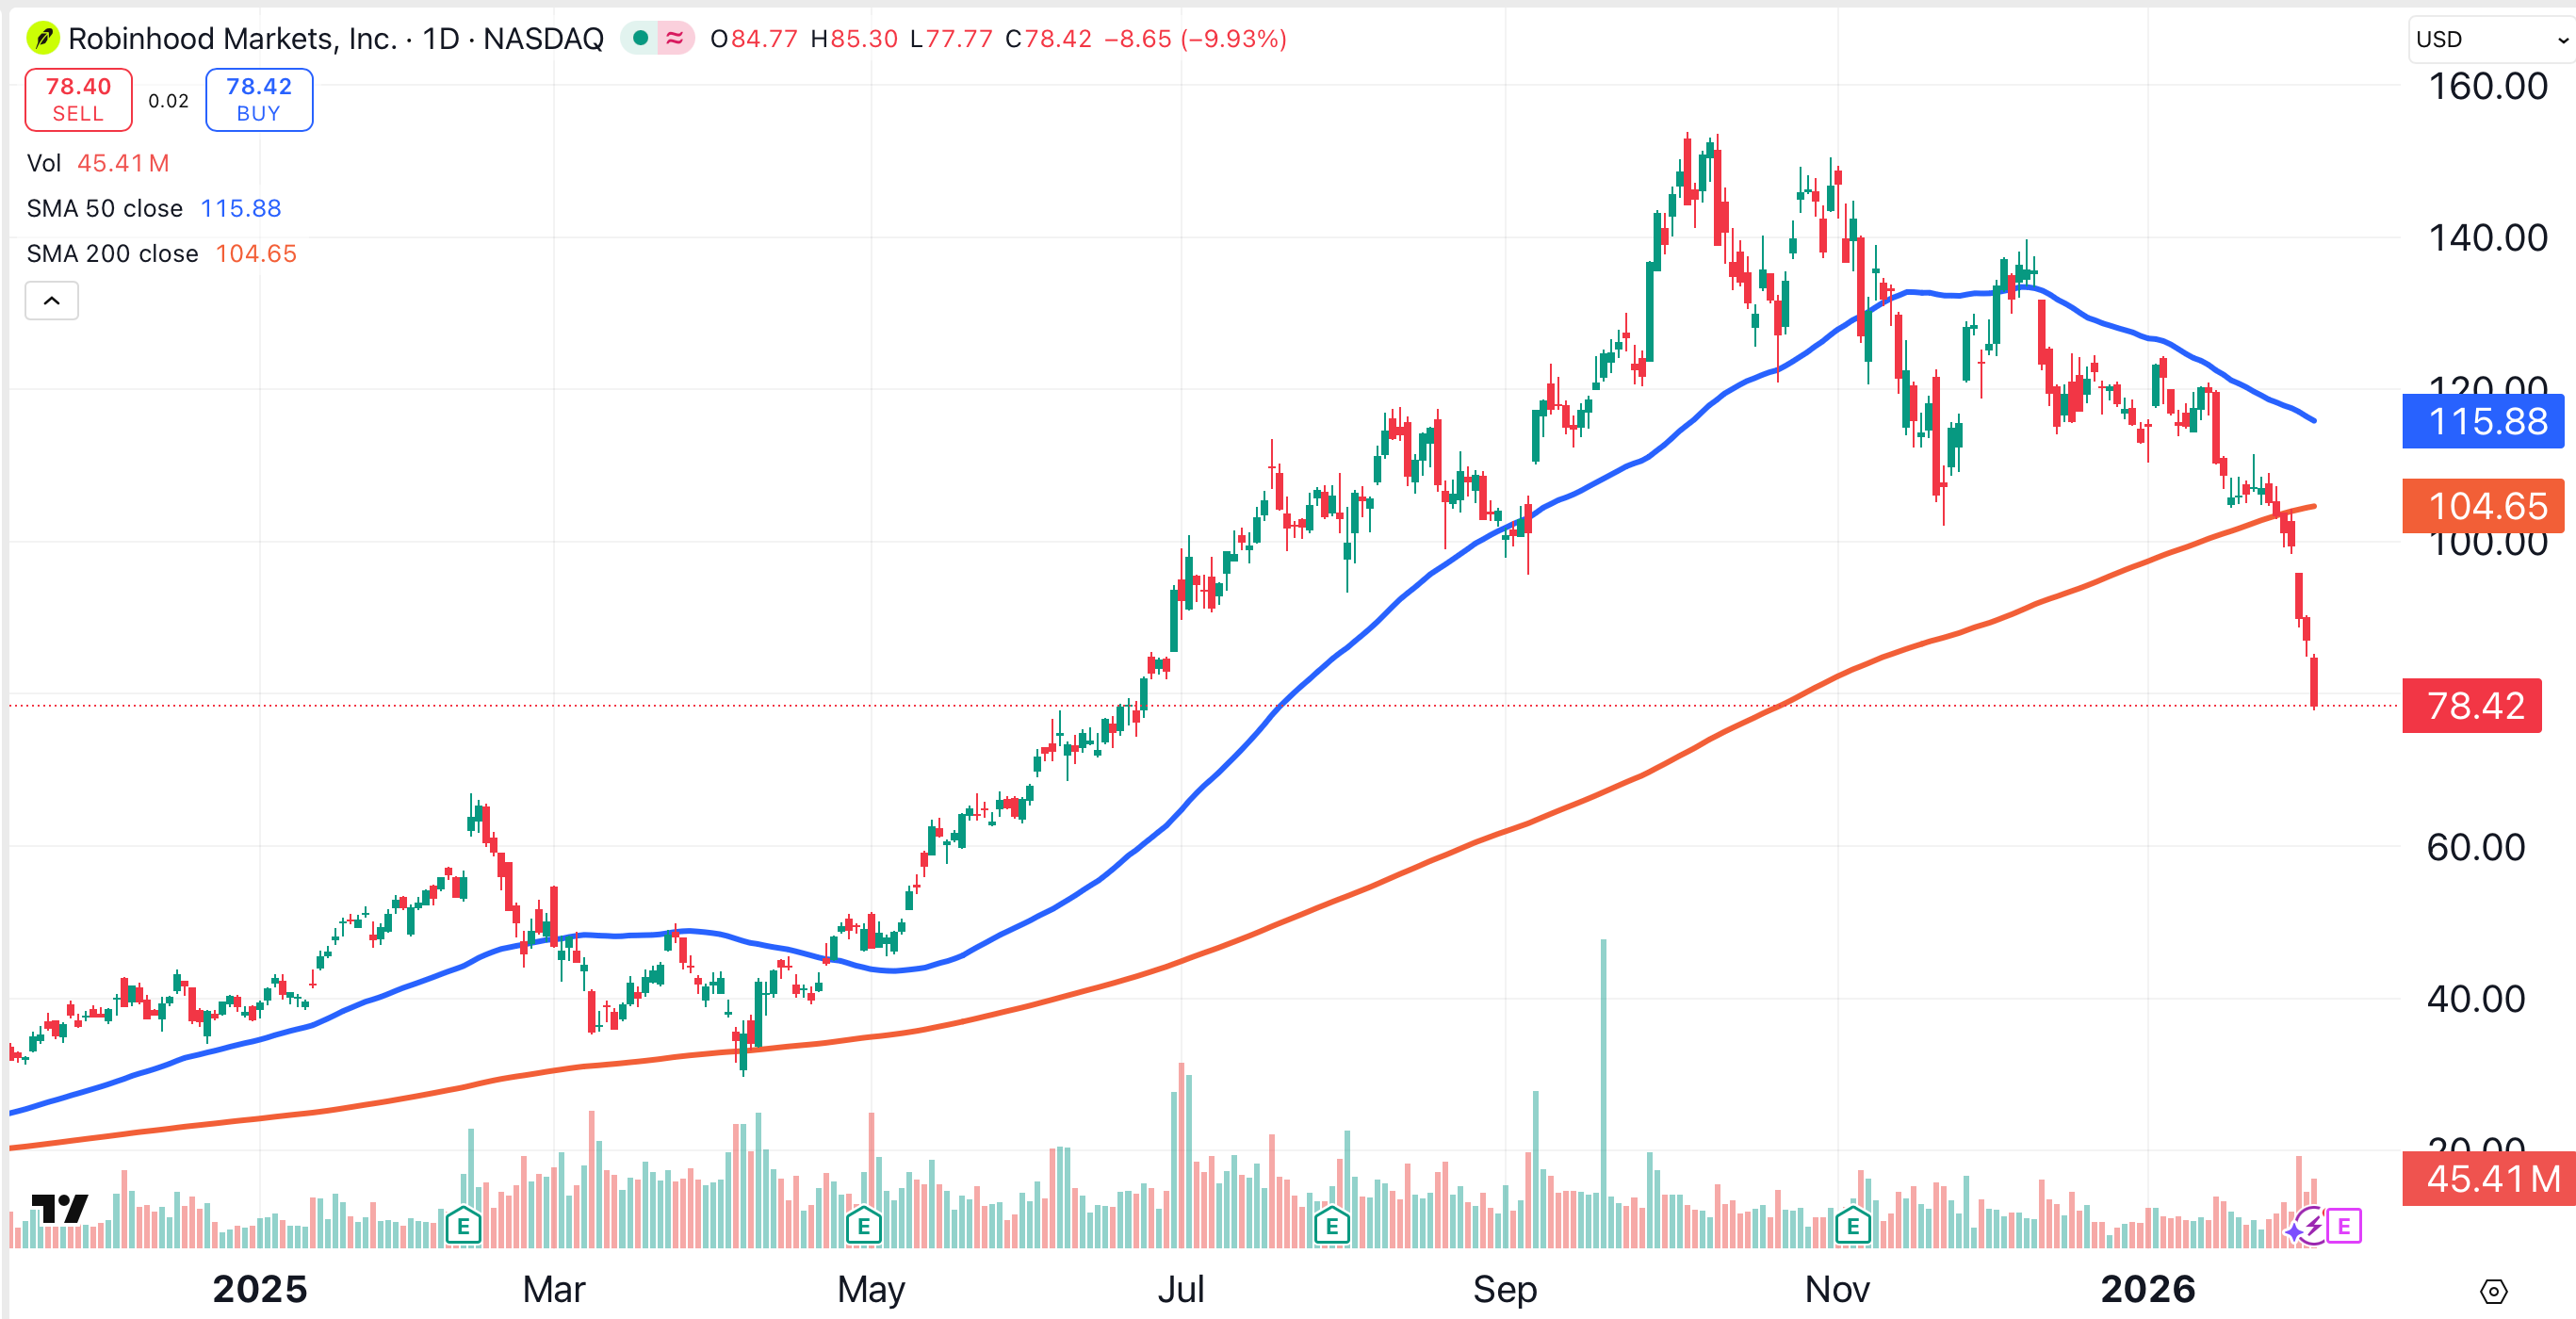
Robinhood (HOOD) is a good example. This stock is getting falling along with tech and crypto, as many Robinhood accounts are focused on those areas. If bitcoin breaks a key level, Robinhood could fall further.
How can we make an objective decision in a situation like this?
I usually show the 50-day (blue) and 200-day (red) moving averages on my charts. A good rule of thumb for a momentum stock like Robinhood would be to close at least half of a position if the price breaks below the 200-day moving average, as it has in the chart above.
Not only does this reduce exposure and help limit losses, it allows the trader to raise cash, creating an opportunity to move money to better-performing sectors.
AI Chips Off the Table
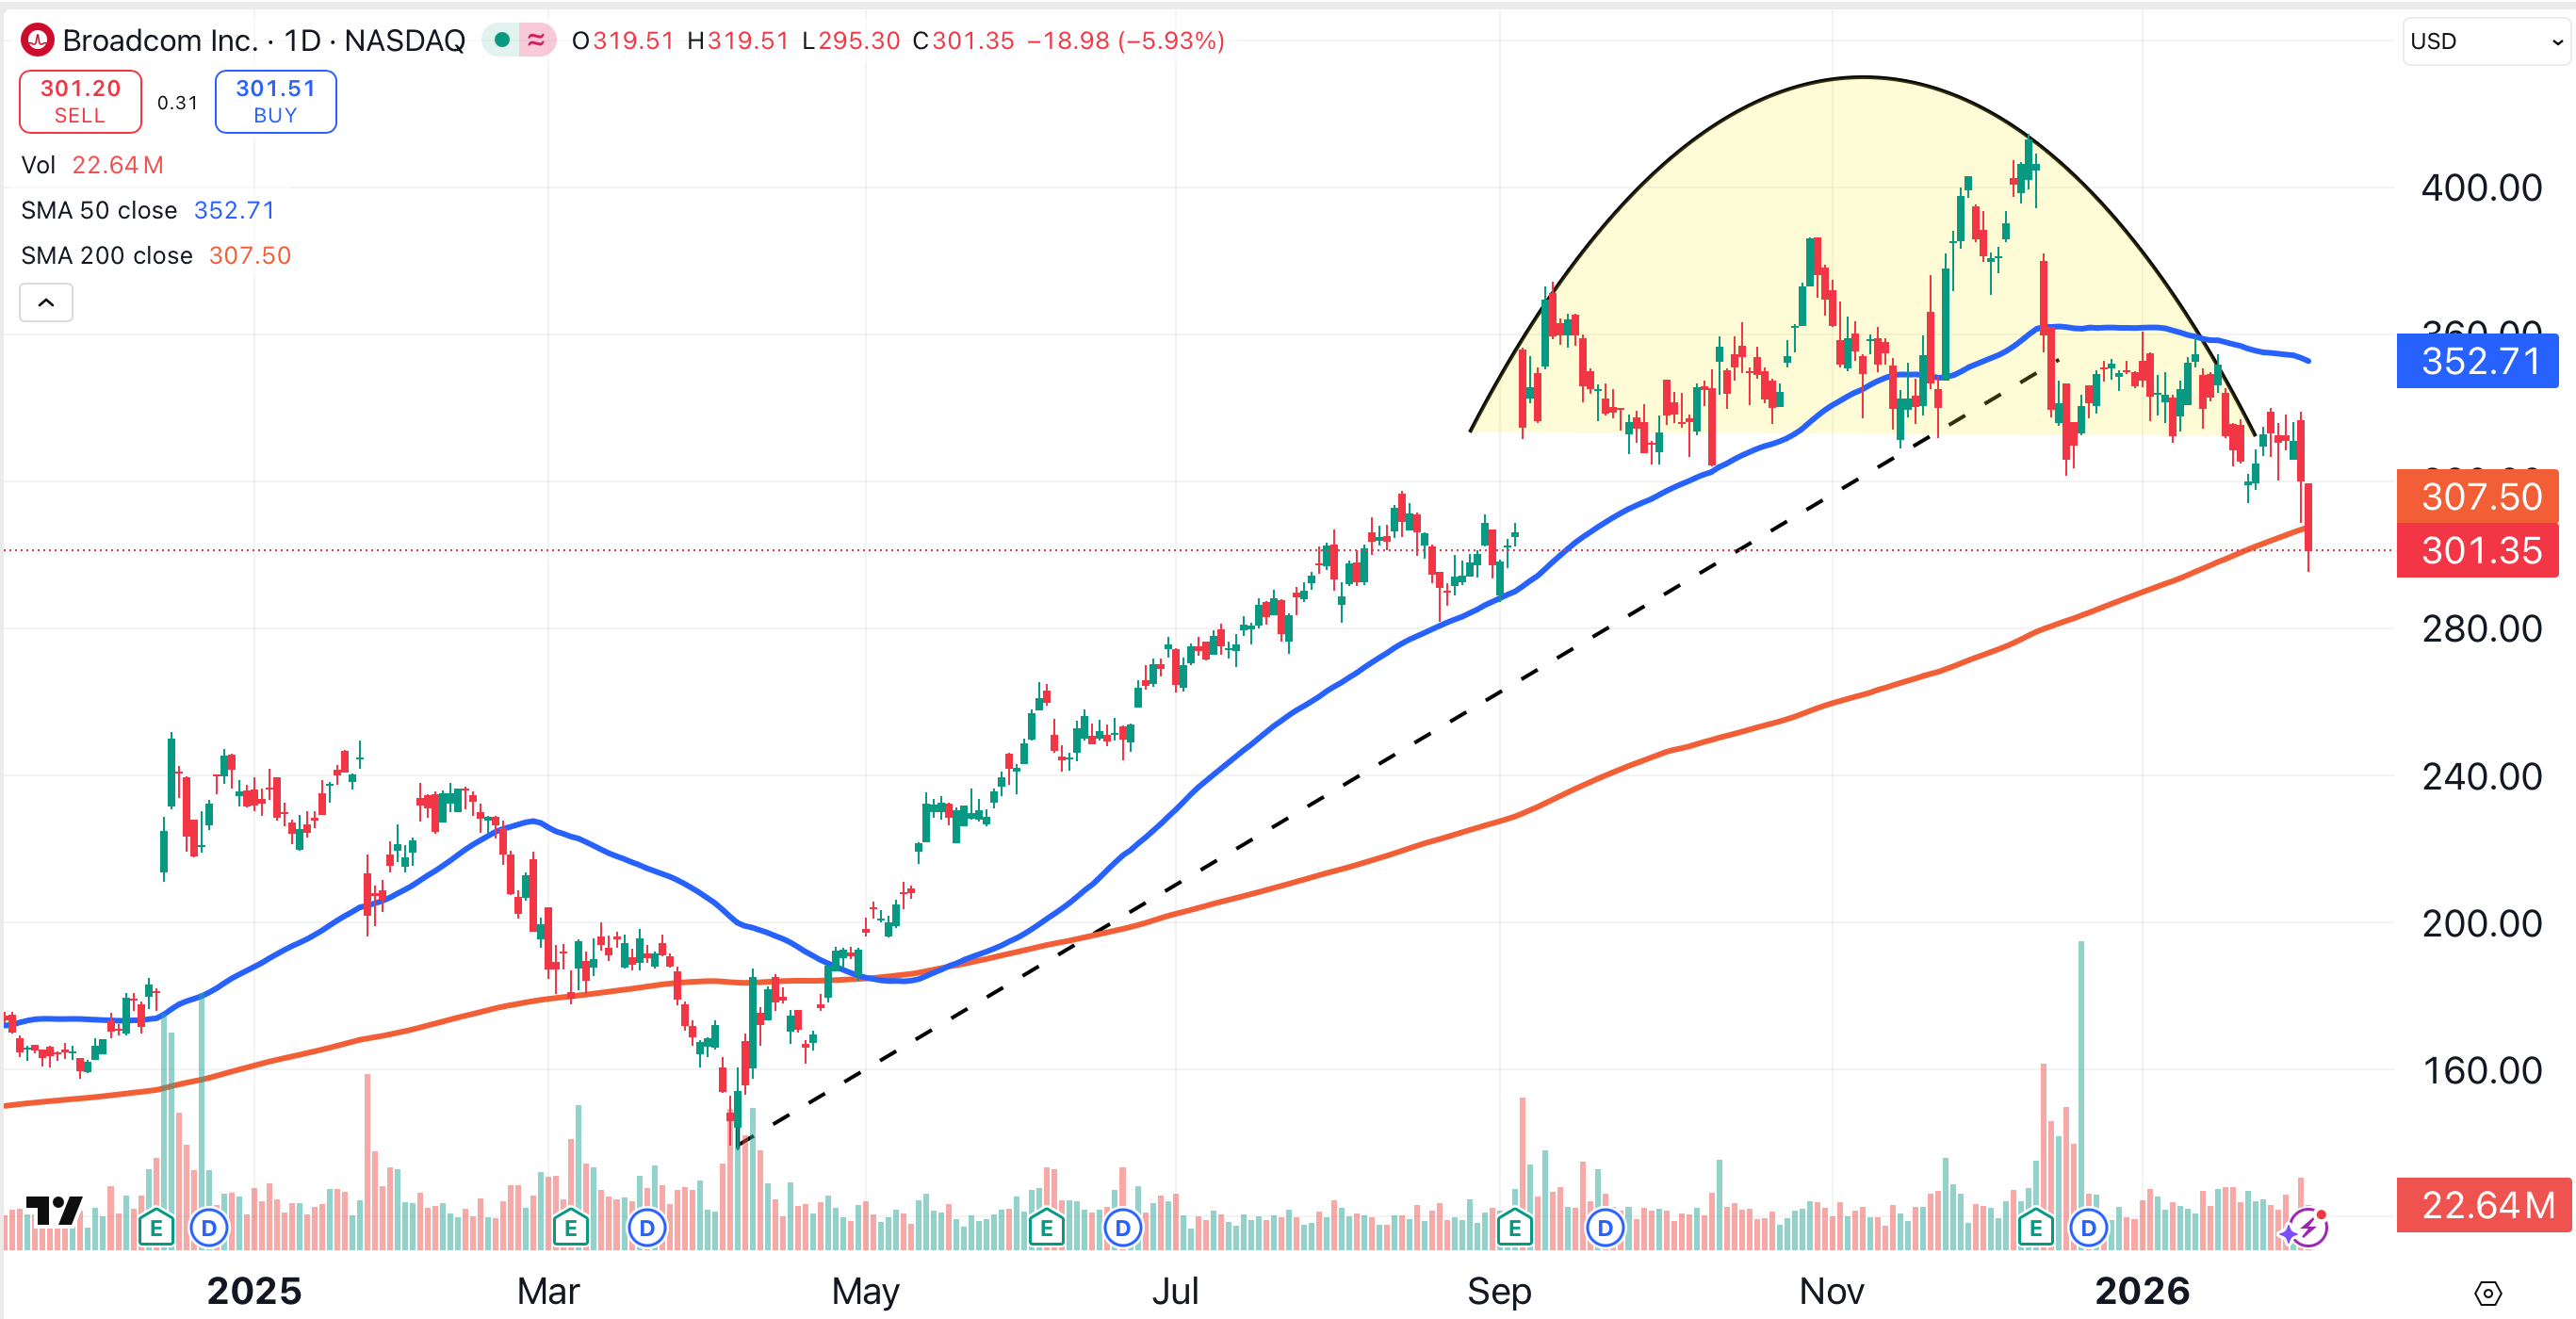
I got some pushback in November when I reduced my positions in AI chipmakers like Advanced Micro Devices (AMD) and Nvidia (NVDA) . Now I’ve further reduced my AI chip exposure by reducing my position in Broadcom (AVGO) .
On Wednesday, Broadcom traded below its 200-day moving average for the first time in nine months. The stock’s rounded top (shaded yellow) indicates that a decline to the $260 area is possible.
As usual, we are simply following the charts. If you go through your charts and view them objectively, there are probably some tech names you should close. If you're not sure about closing these positions, try reducing them by half.
The Bright Side
The good news is, there are still gains to be made.
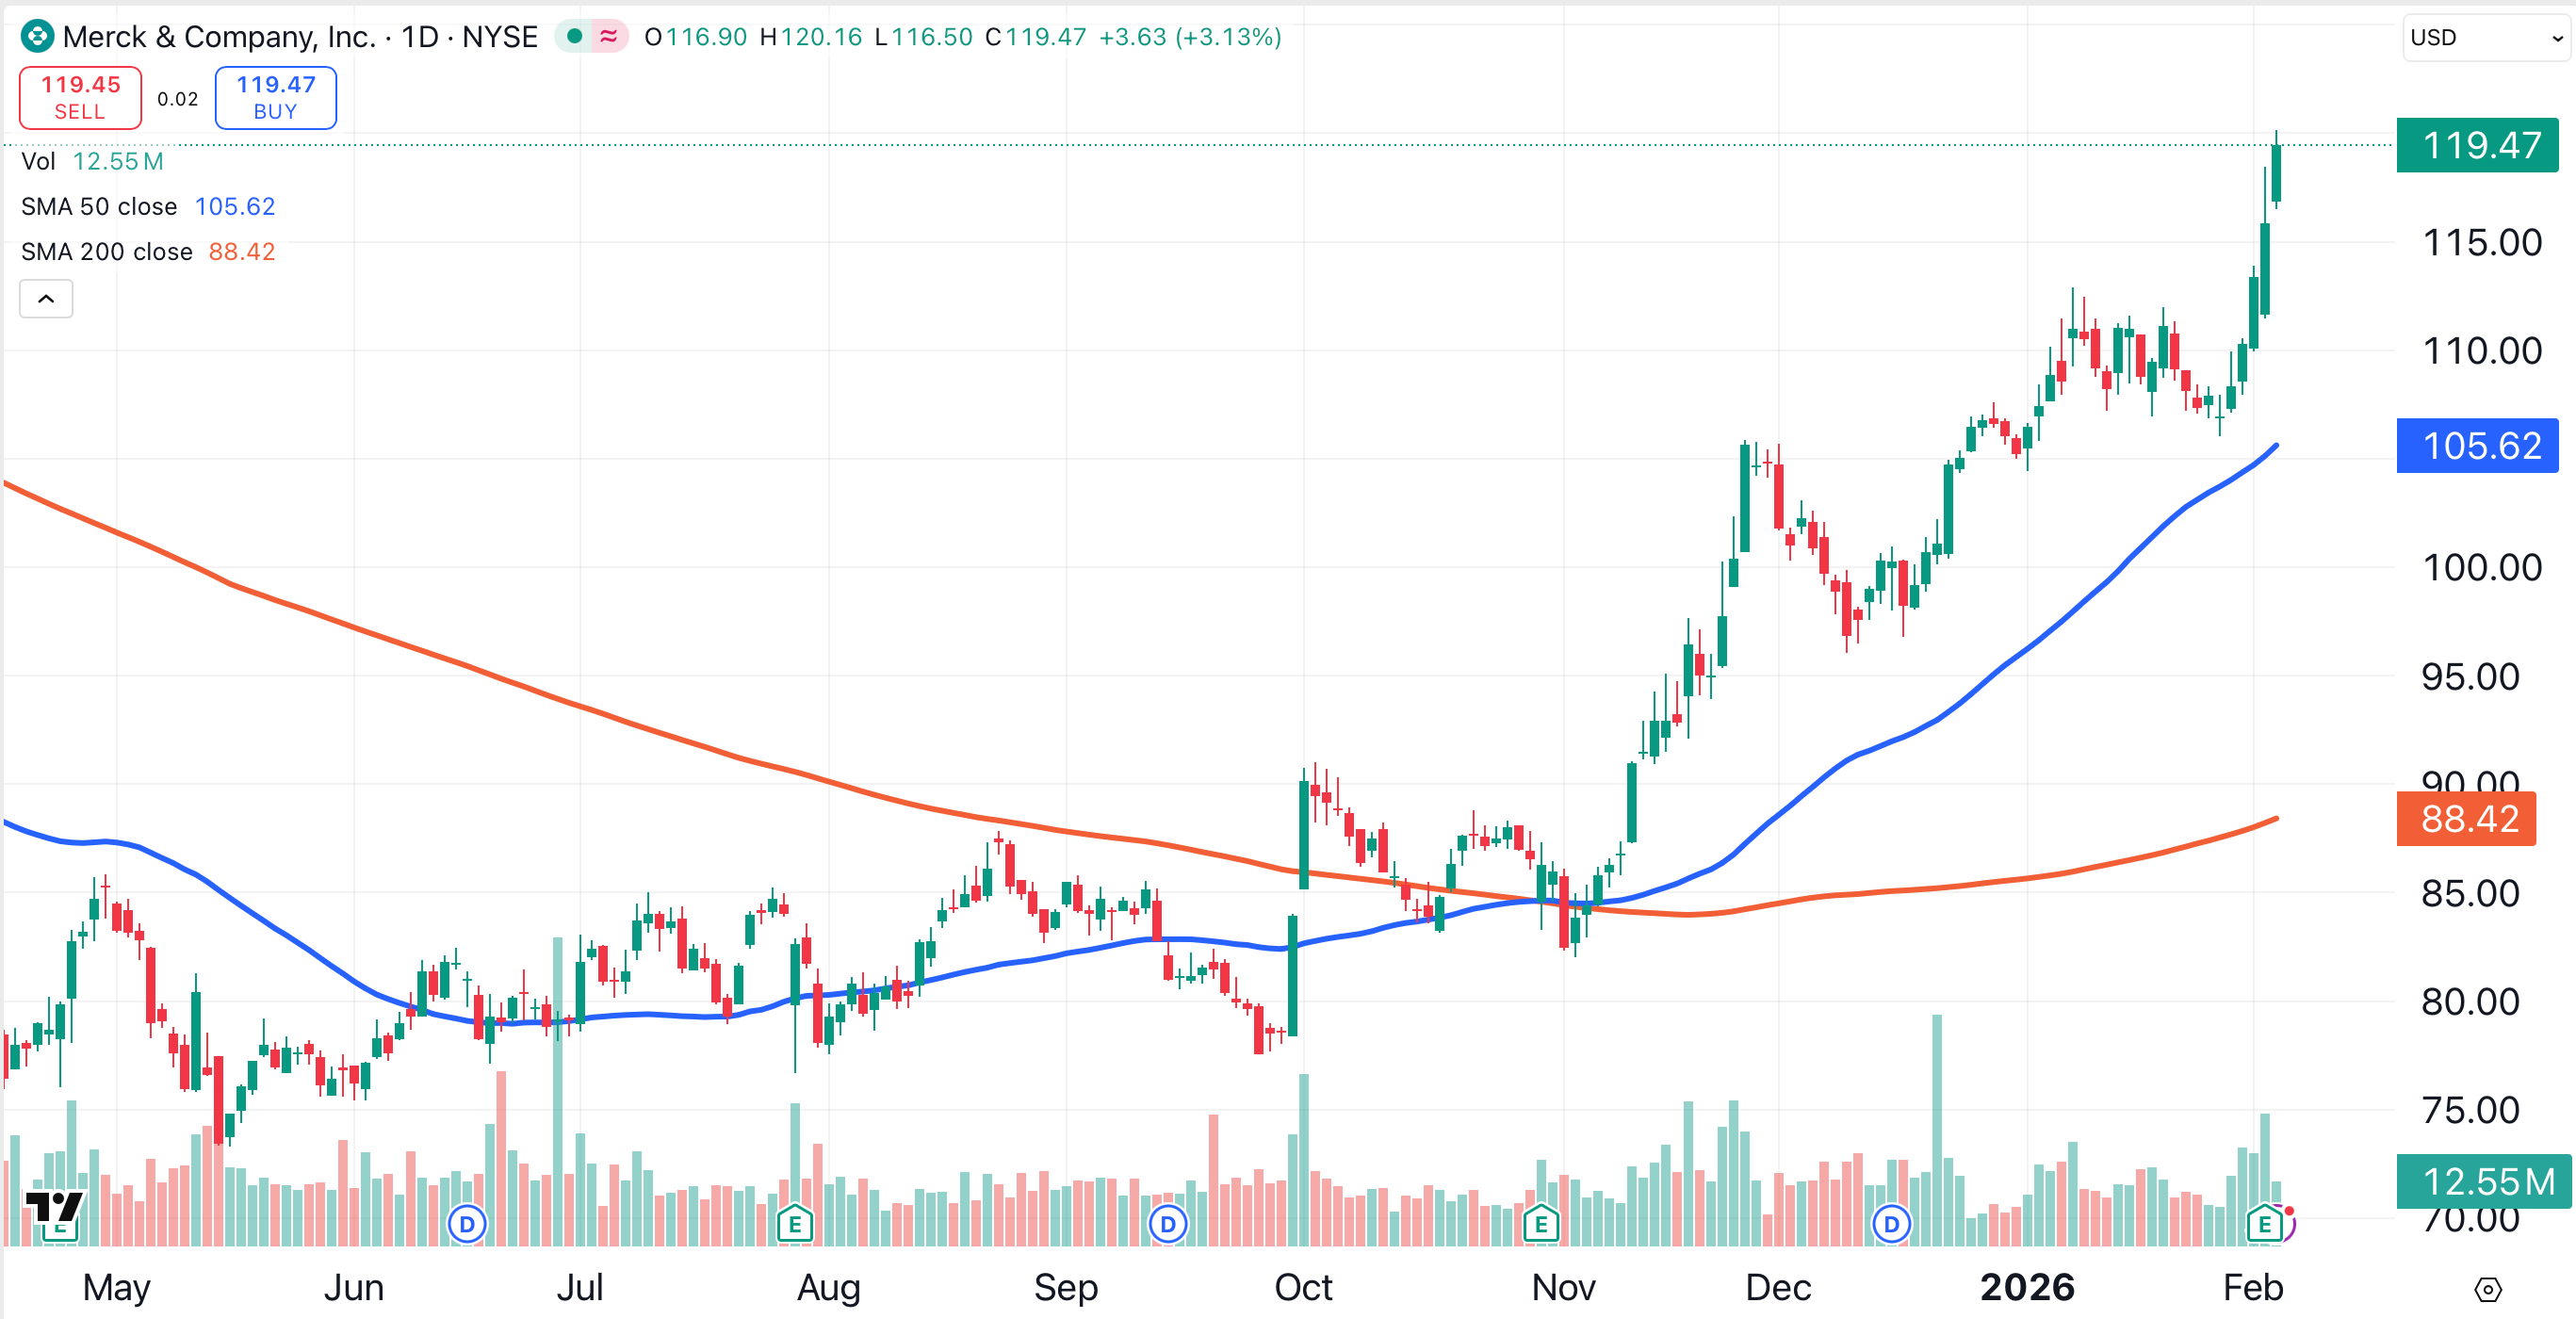
In December, we pointed out that several companies in the pharmaceutical sector were stealing momentum away from Nvidia.
Since then, Merck (MRK) has gained over 16%. This is an unusually large gain for a so-called boring pharmaceutical stock in just two months. Merck closed at a 52-week high on Wednesday.
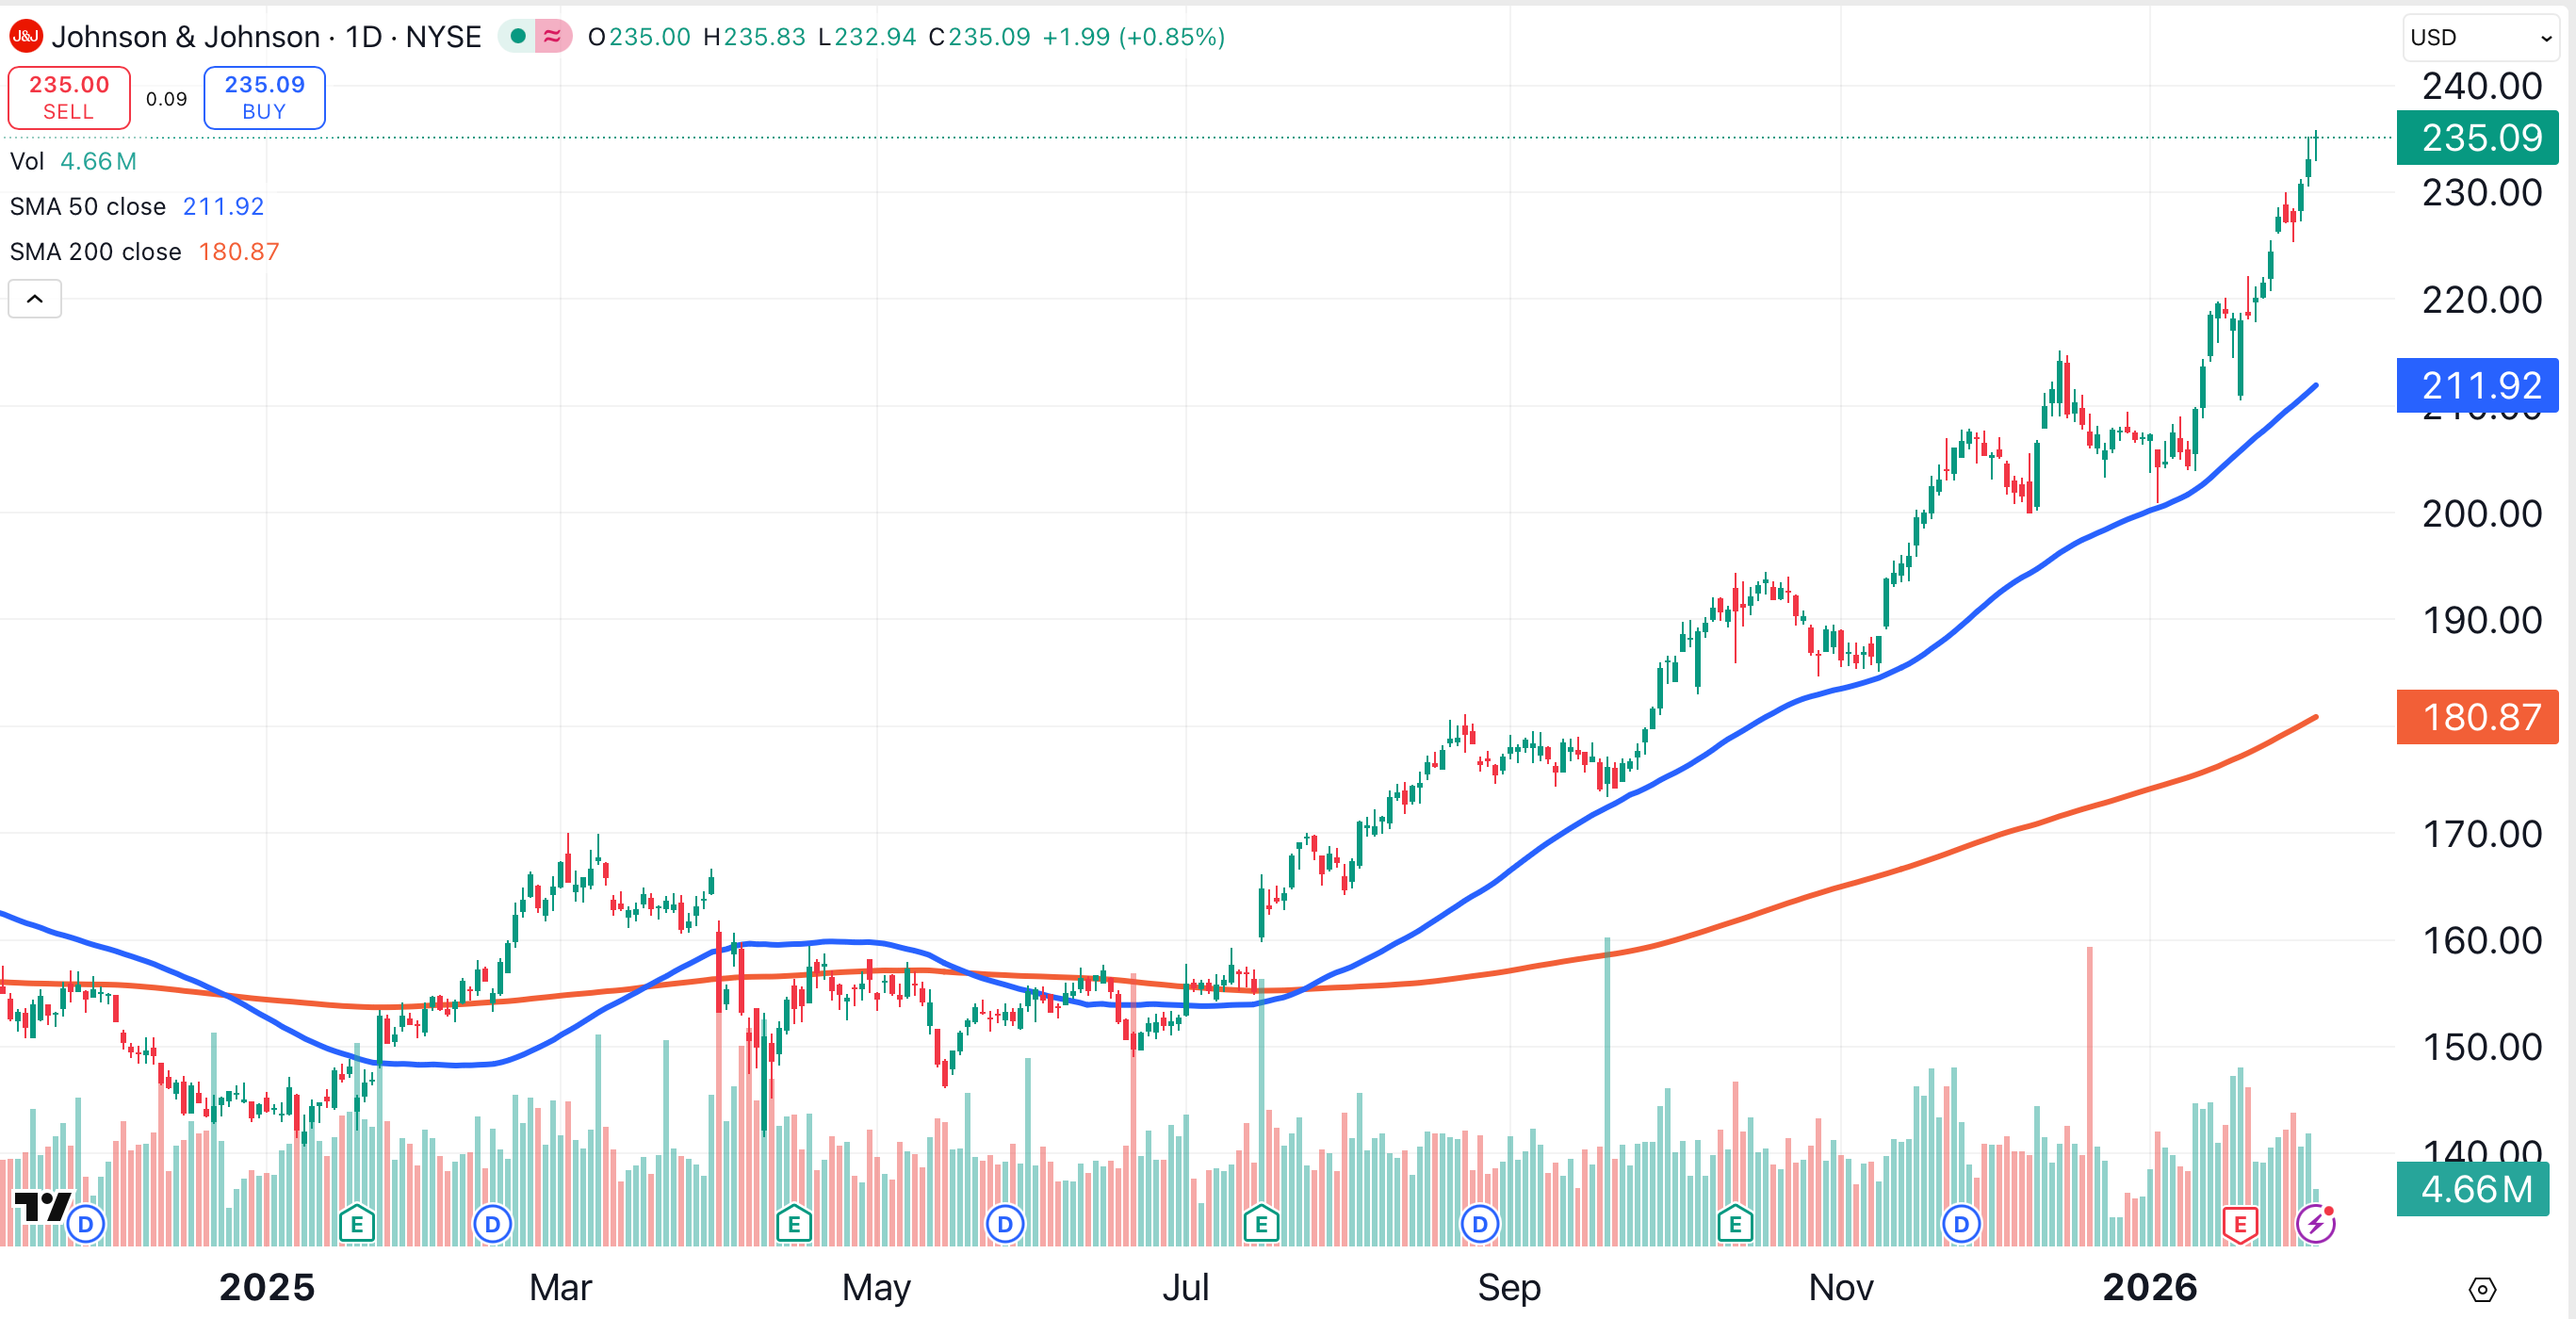
Another stock we recommended in that article was Johnson & Johnson (JNJ) . The New Jersey-based pharmaceutical and consumer products giant closed at an all-time high on Wednesday, and has gained over 14% since our recommendation.
Bottom Line
Large profits can lead to large profit-taking, and we’re seeing that in tech right now. We can make a choice to trim or exit those areas, and lean into the rotation into pharmaceuticals, industrials and consumer products, as these sectors are performing well relative to tech.
At the time of publication, Ponsi was long MRK, JNJ, AMD, NVDA and AVGO.
