Finally Some Improvement to the Indicators
What does this mean as we go into the long weekend?
You've reached your free article limit
You've read 0 of 1 free Pro articles.
The Market
Hold onto your hats. I am here to report that something changed in the indicators.
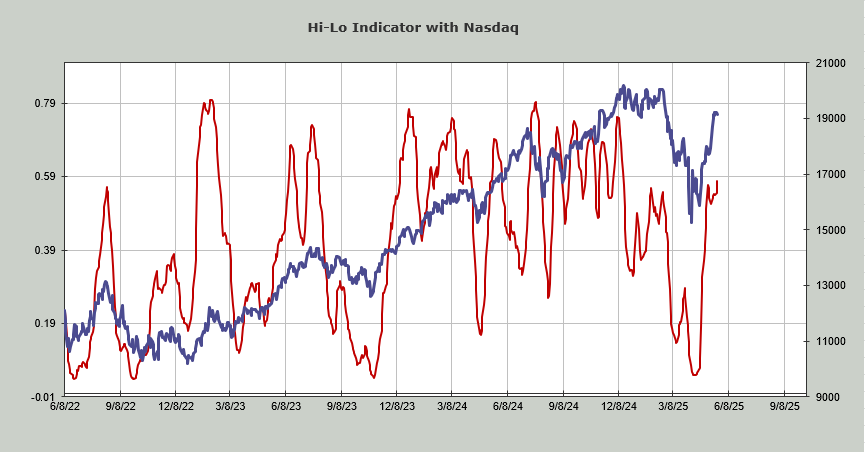
The Nasdaq Hi-Lo Indicator, which I have been saying should push higher, finally did so. It removed that minor negative divergence.
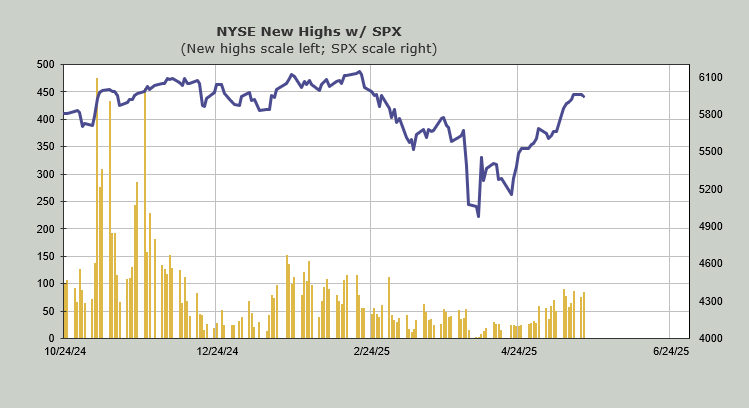
The number of stocks making new highs has been generally flat, but if we get another rally into the end of the week, we might see the NYSE make more than 100 new highs. All that does is push us to where we were in February (and a far cry from the 450+ we saw in November), but it at least shows some improvement.
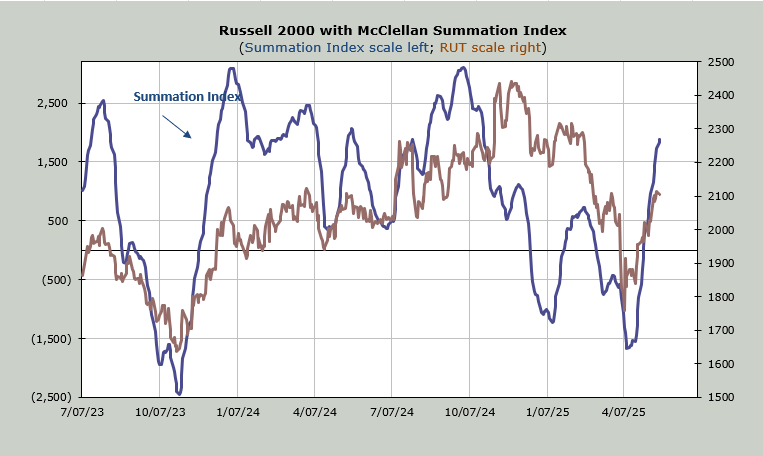
But wait, there’s more. The McClellan Summation Index is still rising (chart below), but what has changed is what it will take to halt the rise. That number was -1700 advancers minus decliners on the NYSE yesterday, and today it is now -700. These are approximations, but once the ‘what if’ goes under -1000, I consider the cushion to be minimal.
If we rally tomorrow and breadth is good, that ought to go back up, but it’s worth paying attention to because, as you know by now, I think we’ll be intermediate-term overbought around Friday of this week.
If we see the indicators rolling over, that would give some fuel for a more volatile market in June. I’m leaning that way, but I’d like a bit more proof that we’re headed there.
New Ideas
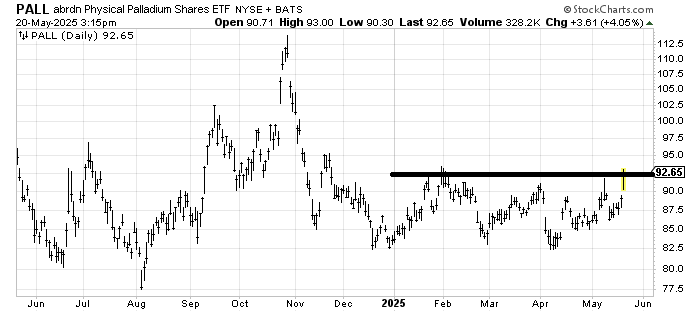
Months ago, I showed you the chart of Palladium PALL, noting that it looked to be building a base. It had a big rally today, taking it to the top of the range it has been in all year. I would respect a breakout.
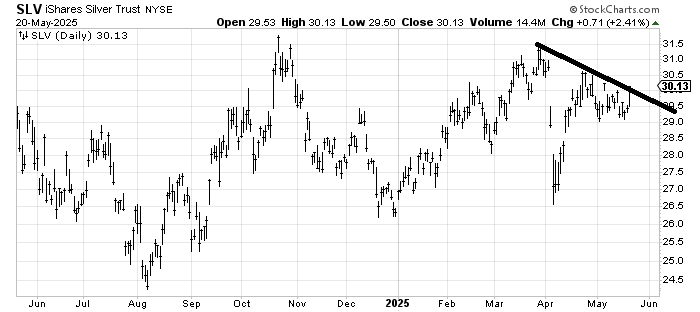
But that got me looking at SLV, an ETF to be long silver. It’s been a laggard in the precious metal area, but crossing that downtrend line would make it much more interesting.
Today’s Indicator
The McClellan Summation Index is discussed in full above.
Q&A/Reader’s Feedback
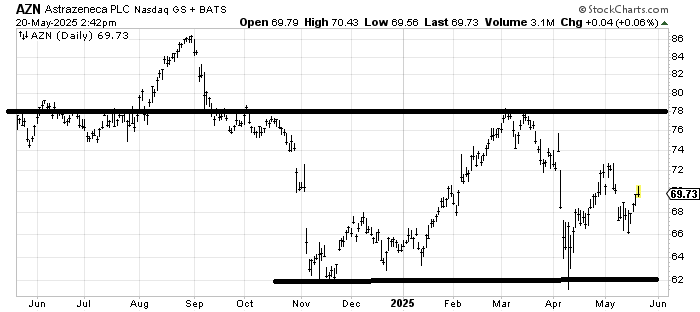
So, instead of everyone loving the tech stocks, now they are asking about healthcare! Astrazeneca AZN is really just in a wide range for the last six months. In the near term, there is a decent resistance at 72. I would like to see a dip or some sideways action between 68-69 before it tries to get to that 72-73 area. I’d be a buyer around 68.
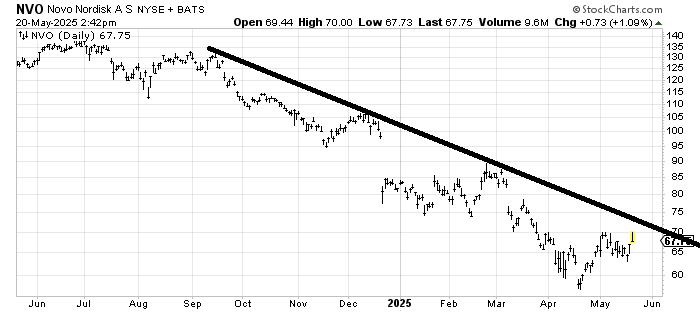
Novo Nordisk NVO has had the same problem since last fall: it is a stock in a downtrend. Unless/until it can cross over that line, I do not trust it. Note if it can cross over the line in June, I would like it more because it would then be over the April and May high at the same time it is crossing that line.
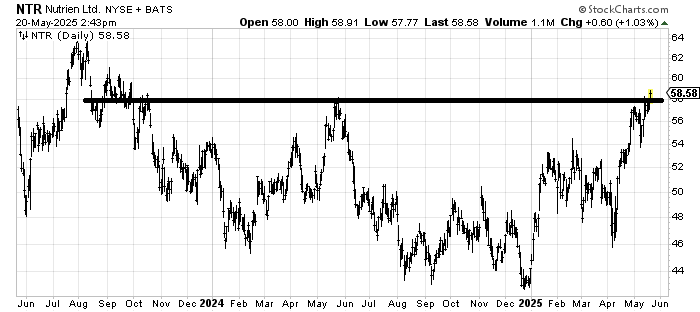
The question is if I have a measured target on Nutrien NTR, which I have liked for months now. There is resistance all the way up, but my next measured target is still that gap fill around 62. I would love to see it get there and come back and test the 58 level (to be buyable there).