Everybody's Talking About This Indicator, but Do They Understand It?
Let's talk about how the market behaves following a signal from this indicator that's been in the news lately.
You've reached your free article limit
You've read 0 of 1 free Pro articles.
The Market
Anecdotally, I can’t find a bear anymore. Yet they filled my world on Monday. Statistically, there are still too many bears, though I expect that to change quickly.
But the talk of the day is about a Zweig Breadth Thrust. Let me be perfectly honest with you, I have heard about it, I am sure I read about it in some book at some point, but I have never used it. I cannot give you all its parameters.
What I can tell you is that everyone seems quite excited over it because, apparently, since 1960, every time we have had one, the market has been higher a year later. The contrarian in me wants to scream several things from the hills. The first being that markets tend to be higher 75% of the time, so all this does is confirm what we already know, maybe with a bit more confidence.
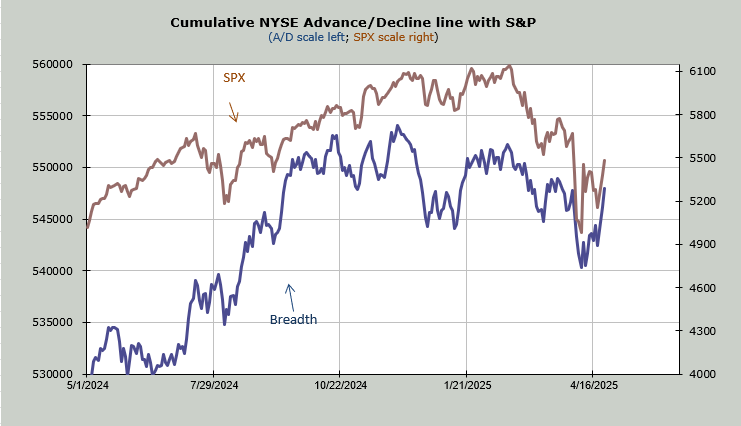
We also know that breadth has been strong because I have been writing about it daily for more than a week. This is no surprise. Remember all those breadth charts we have looked at, starting with this one, where breadth has made a higher high while the S&P hasn’t (over the April 9th move).
But let’s take a look at 2023. Apparently, that year had not one but TWO breadth thrusts. So the first thing I want you to understand that it seems most think that means the market goes into a ‘nothing but up’ mode but I look at 2023 and I see an 11% multi month decline during the year so we can be sure all those breadth thrust fans haven’t considered that they probably got bearish during that decline.
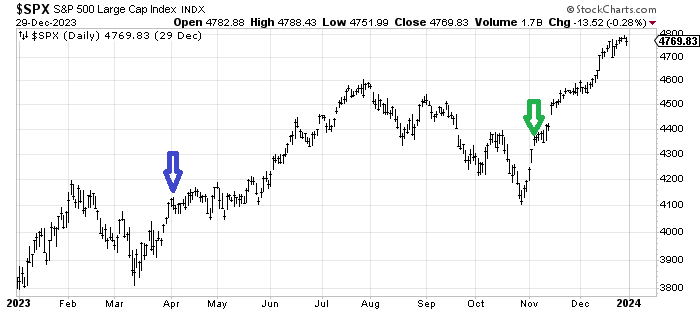
The first such signal came at the blue arrow. What did the S&P do thereafter? It went sideways for nearly two months. How many of these folks who are so excited now do you think would sit through two months of chop and stay all bulled up?
The second one came a bit quicker off the low than the first (green arrow) and it had a sideways consolidation for about a week before heading upward. I am sure most folks are hoping this looks more like the green arrow than the blue arrow.
My point is that markets tend to go up over time. Do you really need a ‘signal’ to tell you so?
But think about the fact that after the signal in both of these cases (and I would guess in most), the market then went into a period of digestion. We are set to get short-term overbought as we head into next week. Wouldn’t some downside or sideways chop be in keeping with this? That’s my call. That’s been my call. I’m sticking with it.
New Ideas
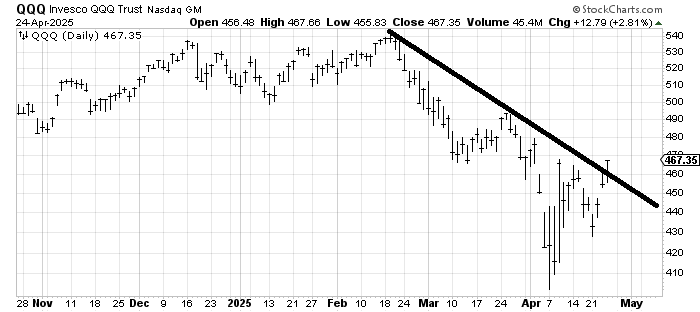
When I first said I thought the QQQ should rally (off that early April low), I had a target around 470. I thought we should fill that gap down from April 2nd. We have never gotten there. The QQQs have crossed the downtrend line (positive) but if we can fill that gap tomorrow (anything in that 470-475 area) I would then look for that pullback/sideways action next week, although I still think there will be a desire to buy tech as folks go back to their favorites.
I still want the S&P to crack over 5500, which it has not been able to do. If it can do it on Friday, I’d look for shorts to run for cover and give us that chop next week.
Today’s Indicator
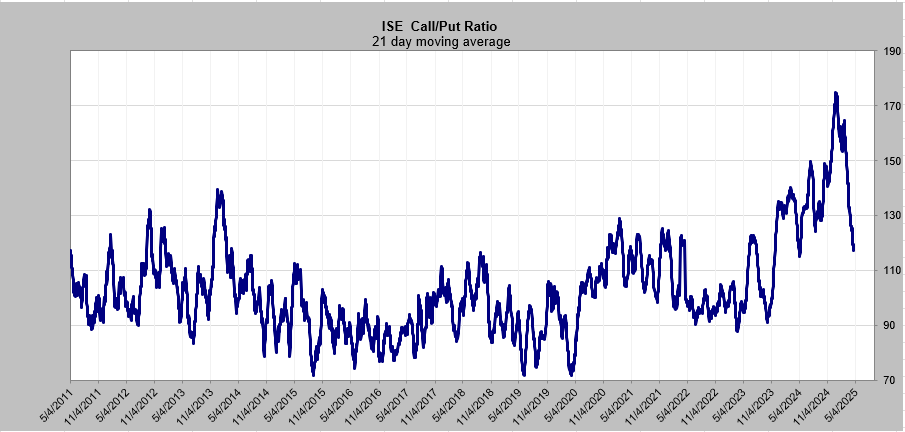
The 21-day moving average of the ISE call/put ratio has come down quite a lot. It’s getting to the point where I don’t think it can fall much more without a bounce first.
Q&A/Reader’s Feedback
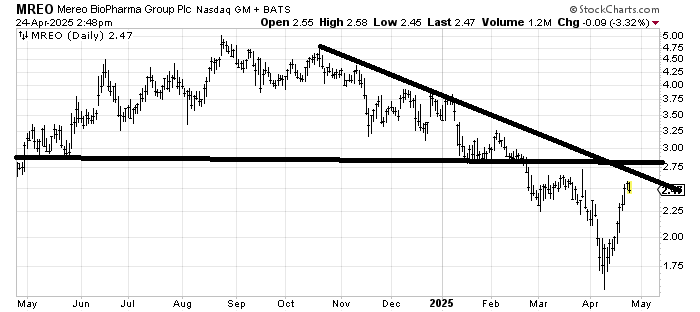
Mereo Biopharma MREO—feels like I am typing Oreo!!—might be trying to bottom, but all that resistance overhead at 2.75-3 is going to be a problem for me. Like most charts, if it is going to get through, it is going to have to eat through it one bite at a time. A pullback to 2.25 that holds would be buyable for a trade because then the risk/reward isn’t bad. Under 2.25, you’re wrong.
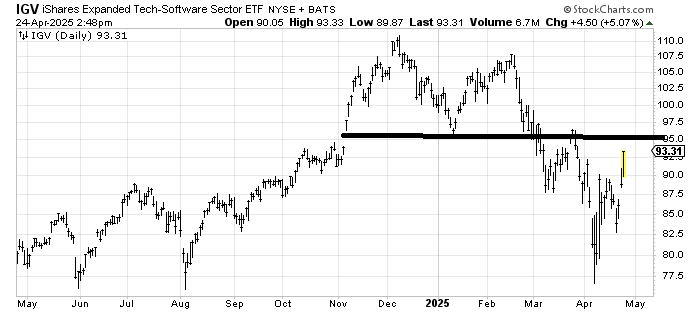
IGV finally chewed through 90, and now it has trouble at 95. I believe it was a few weeks ago I drew in that if it could get over 90, it ought to get to 95, where it has resistance. But then a pullback from there would form a head and shoulders bottom. Note that the top on IGV is smaller than most of the other charts we look at in technology.
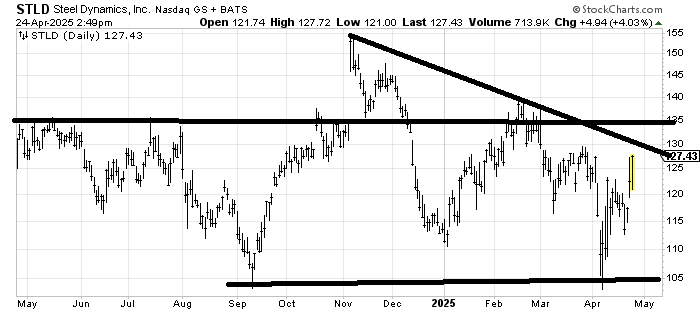
Steel Dynamics STLD hasn’t gone anywhere in a year, which these days should be considered a positive. There is an awful lot of resistance in the 130-135 area, so it’s hard for me to get excited over it. I’d like to see it do some more work to eat through that resistance. I would say I lean positive, but a lot of patience is needed.
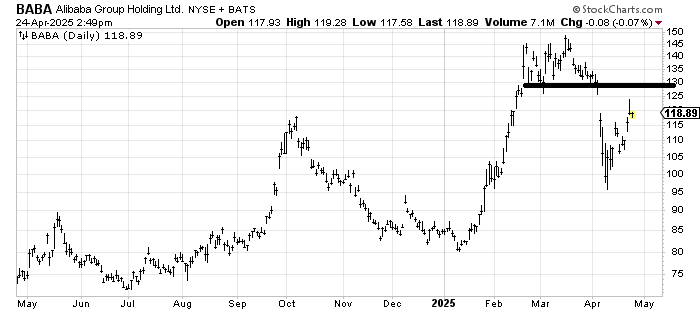
Alibaba BABA has a lot of resistance at 125-130 on a gap fill. I expect that is where it stops on this run.
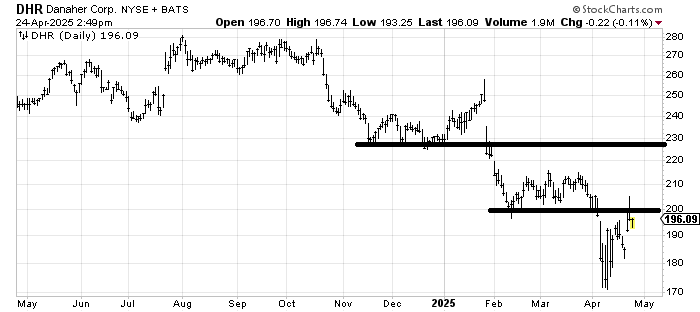
The most positive thing I can say about Danaher DHR is that it met its downside target when it tagged 170 in early April. But there is a long way to go for base building and chewing through resistance. Maybe the price is right down here, but it will take a lot of patience and fits and starts to chew through the resistance.
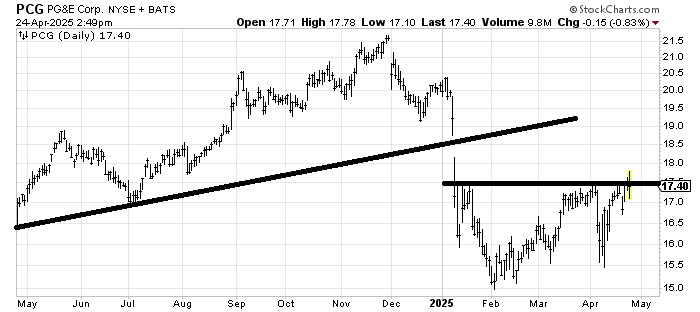
PG&E PCG should fill that gap up there around 19, maybe even tag the underside of the broken trend line around 19.50. Also note that this is a stock that has ‘done work’, so when you wonder what I mean by ‘work needs to be done’, picture this chart. All those ups and downs over months.