Everybody Loves Bonds
But the real question is, when will the stock market be ready to stop going down?
You've reached your free article limit
You've read 0 of 1 free Pro articles.
The Market
When I said last week I wanted to see a green day followed by a few more down days I really did not have this volatility in mind. But this is what we’ve gotten.
I still think we are on track for a short-term oversold rally (more on that below), but I must say I would have preferred a little panic, and it’s more like gloom than panic. For example, the QQQs didn’t even trade 50 million shares today.
And sure, folks sold more than just tech and growth today, but downside volume came in at 79%. 90% or more is panicky.
Or the put/call ratio was .95. Why wasn’t it over 1.0? Sure, it’s been over .90 for five of the last six trading days, but more puts than calls tells me there is some panic in the air.
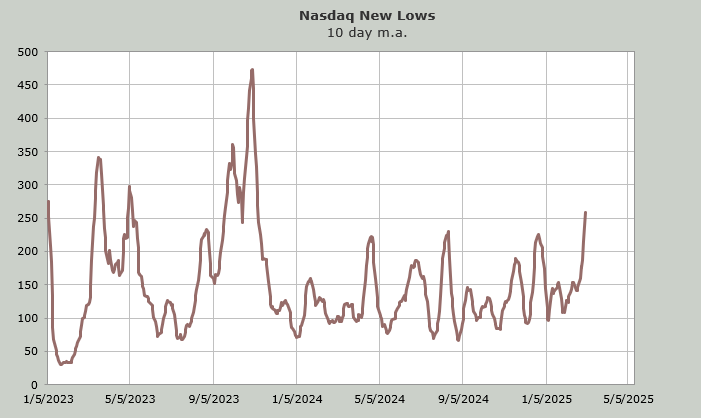
Then there is the number of stocks making new lows on Nasdaq. Friday had just over 400. Today had just over 500. You want to see fewer stocks making new lows, not an expansion. The ten-day moving average of new lows is now the highest since the fall of 2023, and Nasdaq is nowhere near those levels.
Nasdaq’s Hi-Lo Indicator is at .28 so that could be under .20 in another few days. The NYSE is at .40 so that has a lot more work before it gets oversold.
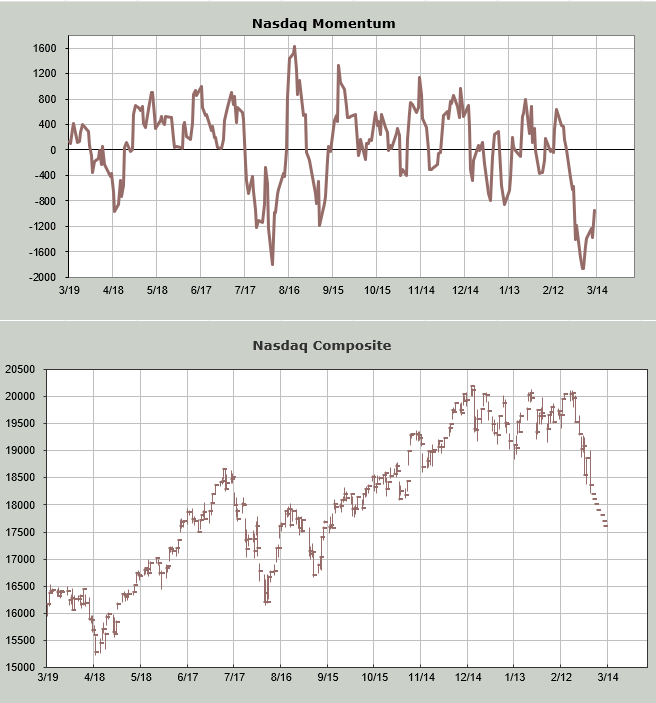
My own Oscillator will be oversold later this week. The Nasdaq Momentum Indicator shows an oversold reading on Tuesday/Wednesday this week. Here, I walk Nasdaq down nearly one thousand points in the next week to see the day the indicator stops going down even if price continues south. The exact day is not important but the general time frame, which is this week.
If we get a 90% down day in the next day or two, that would at least indicate to me there was some panic selling.
New Ideas
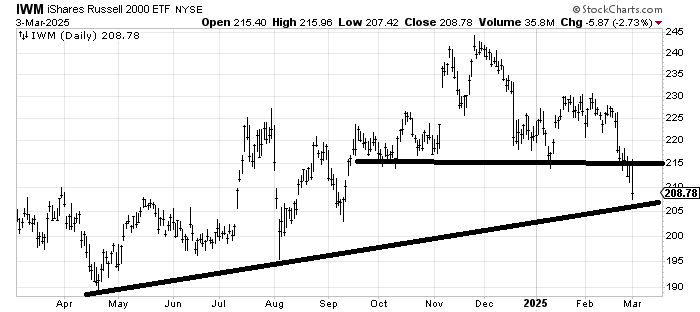
I have not been a fan of IWM because it did break 215. But I do feel compelled to note that there is some decent support at 205. If we do get an oversold rally, this should bounce. But now the 215 resistance is very obvious.
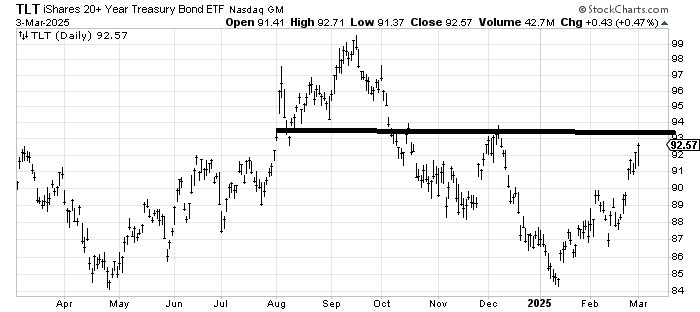
Just a reminder that all of a sudden, everyone loves Bonds, and there is some good resistance at 93.
Today’s Indicator
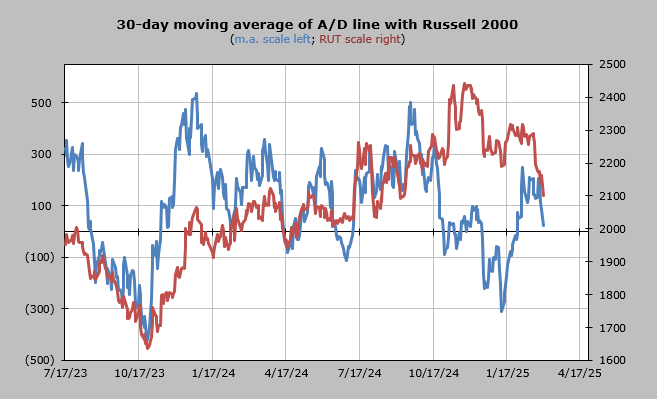
The 30-day moving average of the advance/decline line is not oversold yet.
Q&A/Reader’s Feedback
Helene welcomes your questions about Top Stocks and her charting strategy and techniques. Please send an email directly to Helene with your questions. However, please remember that TheStreet.com Top Stocks is not intended to provide personalized investment advice. Email Helene here.
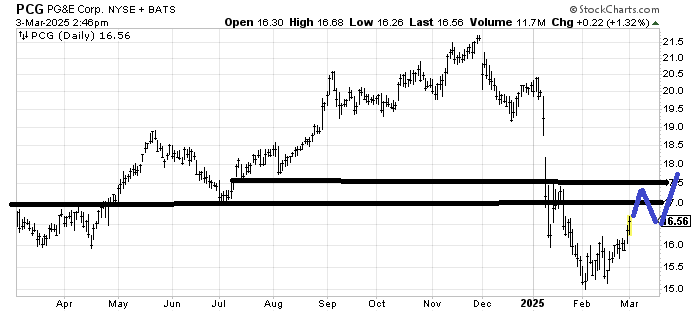
PG&E PCG is trying to find a bottom of sorts. I think it runs into resistance in the 17-17.50 area in the near term, but what if it then comes down and forms a head and shoulders bottom?
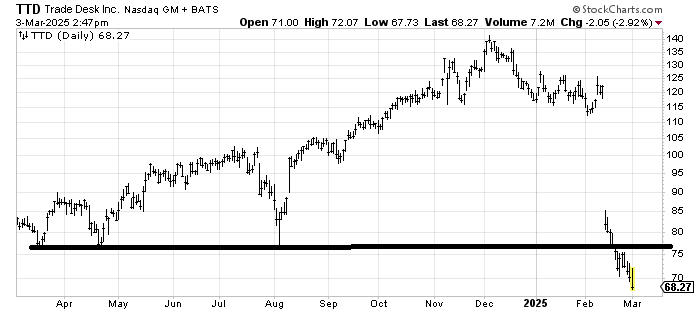
I really thought after that big gap down, that Trade Desk TTD would bounce off 75. Yet it has barely had an up day since that gap. That’s a major change in the way the market treats growth stocks. Now, any rally to that 75 area should be resistance.
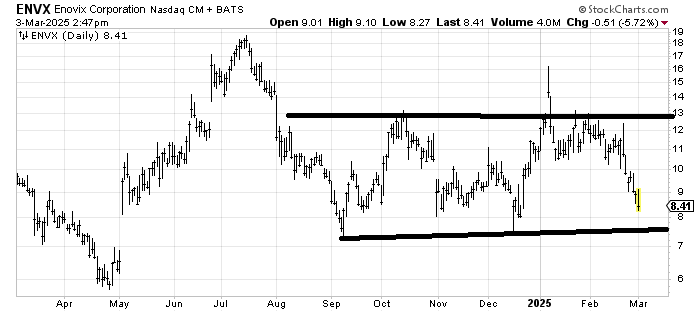
Enovix ENVX has been in this trading range for six months now (sound familiar?). I do wonder, though, if it is getting oversold as it approaches the lows around 7.25. It ought to bounce; I’m just not sure I’d buy it because the other two times, the market was intermediate term oversold, which it is not so now.
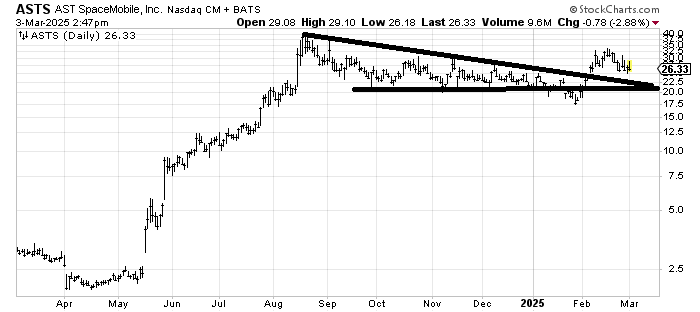
AST Space Mobile ASTS had a false breakdown so was that run up a false breakout? I would look for a bounce from support, but I would be inclined to think in the near term a rally in this fails. Why? It’s one of those so-called growth/hot stocks, and lately, they have not rallied well.
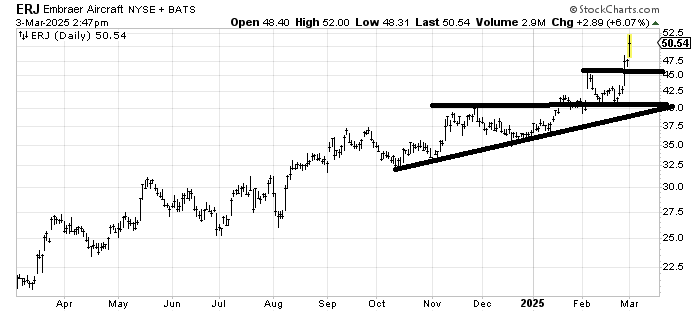
Embraer Aircraft ERJ hasn’t done anything wrong, but it is over-extended and has hit a measured target. I would get concerned if it trades under 40 but that is really far away. On a trading basis, this is vulnerable to profit-taking.
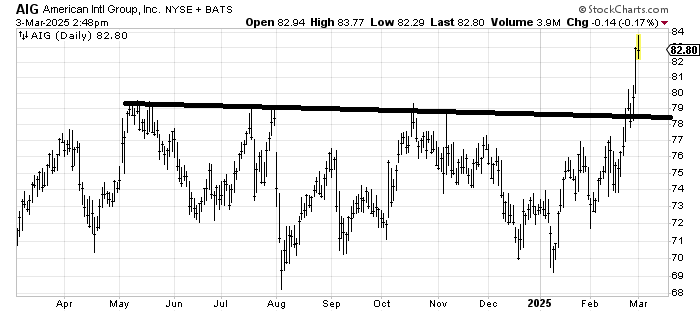
American International Group AIG had a nice breakout in late February. I can’t chase it, but it measures to the upper 80s. A pullback toward 78-ish ought to be buyable.