Early September Weirdness
The indicators are acting strangely, and doing so on the anniversary of prior weirdness.
You've reached your free article limit
You've read 0 of 1 free Pro articles.
The Market
In case you haven’t noticed, there are some weird things going on in the market lately. For starters, the fact that the indicators have barely budged in a month. Sure, the S&P is pretty much where it was a month ago, but often the S&P treads water, and the indicators move. But this time the indicators are treading water as well.
Now I have two new items to add. One is really wild, and I have no idea what it means, but I have to share it anyway! The put/call ratio for the VIX rarely gets out of what I would call the normal range of .20 to 1.0. And it rarely does so when the market is so flat as it is now. I suppose it would be common to see it low (under .20) when the market is so calm as folks prepare for more volatility (a low reading would imply folks are betting on a higher VIX).
Bearing in mind that my view is the VIX options traders are often correct because they tend to be traded by pros, I generally don’t consider them contrary, the way I might do so for the equity put/call ratio.
In any event, last Thursday the reading scooted up to 1.28, meaning on an up day, there was a lopsided bet the VIX would keep going down. The last three times we encountered readings so high the S&P went up for a day or two and then went plop.
But then came Friday with the S&P down, and sure it came back late in the day, but the VIX was red on the day. And the put/call ratio for the VIX? It swooned to .20. So, from an extreme high to an extreme low in 24 hours.
I went back five years and could only find one other example. Here’s the weird part: it was the exact same dates one year ago: September 5th and 6th. The market is in a very different place today than it was on those dates a year ago (the S&P had been correcting—about 5%--for the prior three weeks, which is not the case today).
I could rationalize this and say someone put on a very large trade that skewed these readings, but that would just be filed under the category of weird that the indicators haven’t budged for a month now.
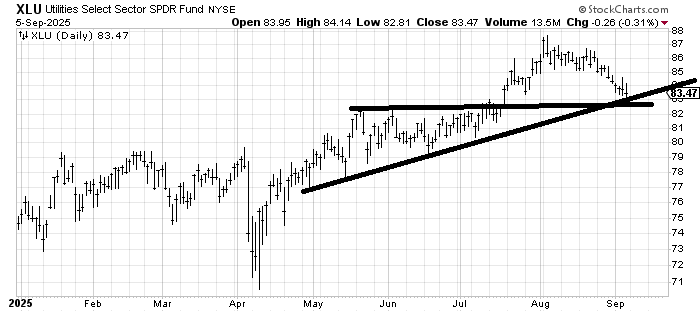
The other oddity is that bonds have rallied big time, and the Utes are down five percent. While they don’t tend to go hand in hand, it is also unusual that you get such a big move in interest rates and Utes not only ignore it but slide.
I think the group rotation has folks shaking their heads. Very few groups have managed a trend in the last two months. Even the banks, which had that great breakout two weeks and then, have done absolutely nothing. Only XME keeps on going. And the homies.
New Ideas
As noted above, the Utes are down five percent in the last five weeks. It’s probably why no one recommends them anymore! This 82-ish area is where I expect they will start to find support over the next few weeks. I think I am early; it will take some fits and starts for it to find footing.
Today’s Indicator
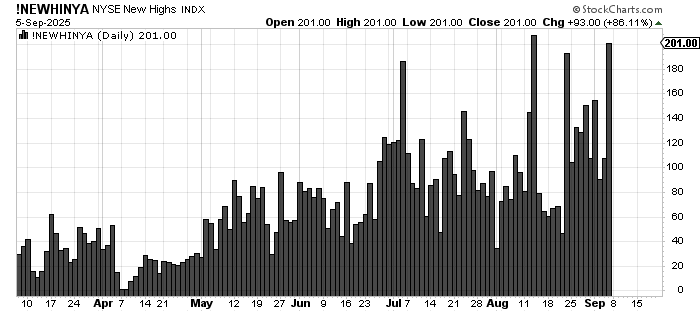
The new highs have increased but remain well below the reading from a month ago.
Q&A/Reader’s Feedback
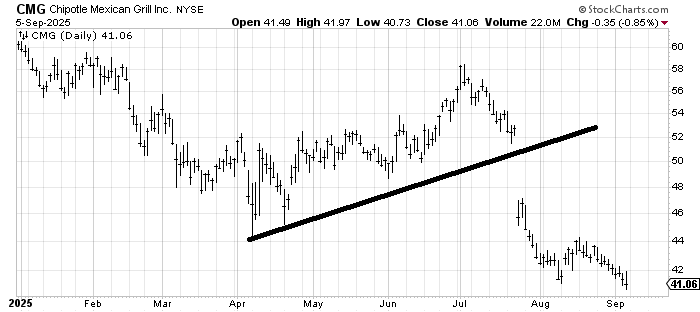
Chipotle Mexican Grille CMG has a measured target off that break of around 40-42, so it ought to find some support in the next few days and bounce. I would be careful about overstaying my welcome, though, because in about six weeks, we’ll get into tax-loss selling season, and this appears to be a good candidate for it.
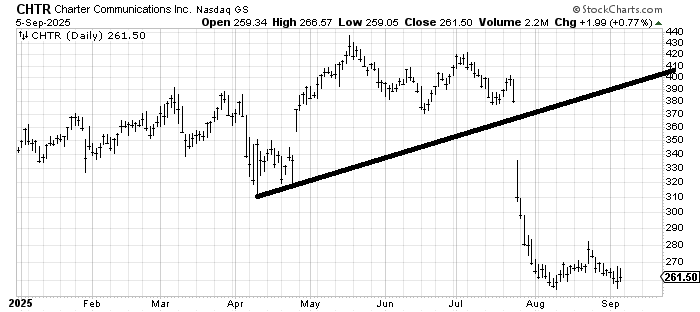
I would point out that Charter Communications CHTR has a similar look, and I would probably say the same thing about it: look for a bounce, but don’t fall in love because it is a candidate for tax loss selling as we get toward year-end. Both charts look like decent trades, but that’s it.
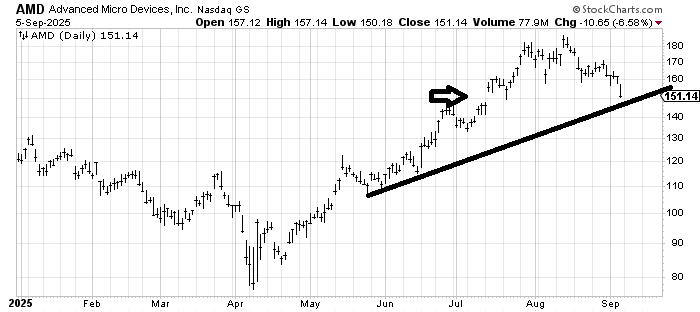
Advanced Micro Devices AMD hit its measured target when it got to 180, so I would need a new pattern to set up for me to like it again. However, in the very near term, it’s got support around 145 and a gap fill, so it ought to bounce from that area. The top it has just built is small and measures to 140. So if it can’t bounce from 145-ish, then I’d look for a bounce from 140-ish. If it can’t bounce until it gets to 140, then 160 resistance will loom large. I don’t love bottom fishing in it right now.
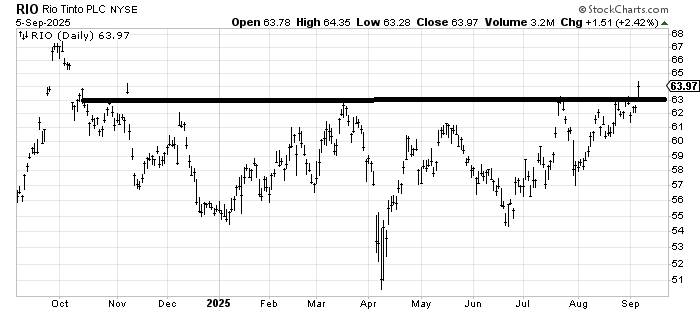
Rio Tinto RIO is a nice big base. It is also an ADR, so it trades very gappy, which means you could wake up tomorrow with the stock down several bucks. However, if you have patience for the gyrations, this is a good chart. I would like to see it stay over 60.
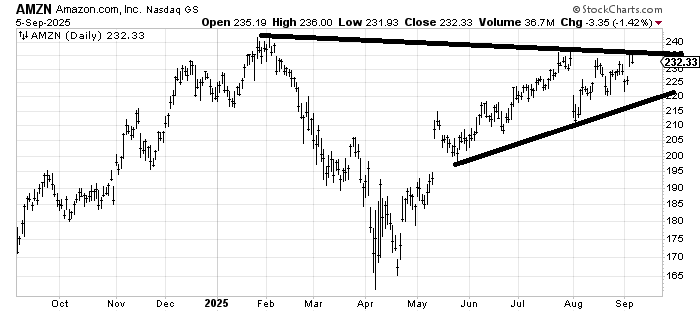
I had wanted Amazon AMZN to visit that uptrend line around 215 one more time after its earnings gap down, but it did not. Now there is the dilemma: do I anticipate a move up and over that downtrend line, or do I wait for the breakout over it? I am inclined to wait for the breakout just because so many charts are like this: the same place they were a month ago. See my comments on the banks above.
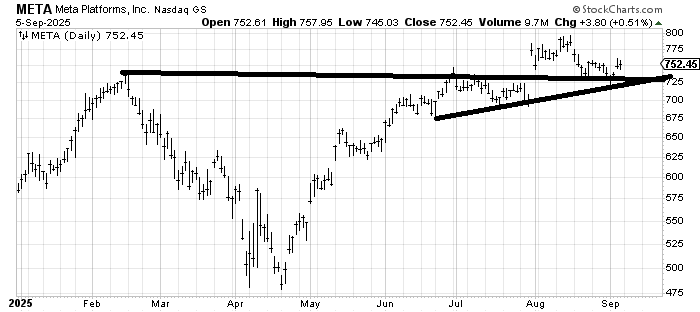
Meta META hasn’t done anything wrong yet. It broke out, had very little follow-through, and then tested the breakout. So as long as it stays over 725-ish, the chart is fine.