Don't Laugh But There Wasn't Much Buying on Today's Rally
Let's look at the breadth and volume statistics around recent trading.
You've reached your free article limit
You've read 0 of 1 free Pro articles.
The Market
Remember when I asked you last week not to laugh at me when I said there was very little selling in the market except for the index movers? Today, there was very little buying except for the index movers.
Oh, sure, breadth was positive, but Friday saw the S&P add a measly eight points with net breadth of +600. Today, the S&P added 103 points with net breadth of +990. Not exactly anything to write home about.
Or let me put it to you this way. Friday’s rally saw the NYSE with 69% of the volume on the upside. Today was 62%. And if you think Nasdaq was better, I’d say marginally. Friday saw Nasdaq down 50 points with up volume at 57%. Today saw Nasdaq tack on just over 520 points with 62% of the volume on the upside.
Basically, if the stock held up and/or rallied last week (see the Transports), then they did not participate today, or they participated but not well. It all goes back to that statistic I shared with you recently that the market cap of NVDA is now larger than the entire market cap of the Mid Cap 400 and the S&P Small Cap 600. If (NVDA) rallies it leaves very little room for other stuff to rally and vice versa.
The data still says we should have another rally later this week even if we come back down on Tuesday.
New Ideas
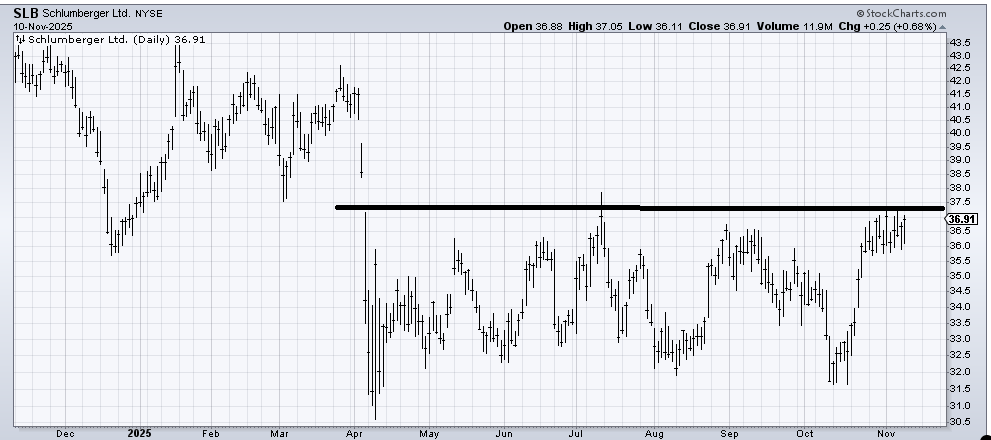
Schlumberger ( (SLB) ) continues to hold up well, but it hasn’t done much in the last two weeks. If the others (493) can get going, this should at least try and fill that gap above.
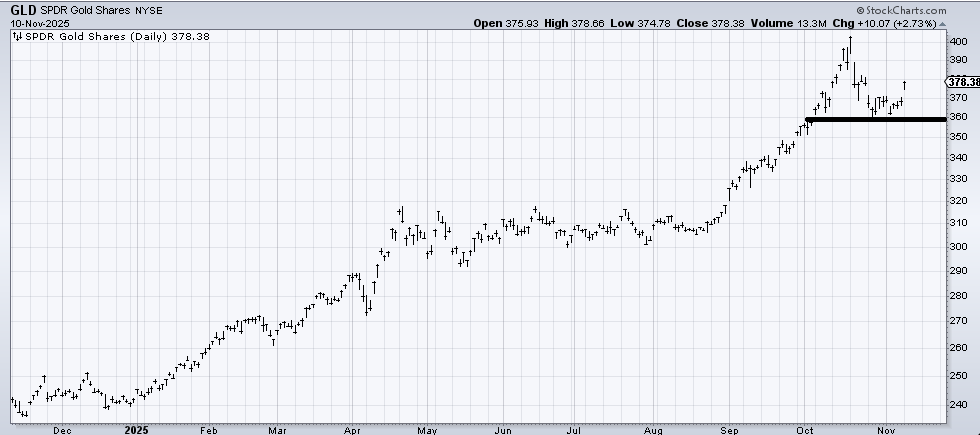
A couple of weeks ago, when (GLD) was at 360, I said I was willing to take a stab at it for a trade. It’s taken two weeks, but it finally got going. If it can’t get over 380, then I’d say it is likely to go into a sideways pattern as it did beginning in April.
Today’s Indicator
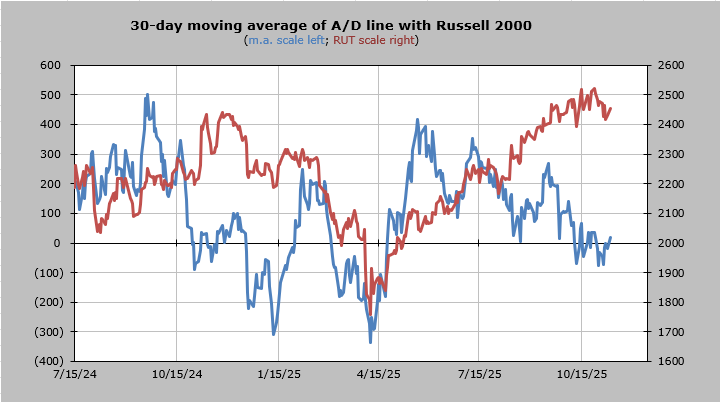
The 30-day moving average of the advance/decline line is a tiny bit oversold. It will go back to overbought by Thanksgiving.
Q&A/Reader’s Feedback
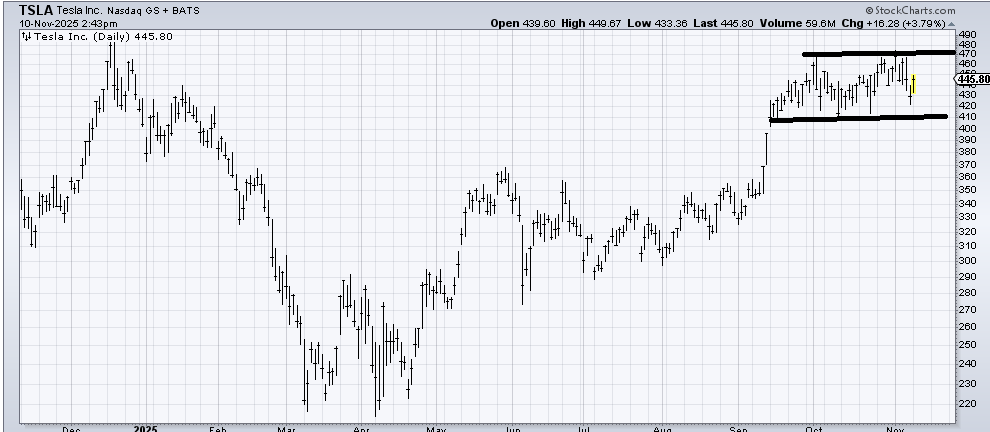
Tesla (TSLA) is trapped between 410 and 470, and I know we ought to lean upward, but with other stocks to trade, this one feels like a draw, as if it can continue to just go sideways for now.
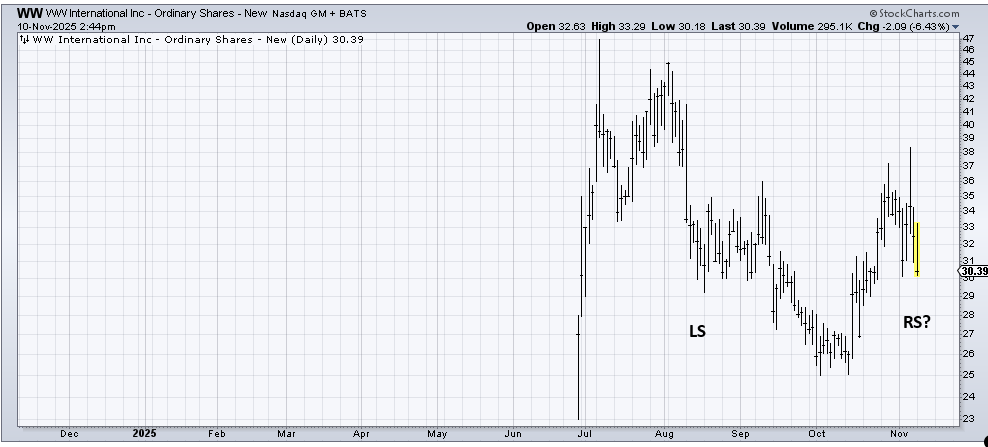
The head and shoulders fan in me sees the potential for that pattern in WW (WW) and wants to like it. Here’s the problem: this stock is a serial disappointer. If it can hold 30, then it has a shot, but mostly every rally has failed—even before it changed its name and started anew.
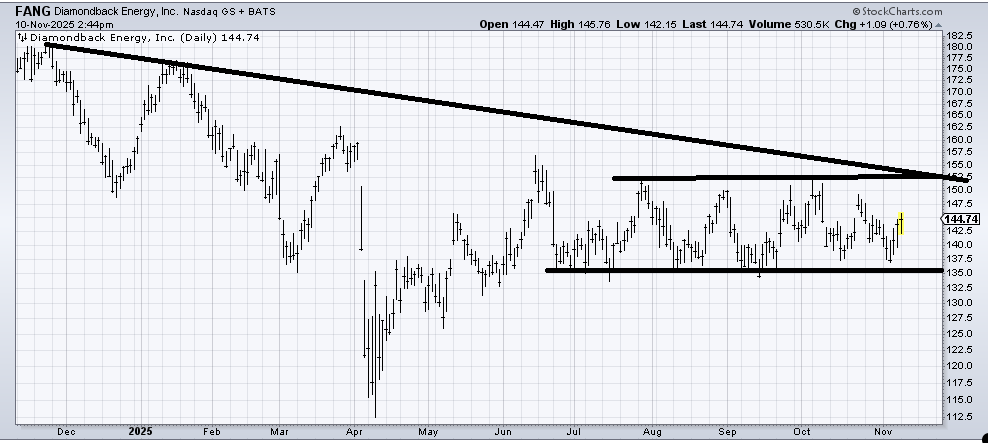
Diamondback Energy (FANG) is my kind of chart because it looks like a base. I know oil stocks—the OG for the energy trade!—are big disappointers because they go nowhere, but the chart says as long as it stays over 135, you have to think this is a base, especially if the breakout can come about a month or so from now (then it would cross over the flat line and the downtrend line at the same time)
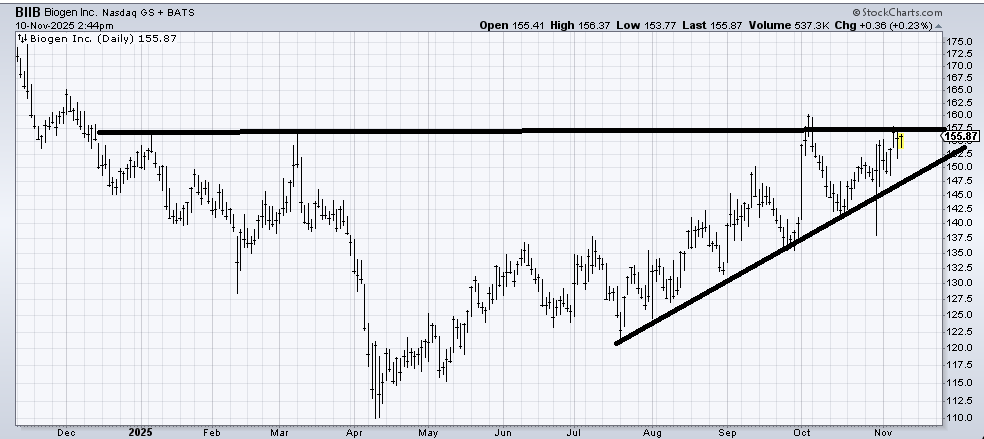
Every time I have looked for Biogen (BIIB) to break out, it has managed to pop and drop. Yet look at that base. It’s big, and the breakout is close by. I’d use a stop under that uptrend line.
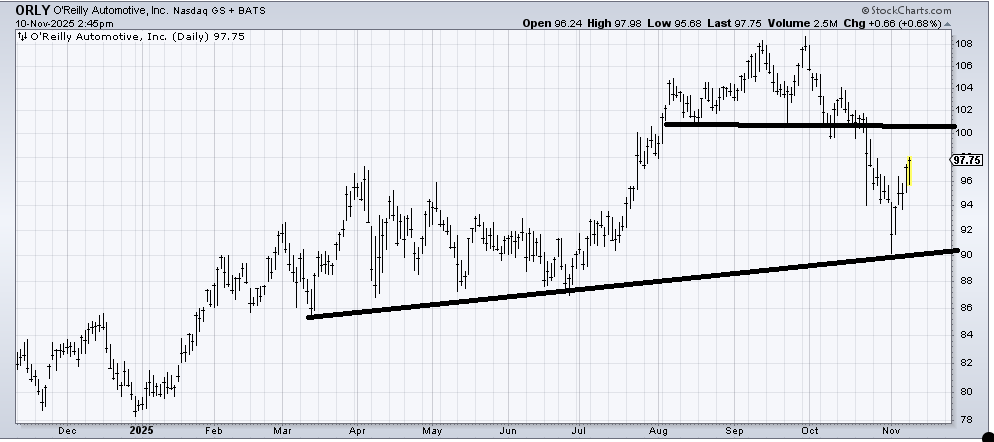
The good news is Oreilly Auto (ORLY) met its downside target when it bounced off of 90 a week ago. The bad news is that the resistance at 100-ish will probably matter on this first trip up here. So for now, I’ll say it’s trapped between 90 and 100.
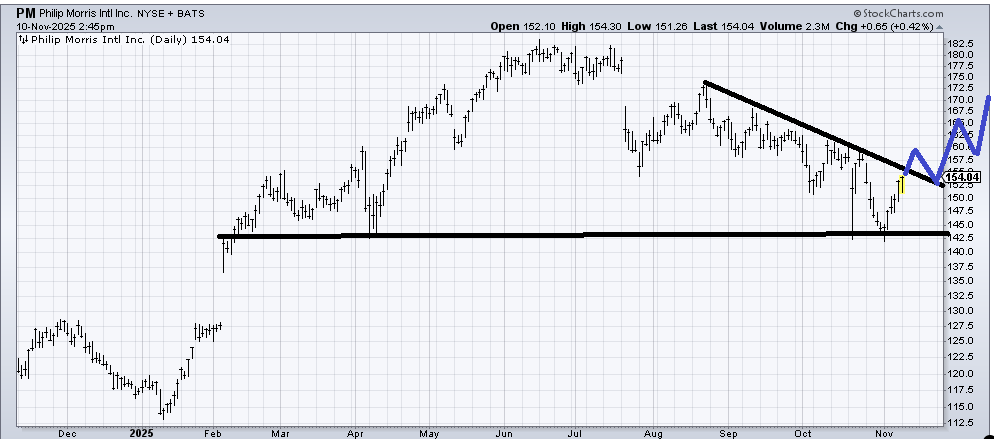
Philip Morris (PM) has been green for about six straight days now, so by the time it gets to/crosses over that downtrend line, it will be short-term overbought. And into a lot of resistance. However, if it can start mapping out as I have drawn in blue, it improves, although I would expect the improvement to be slow.
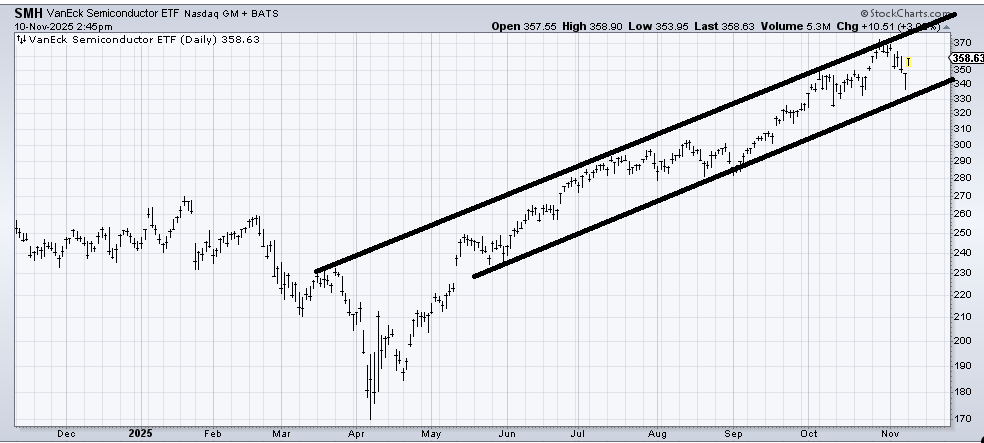
My view on the semis or SMH has not changed. It has been riding this channel since April/May, and I don’t expect it to change until it either can’t make it to either the top or bottom line. Failure to get to/near a line would signal a change is likely.
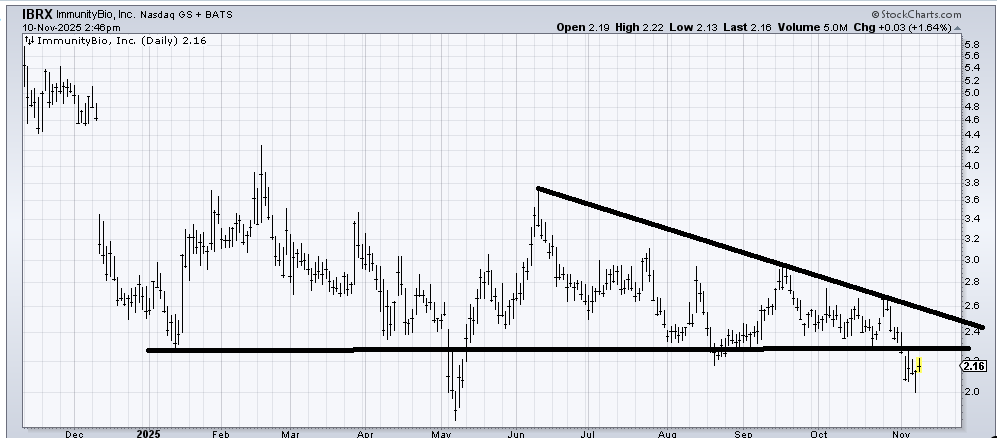
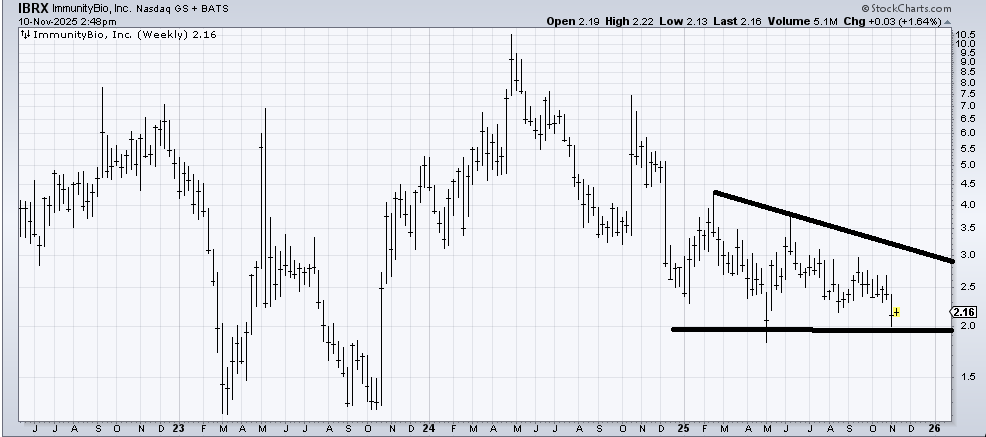
When I see a chart (daily) like Immunity Bio (IBRX) that has been trading in the same range for nearly a year, my first instinct is to look at the weekly chart. So let me begin with the daily: unless this chart can get back up over 2.25 in a hurry, the recent action is not bullish.
The weekly chart, sadly, gives no clues. The stock lacks life, and every time it has tried to rally in the last 18 months, it has made a lower high. Unless/until that changes, it’s hard to get excited about its prospects.
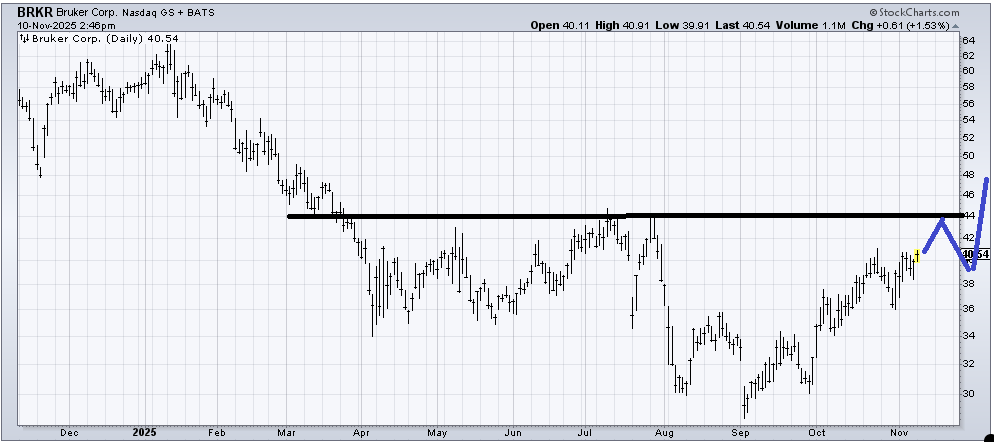
Bruker (BRKR) is an interesting chart to me because there is a potential base in the works. If it starts to map out something akin to what I have drawn in blue over the coming weeks/months, I would want to take a look at it again, with the chance that it might be a 2026 story.
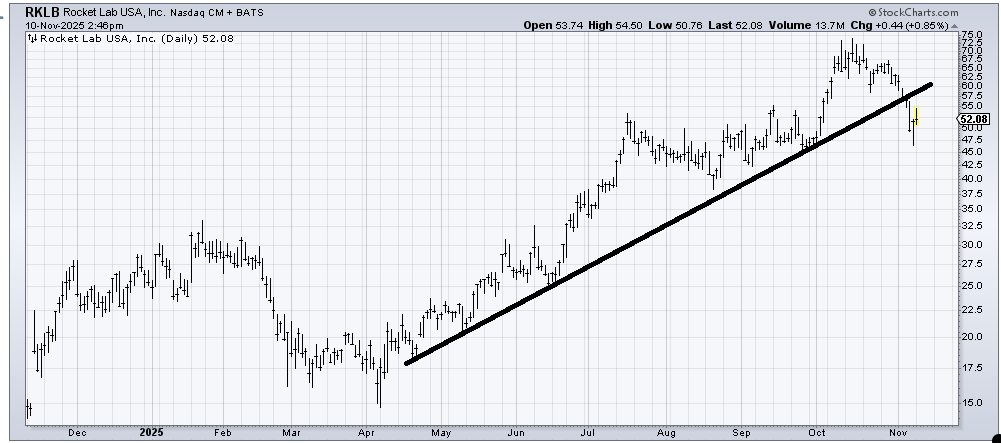
I actually recommended Rocket Lab (RKLB) months ago, and the measured target was the mid-60s. Now it has broken the uptrend line, so if it can get back into that 60-63 area, I’d probably be a seller. There is a chance it now just goes sideways for a while, but it will have to prove that to me.
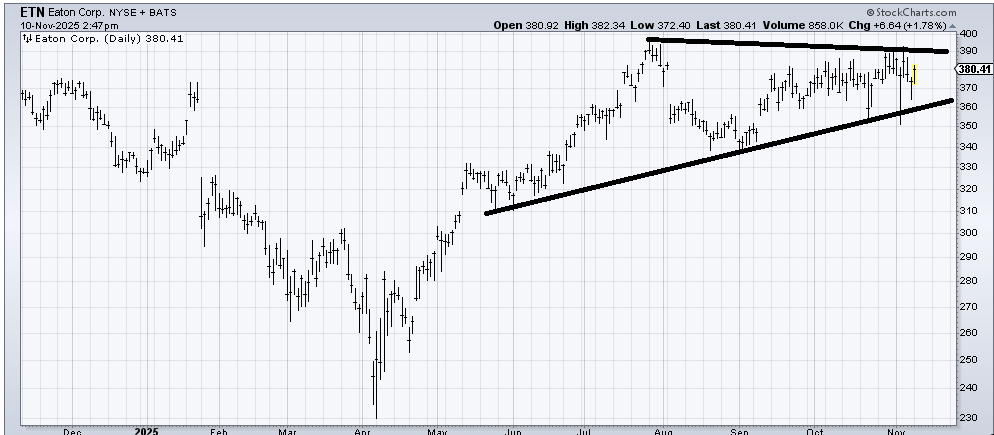
Eaton (ETN) is another chart that peaked last summer and has been correcting for months. For now, I am going to call it trapped between 350 and 390, and I would respect a break in either direction. What keeps me interested on the long side is the low that was made in September. What keeps me from jumping in with both feet (on the upside) is that it has plunged three times in the last three weeks. Spike lows tend to hold the first trip down. The next ones are not as clear.
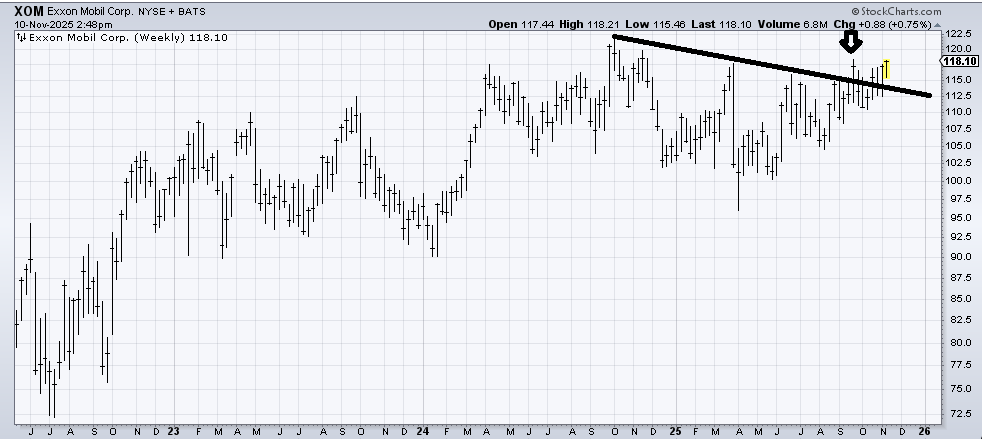
I am going to use the weekly chart of Exxon (XOM) because I want to show you (arrow) when I got excited that the stock could actually finally break out. And you can see how wrong I was. Now we are back to this same spot, and I want to give it a chance to finally get going again. If it trades back under 112, I am wrong (again).