Does Breadth Signal a Change?
Stock picking and group rotation are still the lead themes of the market, but underneath, things may be happening.
You've reached your free article limit
You've read 0 of 1 free Pro articles.
The Market
The market has changed in the last week or so. I have been saying that it is about stock picking and group rotation. While that is still the case, the picking has become much more concentrated.
In the last ten trading days, the breadth on the NYSE has been lackluster most days, even on the up days. For example, Thursday’s big up day, when the Russell was up two percent, net breadth on the NYSE was +830. For those not steeped in the minutia of breadth, that’s actually pretty poor breadth for a day the small caps are up two percent.
I would typically expect at least a ‘quadruple digit’ reading and likely something much closer to +2000 on such a day. Maybe it’s easier to understand when we consider that upside volume was 65% of total volume. It's not great, but breadth, in general, hasn’t been spectacular, but rather just generally moving up, so mostly I shrugged, thinking more of the same.
But then I look at Nasdaq on the same day, and we find that upside volume was at 74%. Not bad, not great. Okay, more in line with the general expectations of what we’ve seen lately.
But Friday was much more glaring with the NYSE showing negative breadth—bear with me here because I’m going to throw out a lot of numbers. Net breadth on Thursday on the NYSE was +830. Friday it was -860. So while the Russell is up 40 points in those two days, net breadth is flat. Now THAT is unusual.
Nasdaq, again, is not the same, but it turns out that upside volume on Nasdaq on Friday was 54%, just better than even.
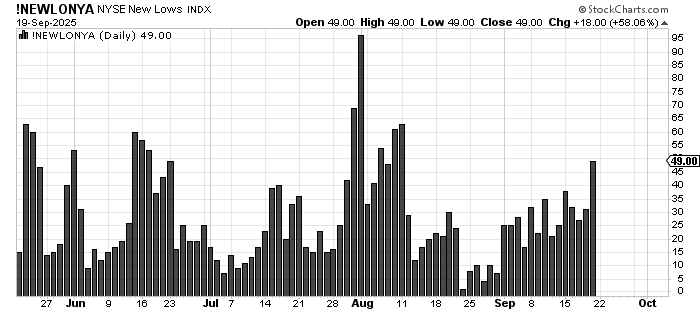
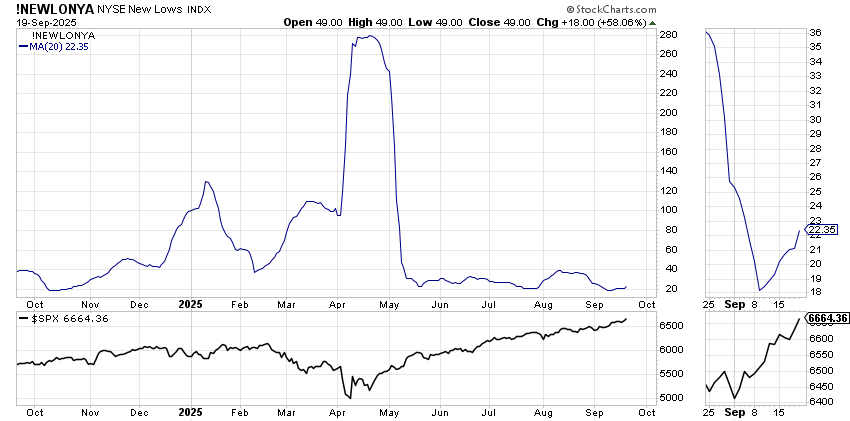
On Friday, the NYSE saw 49 stocks making new lows, which you can see is the most since early August when the S&P nearly two hundred points lower. And what’s more: that’s double what the reading was on Wednesday! Down below, you can see that the 20-day moving average of new lows has been rising for the last two weeks, yet the S&P is up 250 points in that same time.
Nasdaq doesn’t have the same poor statistics, but that is likely because that’s where the quantum, crypto, and AI stocks are. It’s just that two weeks ago, the homies were rallying, now they are not. Two weeks ago, we didn’t have so many restaurants collapsing; now we do. Even the semis have become quite mixed.
And yet Friday saw the equity put/call ratio at .45, the lowest reading since May. Perhaps much of this was related to the triple witching expiration we saw last Friday, but I still think we could use a pullback, and not just the type we saw from the Russell on Friday.
New Ideas
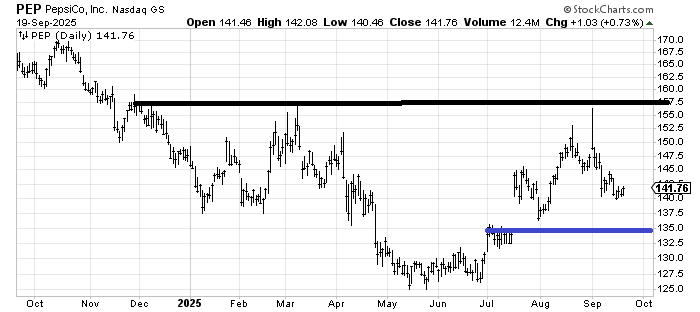
We looked at Pepsi PEP in the Feedback section about a week ago, and yet the questions keep pouring in. I think Pepsi is making a bottom, let’s call it a potential head and shoulders bottom. My only question is if it needs one more whack into that 135-137 area. Somewhere in this area, it looks okay to me.
Today’s Indicator
The new highs and new lows are discussed above.
Q&A/Reader’s Feedback
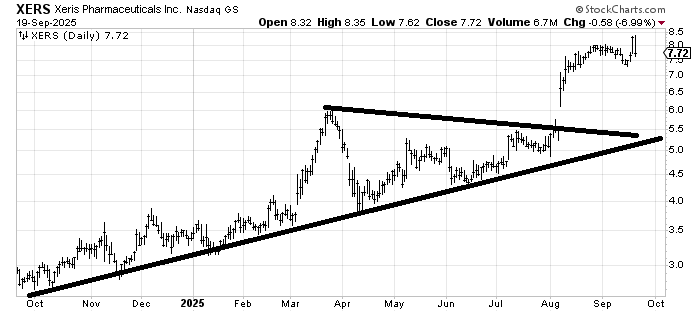
Xeris Pharmaceuticals XERS had a measured target around 8, and it has achieved it. Now it would be good if it can develop another pattern. If it slips much under 7, I think the pull toward closing the gap just under 6 gets greater so ideally it will need to just churn up here because right now it looks to me like it’s gone too far and is over-extended.
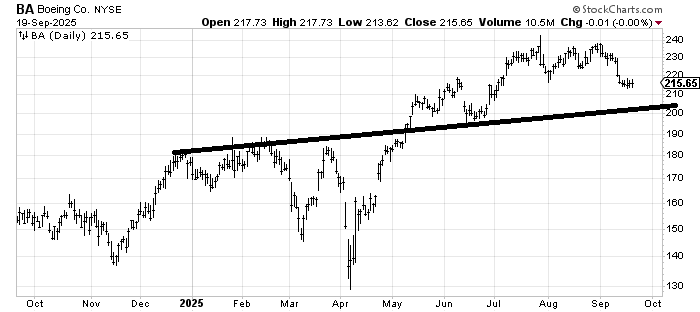
I had a measured target of 248-250 on Boeing BA, and it pretty much achieved that in July. I have been waiting for it to revisit that line, which is 202 currently but rising as time goes on, and it has so far refused to do so. So I would take another look at it down there.
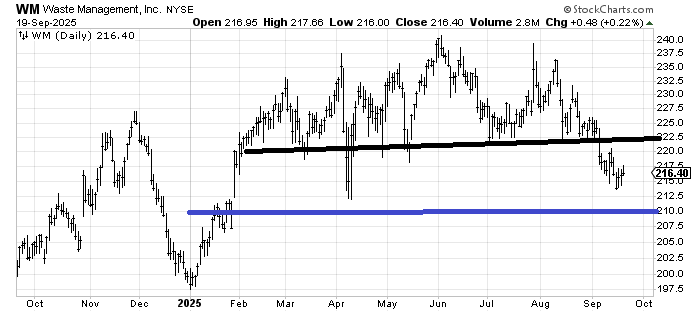
Waste Management WM has broken down from a top, but curiously, as large as that top is, it only measures into that 210-ish area, so I would love to see a whoosh down into that 210-212 area. It might turn out to be a good year-end stock.
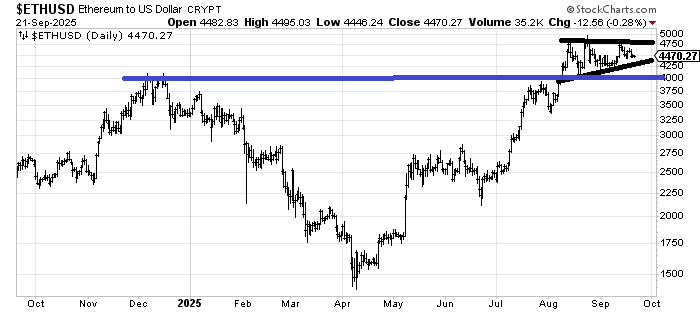
I feel as though I need to preface my comments on anything crypto by saying I see them only as trading vehicles, so it is hard for me to get behind. When it comes to Ethereum, this looks like a flag, and as long as it stays over 4000, that’s what I would consider it. So, it really needs to get up and over 4750 to do another leg higher.
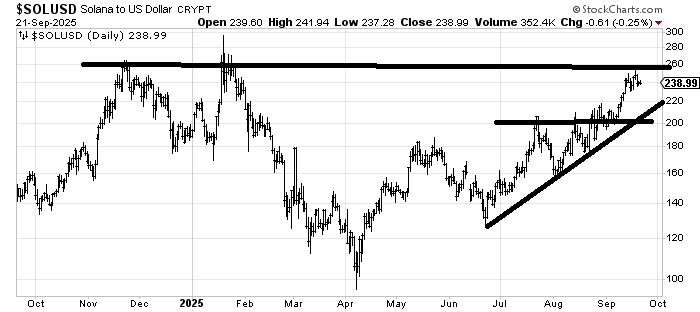
Solana has not even made it over the 2025 high yet and looks to me as if it would like to test support back near 200, or even the line near 220.
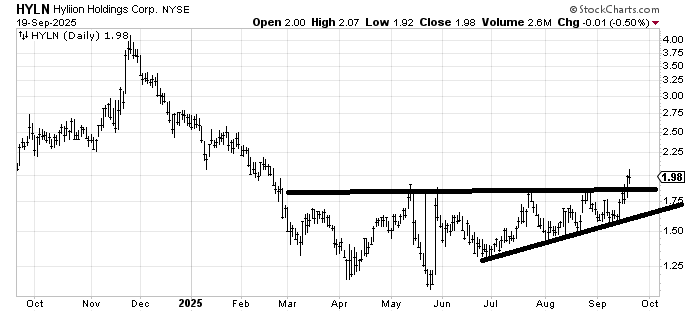
Hylion (HYLN) is a developing base, so I like it. The numbers are so small because it is a one-dollar stock, that I can’t really give a target. I would say that you don’t want to see it back under 1.50.
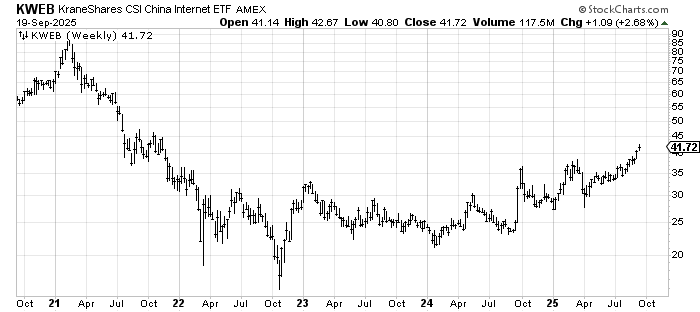
I have been a fan of KWEB for a while (see my BIDU recommendation a few weeks ago), mostly because of this very long base we see. This is a five-year weekly chart. In the near term, there is resistance not far overhead at just shy of 45. A correction back into the upper 30s would be helpful, or even some sideways action. Remember, this is a weekly chart, so it takes much longer for it to play out. I think it does eventually get over that mid-40s resistance, but it’s hard to chase it for me right now.