Do You Feel Like You've Seen This Market Action Before?
This market is reminding me of a certain Bill Murray movie. Let's examine the continuing pattern, sentiment, earnings reactions, meme-mania, the VIX, a parabolic Joby and much more.
You've reached your free article limit
You've read 0 of 1 free Pro articles.
The Market
This is becoming like the Groundhog Day Market. Every day the S&P 500 creeps up a little bit and every day the indicators stay the same.
Oh sure, breadth was terrible Thursday, but that means the McClellan Summation Index is still heading down. Remember, it needs good breadth to turn back up and it has had mediocre breadth.
And the number of stocks making new highs? Still under the levels we saw on July 3. So no change in the high and lows or the Hi-Lo Indicator.
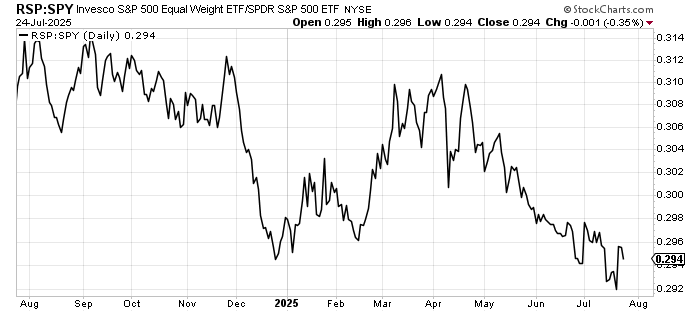
The SOX was up Thursday but not as much as the Nasdaq so here, too, that ratio heads down. And remember the excitement over the Invesco S&P 500 Equal Weight ETF RSP? Well, that did poorly vs. the S&P so once again, that is looking like a one-day wonder.
Sentiment? The AAII bulls were down fractionally. The bears were down 5. But the bears jumped into the neutral camp. There are still more bulls than bears. NAAIM’s exposure moved down to 81. Last week it was 83. I can’t even call that a change.
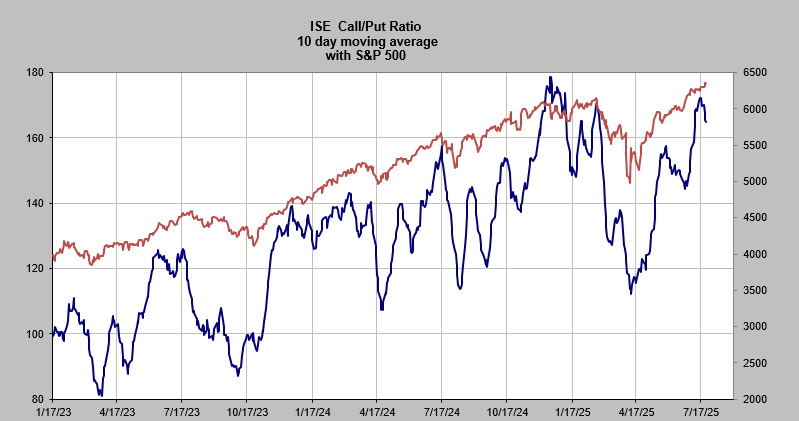
The put/call ratio? It has been so steady, hovering in the 80s, that the 10-day moving average barely budges. The ISE call/put ratio’s 10-day moving average has, however, turned down, from a very high level. The chart is shown below.
Surely the DSI has changed, right? Nope. Nasdaq’s DSI is 81 while the S&P’s is now down to 74. The VIX, however, is still at 15 so the VIX is a problem.
Penny stock and meme trading? One penny stock accounted for three billion (so about 25%) of the Nasdaq’s volume Thursday. Meme-mania died down a smidge.
Mostly I view sentiment as complacent. We’re at the point where most don’t even think the market can come down. While last week we saw several gaps up from earnings (PepsiCo PEP, Johnson & Johnson JNJ come to mind), this week we’re seeing gaps down. Chipotle CMG, Texas Instruments TXN, Dow Inc. DOW, General Motors GM, Honeywell HON, IBM IBM, Tesla TSLA, etc.
I keep thinking we’ll get a proper correction and the market keeps proving me wrong.
New Ideas
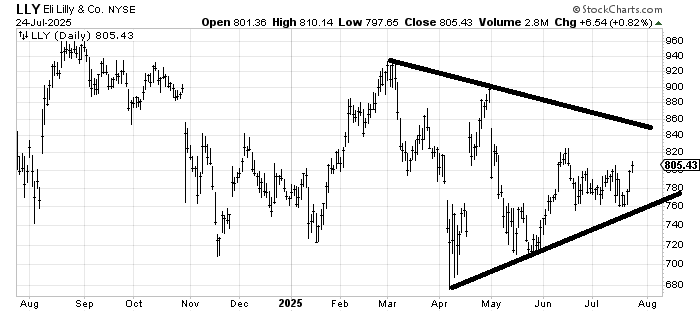
We should all know by now I am still a fan of healthcare stocks. They have been a bit sporadic in how they have done, but I was asked about Eli Lilly LLY.
I don’t have a short-term view on the stock being that there is resistance just overhead at $820, but the chart has formed a big triangle in 2025 so I like LLY as long as it stays over $760-ish. It feels as if it is trying to base. Earnings are out August 7.
Today’s Indicator
The 10-day moving average of the ISE call/put ratio is discussed above.
Q&A/Reader’s Feedback
Helene welcomes your questions about Top Stocks and her charting strategy and techniques. Please send an email directly to Helene with your questions. However, please remember that TheStreet.com Top Stocks is not intended to provide personalized investment advice. Email Helene here.
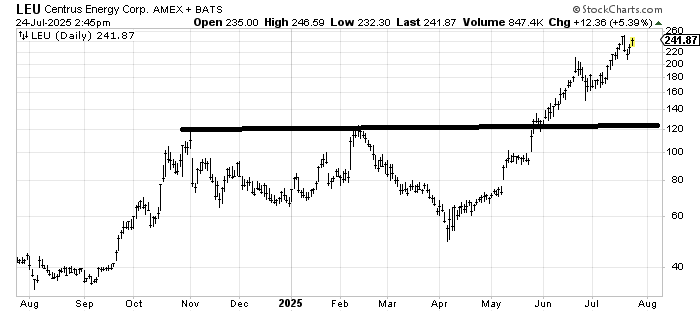
Centrus Energy LEU has a next measured target right here in the $240-250 area.
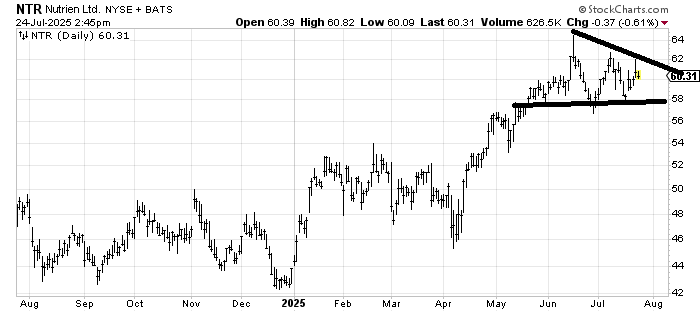
In the near term I think Nutrien Ltd. NTR is a coin flip. You can see the triangle pattern on the one-year chart. You might recall I have liked this chart for quite some time with that big base. The initial target was around $62-ish.
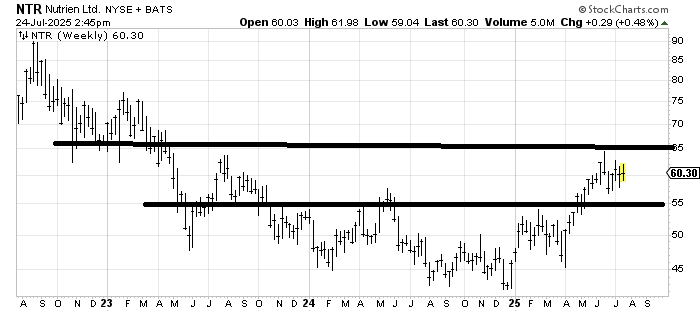
But look at the NTR three-year weekly chart. While there is resistance all the way up, that is a base, so as long as the stock doesn’t crack much under $55 I am willing to wait while it continues to develop and then hopefully get up and over $65.
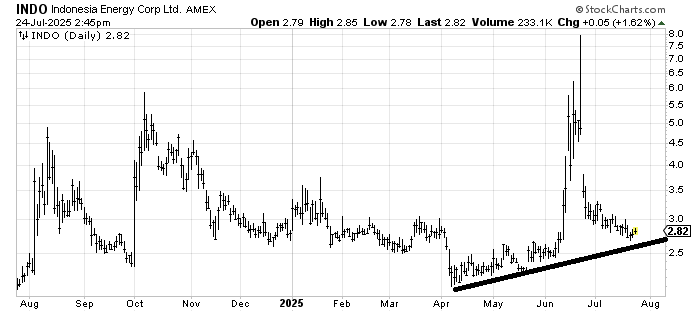
Oftentimes stocks that surge and give much of it back need a long time to rebuild. Indonesia Energy INDO had a big spurt in October last year, gave it up and then spent the next nine months chugging along. I don’t know how long it will take INDO to rebuild but the action looks similar.
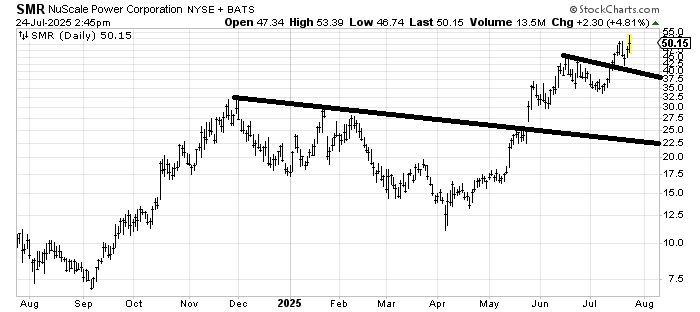
NuScale Power SMR has a next target in this $50-52 area. It hasn’t done anything wrong.
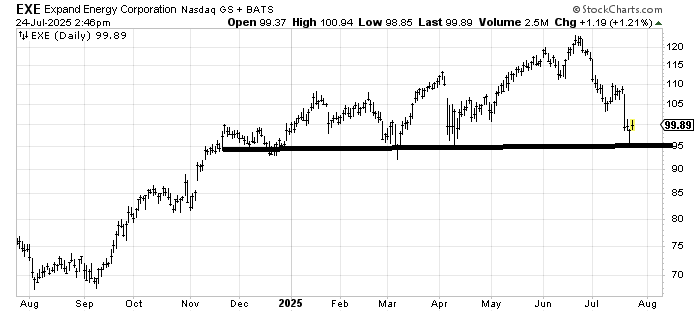
In any other market I would say Expand Energy (EXE) looks like a top and that a rally to $105-110 would be a great place to sell it. In this market the $95 area is probably where you buy it with a stop under there.
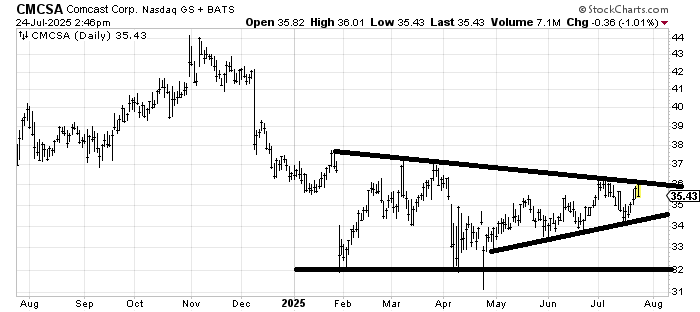
Comcast CMCSA is an interesting chart because it hasn’t gone anywhere all year. It’s been making higher lows since May but no higher highs. Crossing $36-ish would change that. I am positively disposed on this one although they tell me cable TV is dead!
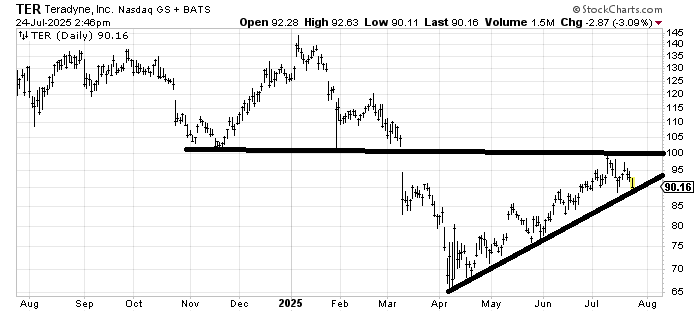
I don’t love the chart of Teredyne TER because it had a hard time filling that gap from March and then gave it up immediately. The chart says this is where you buy it (at the uptrend line) but I think this line breaks and the chart does a bit more work down here. If it breaks and holds $85 I might get interested again so ping me if it does that.
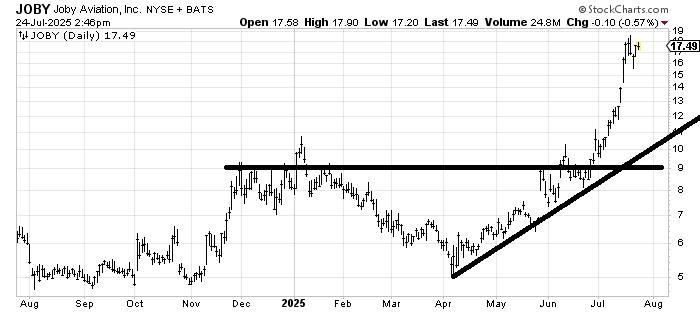
From my vantage point I would call Joby Aviation JOBY a hold because it hasn’t done anything wrong yet, but I cannot buy a stock that has gone parabolic like this one has (doubling in the last three weeks). It seems vulnerable to a correction.