Digesting the Rally or a Distribution Top? A Mid-Vacation Market Update.
Helene Meisler takes a brief pause from her vacation to share thoughts on the indicators.
You've reached your free article limit
You've read 0 of 1 free Pro articles.
The Market
Note: I am still on vacation, so the next edition of Top Stocks will be next weekend, June 28th. I will resume your stock requests then. Thanks for understanding!
Well, we got volatility. It lasted exactly one day. Then the market went to sleep. In fact, sometimes it is good to step back and take a look instead of watching the market daily. Here’s what I see: the S&P is flat in the last month.
On May 19th the S&P closed at 5963, and Friday it closed at 5967. You may recall the market got intermediate-term overbought not long after that, and ever since, we have been sloshing around. The bulls would say we’re digesting the rally, and the bears will say, but we can’t make any progress, we’re distributing. I say let’s go to the indicators.
In this last month, the sentiment has shifted to a more bullish stance than it was before. Long-time readers will know that my view is that the bulls and bears are like neighbors with a fence between. They rarely jump the fence quickly, but rather they mosey to it and slowly crawl over it. This time is a prime example.
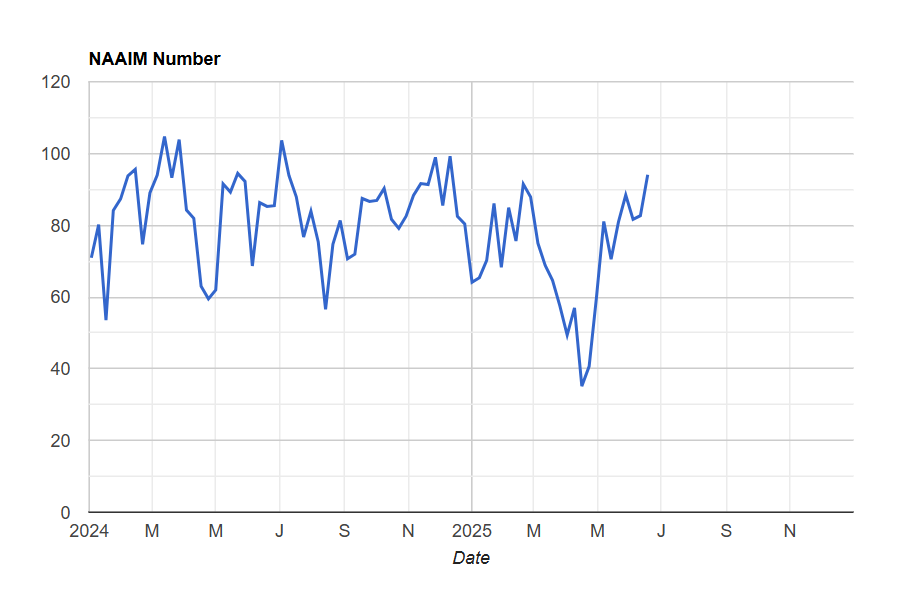
Notice how the NAAIM Exposure was 70 in mid-May and now it is 94
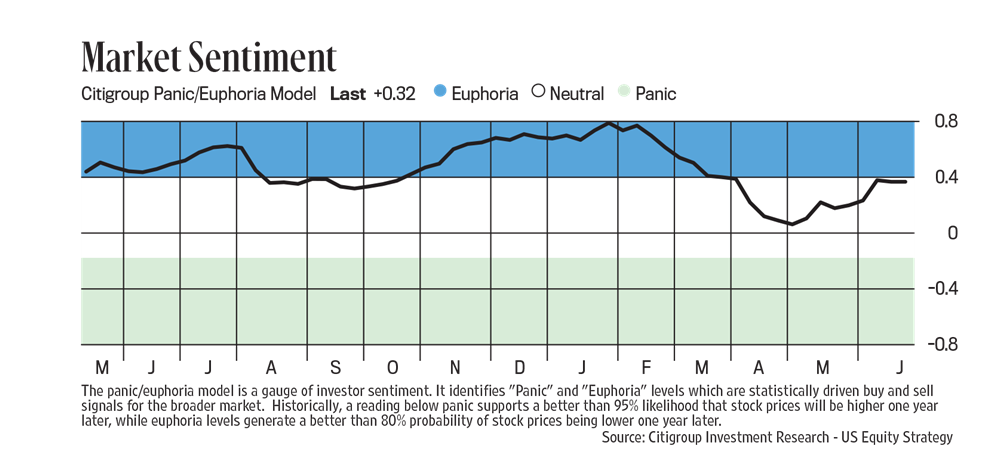
Notice how the Citi Panic/Euphoria Model was midway between zero and Euphoria in mid-May? Now it is kissing Euphoria.
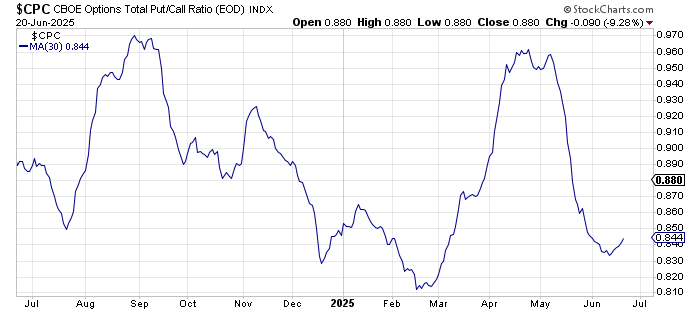
Notice how the 30-day moving average of the put/call ratio was .90 in mid-May and now it has just bounced off .83?
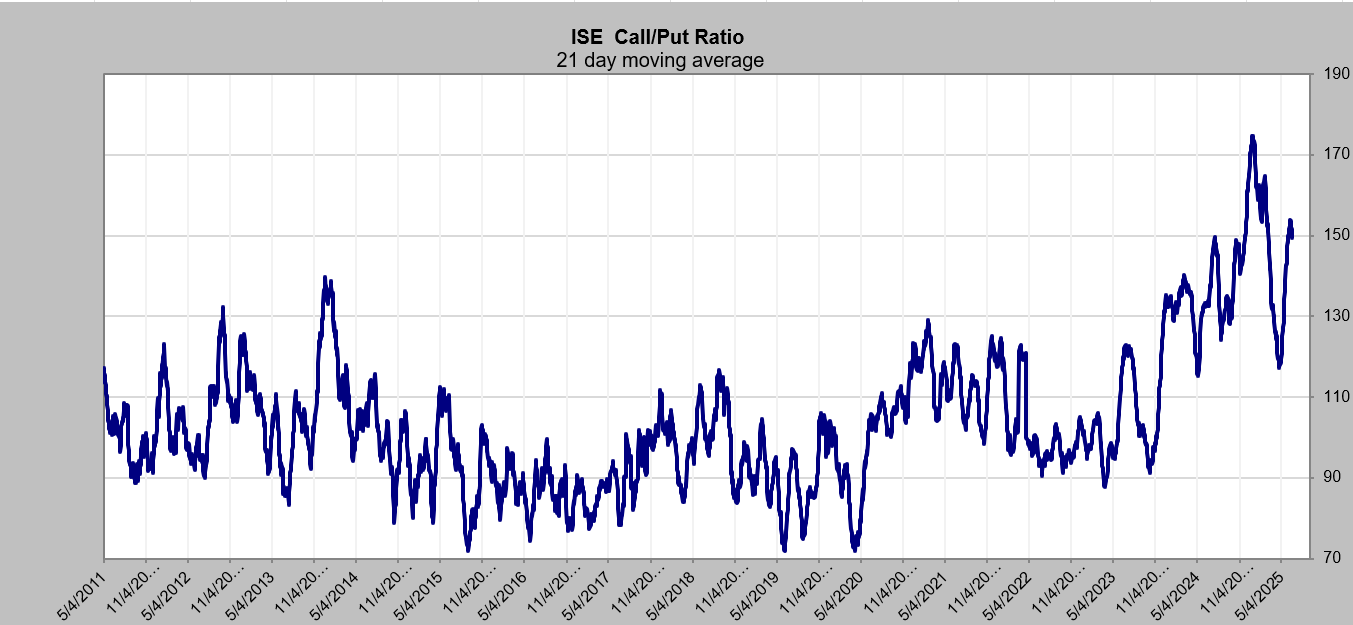
Notice how the 21-day moving average of the ISE Call/Put Ratio was still rising in mid-May and now it is heading down again.
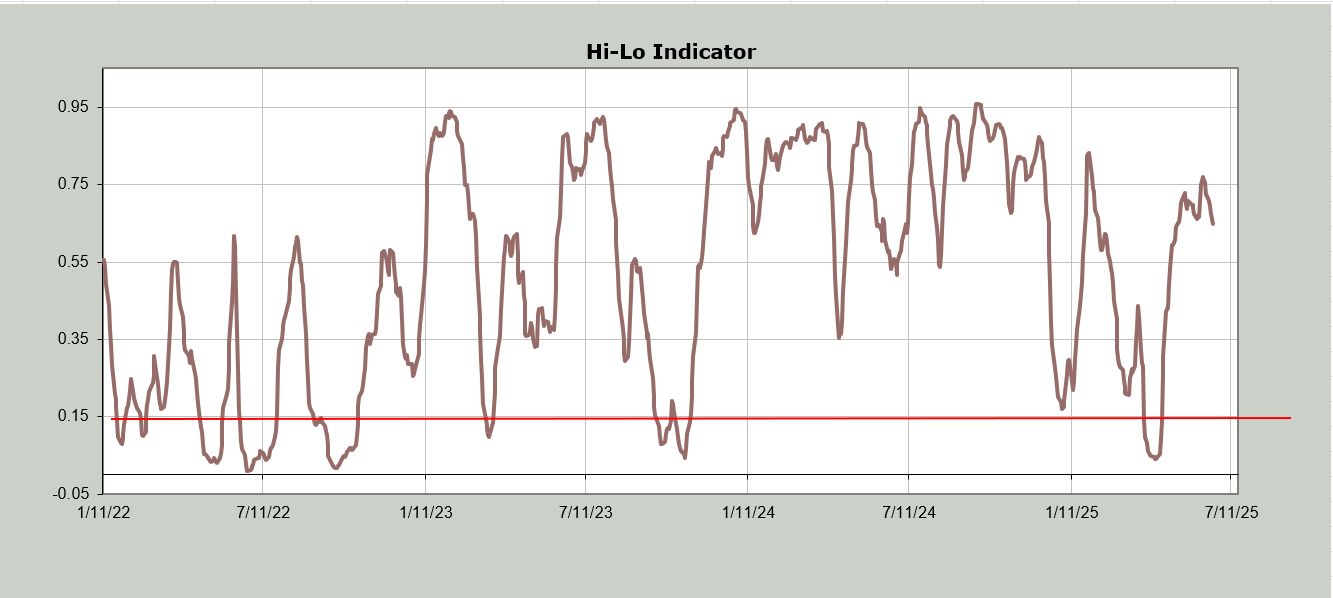
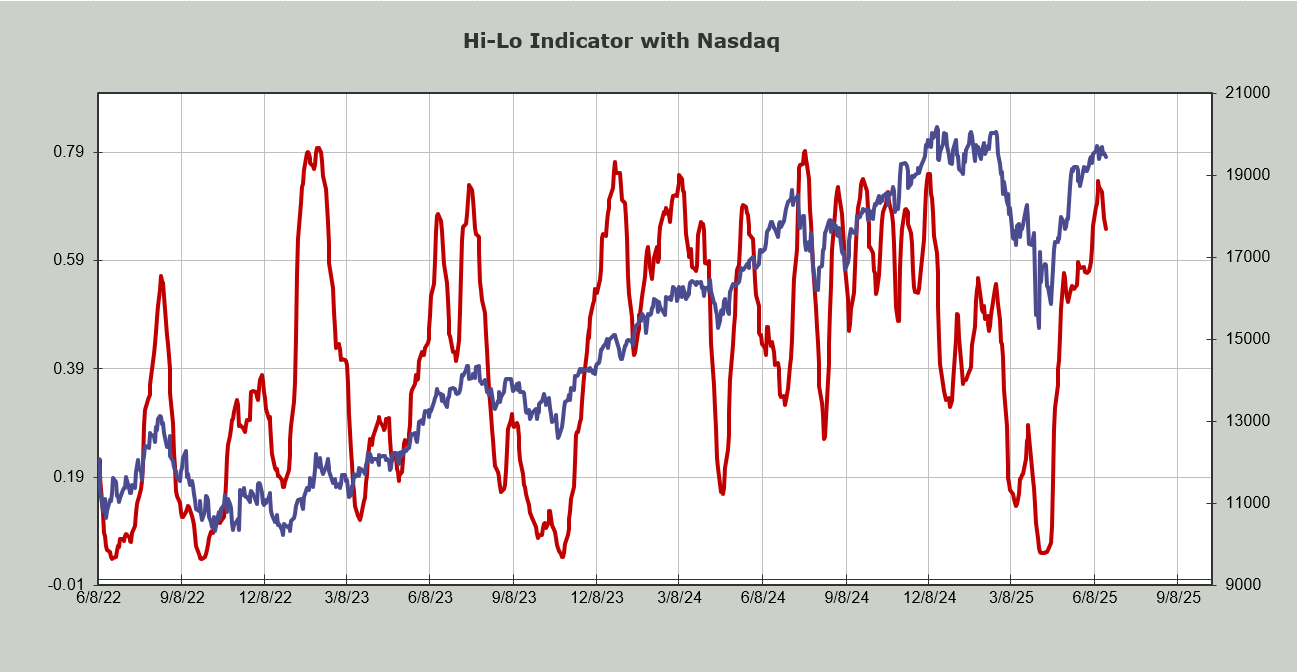
But it also takes time for the daily statistics to digest and catch up. For example, the new highs have not been able to increase in weeks and remain rather pathetic. The good news is that the new lows are not expanding either. Yet now, the Hi-Lo Indicators for both the NYSE and Nasdaq are heading down, and you don’t even need to squint to see it.
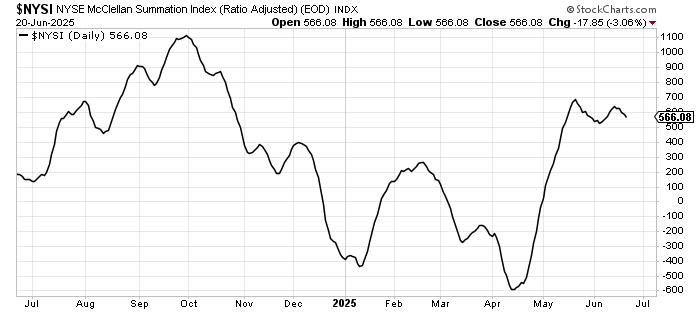
The McClellan Summation Index peaked in mid-May, tried to rally again, and now it, too, is heading down. It needs a net differential of +1100 advancers minus decliners on the NYSE to stop the decline.
I know you see it and feel it in your own portfolios. They don’t go up; they don’t go down. They leak a bit. For example, everyone got so excited when the Russell (IWM) broke that neckline of the head and shoulders bottom. But it got to that 215 resistance I have been highlighting and died. But now, on the retreat to the neckline, it just keeps knocking on it, but not breaking.
In fact, this is an interesting juncture for the IWM. The 208-210 area is the neckline (support) and where the uptrend line comes in. A break of that area would be important and might just switch sentiment from this now too bullish stance.
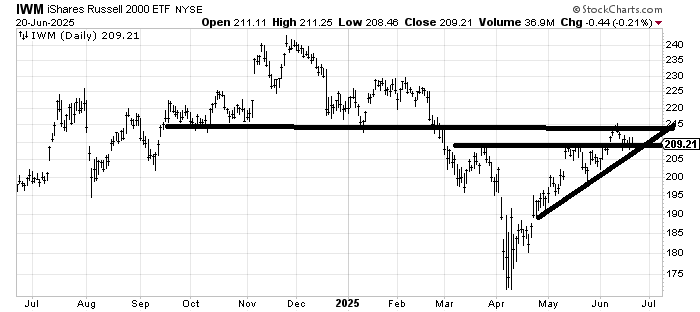
I don’t know what happens in the next week or so, but my guess is that line on the IWM will break at some point, and it will do so enough to get a sentiment shift. If it breaks this week, it would probably set us up for an oversold rally into July 4th.
New Ideas
When I left a week ago, I asked that you watch a group of 6 stocks to see if they break because they had been weakened. Not one of them broke. Noteworthy that the consumer-facing ones did not break in the face of that retail sales number. I still have them on my watch list.
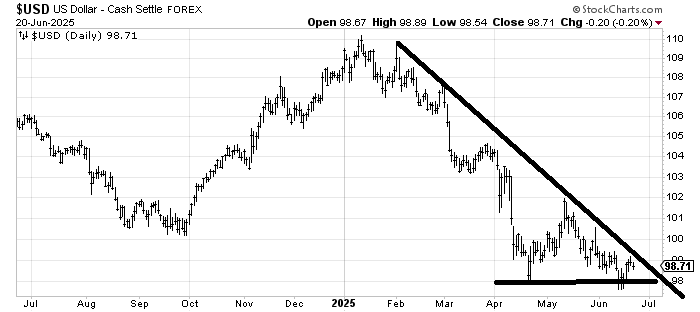
I am once again going to note that I think there is too much negativity against the US Dollar, and at some point, that downtrend line will be broken.
Today’s indicator
The Hi-Lo Indicator is discussed above.
Q&A/Reader’s Feedback
I will resume reviewing your chart requests next week.
