Did You Notice The Closing Price Action This Week? That's Chop.
It's a choppy market. That's just where we're at.
You've reached your free article limit
You've read 0 of 1 free Pro articles.
The Market
There aren’t very many stocks that have done very much this week. The ones that rallied well last week did a lot of churning this week (see the banks). Then there is technology, which did rally this week.
But off the lows, I did say tech and semis are where to go for a rally. Why? It’s always where folks go for exposure to the market. And weren’t those stocks hit the most? But what about now?
Now, Nasdaq’s Momentum Indicator is overbought, or will be tomorrow. What I do here is walk price up six hundred points over the next several days. What I am trying to ascertain is what happens to momentum if price keeps rising. The reason I do this is because if price keeps going and momentum rolls over, it means it’s overbought. The wind is no longer at its back. You can see on the chart the Momentum Indicator rolls over.
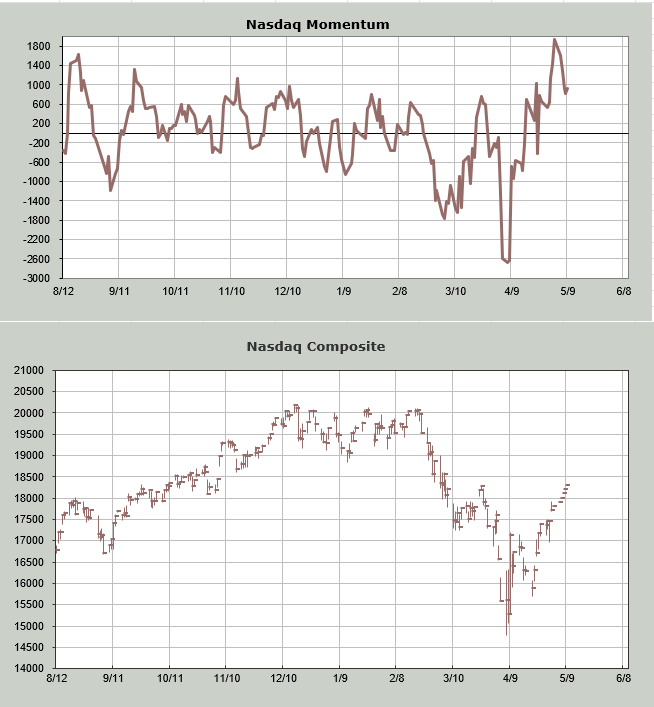
This doesn’t mean I think we are heading right back down. As I explained last night, I think it is too soon. What should happen is this sideways chop, even if we get a big down day, just like it gave us an up day today.
But did you notice the up day today closed near the low? Did you notice the down day on Wednesday closed near the high? That’s chop. I expect that to continue for the time being.
At some point, we will get intermediate-term overbought. My estimation is around mid-May for this. Once we get the intermediate term overbought, we will see where the indicators are. Is the McClellan Summation Index still rising? Is the Hi-Lo Indicator still rising? Have we converted the bears to bulls?
If the Summation Index is heading down, the Hi-Lo Indicator is heading down, and sentiment has gotten too bullish, then I would start preparing for some more meaningful downside. Until then, sideways is the most likely scenario in my view.
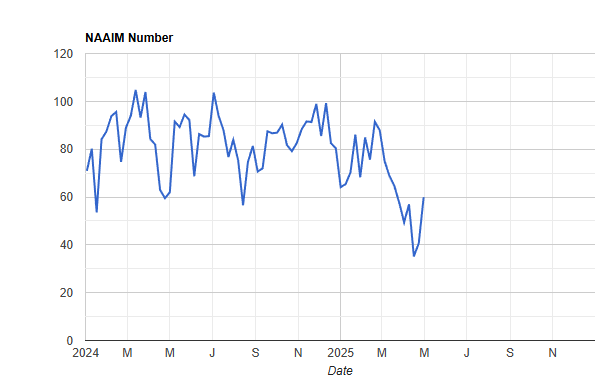
In terms of sentiment, the NAAIM folks increased their exposure to 60 (up from 35), and that was before last night’s earnings. So if we don’t fall apart between now and next Wednesday, we can expect this to rise some more.
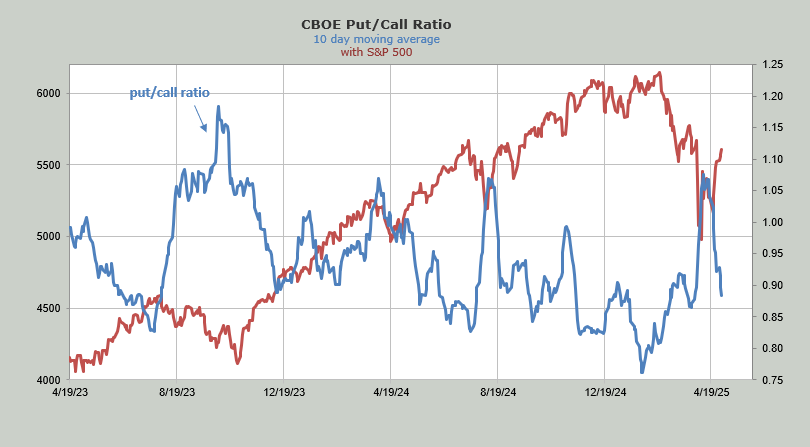
Down below, you will see the ten-day moving average of the put/call ratio is back down to .88. It’s not hard to imagine that within a week it could be back to that .85 area, which would tell me the options traders have been converted.
Let me note one more thing regarding sentiment. The VIX has come down quite a bit. It looks a little oversold to me, so I can see it rising next week. But the DSI is back to 29 (recall it was 75 at the lows). If the DSI on the VIX gets to be a teenager by mid-May, that too would be a sign for me.
New Ideas
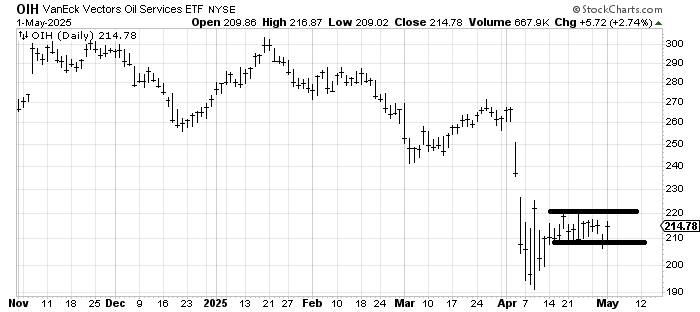
Oil turned around today but I really want for OIH to clear 220. I will use a stop under yesterday’s low. We looked at this two nights ago.
Today’s Indicator
The ten-day moving average of the put/call ratio is discussed above.
Q&A/Reader’s Feedback
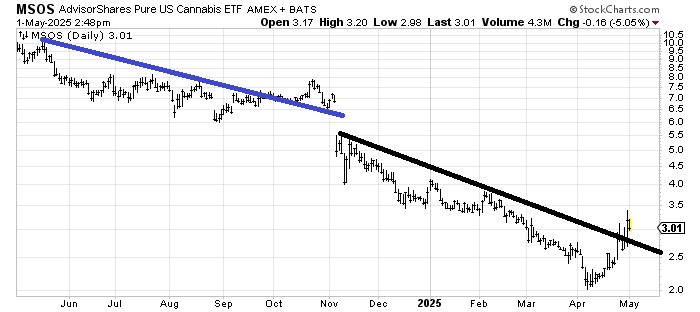
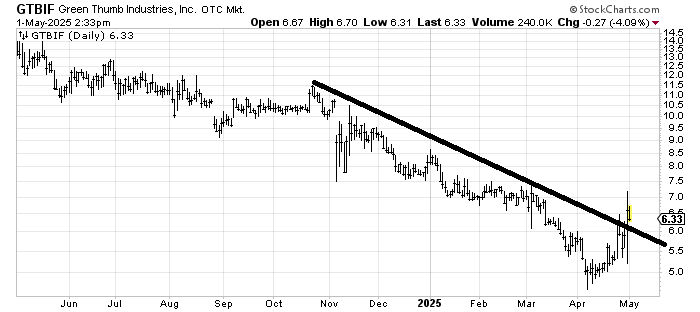
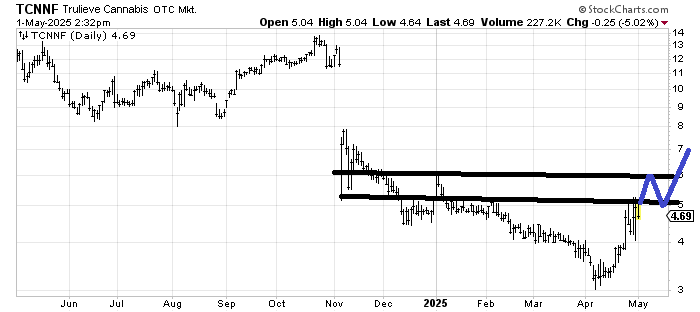
I have been asked about some pot stocks. That means I should preface this by noting I used to hand chart MSOS (the ETF) and Tilray TLRY, and they both fell off the bottom of my chart so often that I finally stopped charting them (by hand). Thus, I am probably biased against them, so understand that when I go through these charts.
MSOS crossed the downtrend line, but there is a lot of resistance at 3.50. What’s more is that last fall, it crossed a downtrend line (blue) and still managed to gap down. Use a stop under 2.50-ish.
Green Thumb GTBIF had better hold that 5.50 area, or I’d consider the downtrend still intact. Resistance gets awfully heavy at 7-7.50. The stock trades so thinly that it had an outside day yesterday with absolutely no follow-through today.
Trulieve Cannabis TCNNF has so much resistance between 5 and 6 that if it were to improve, it would have to get up to 6-ish and then have a minor pullback before rallying again. If it did that, I might—might—think it was improving.
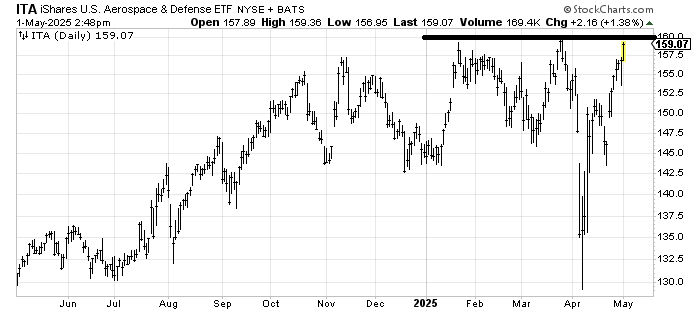
ITA is an ETF to be long Aerospace and Defense stocks. It has already run over 20% from the low and is now knocking on resistance. That’s not my kind of stock to chase. My guess is if it cracks over 160, it would still have a pullback shortly thereafter, having run so far, if it gets over though the measured target would be around 167.
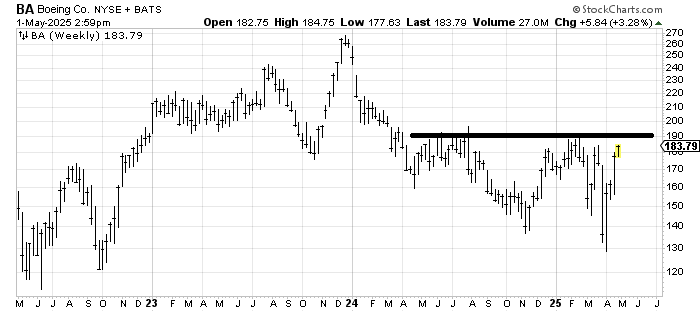
I would, however, note that I have liked Boeing BA for a while, and the weekly chart of BA says over 190 would be bullish, or at least would get the chart folks excited.
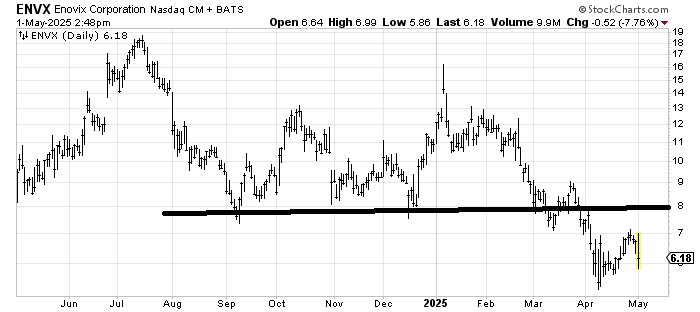
My first thought when looking at the chart of Enovix ENVX is that it has barely rallied from the low, which should be cautionary. Either way, resistance at 8 is quite heavy, and if it stays weak, the measured target is near 3-ish.
Helene welcomes your questions about Top Stocks and her charting strategy and techniques. Please send an email directly to Helene with your questions. However, please remember that TheStreet.com Top Stocks is not intended to provide personalized investment advice. Email Helene here.
