Did an Indicator Just Signal the End of the QQQ Win Streak?
The QQQs have been up for nine straight days. That hasn't happened since 2021. What's next?
You've reached your free article limit
You've read 0 of 1 free Pro articles.
The Market
I know it felt like a big Mag 7 type of day, and it was. But let‘s note that the QQQs have been green for nine straight days, so it isn’t just today. The last time it went more than this was early 2021.
These sorts of streaks don’t occur that frequently, but long-time readers will know my view on this: the longer the streak, the more apt we are to have a day where everything goes the other way.
With that in mind, I plugged in some ‘what ifs’ for the Nasdaq Momentum Indicator. What I do here is walk price up to see what day the Momentum Indicator stops going up. Tomorrow is the day.
A few ground rules here. First, the exact day is not what this is intended to find; it’s intended to find the general time frame when the short term is overbought. We are entering that time frame. Secondly, yesterday I said if the market is up heading into the FOMC meeting (Wednesday), I think we’ll get a pullback on the news. I am going to stick with that view.
I also said if the market is down heading into that meeting, then it’s a coin toss. So, if Nasdaq is down tomorrow, it becomes a coin toss. If Nasdaq is up, then I think we see a pullback.
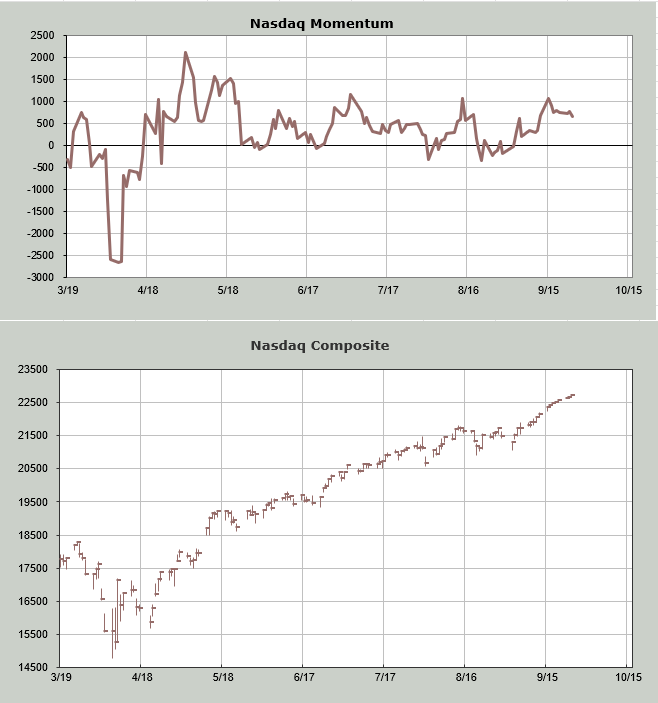
There is one more thing to discuss regarding this week’s market. The DSI for Nasdaq is at 82, so if tomorrow is up, or even if Wednesday is up, it is once again possible that the DSI scoots over 85. Let’s see if it happens tomorrow.
New Ideas
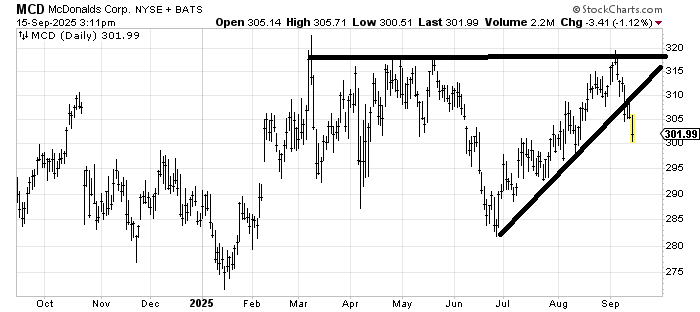
I want to point out that McDonald’s MCD, which I highlighted with the restaurants last week, broke that uptrend line rather handily. It has support all the way down, so it’s hard to determine where it is going.
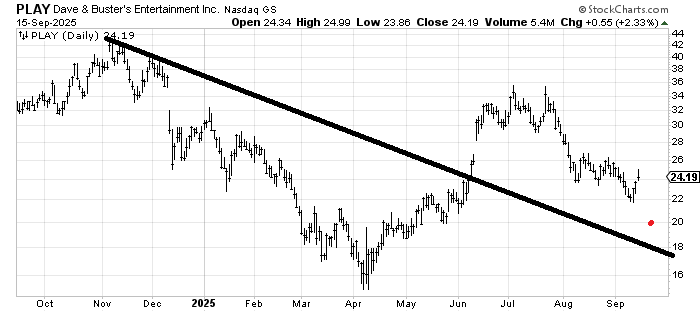
After the close, another restaurant, Dave and Busters PLAY, reported a miss, and the stock is trading down near 20 (red dot on the chart). It’s a chart I would have thought was bottoming, and it turns out there are still a lot of sellers. It should find support around 18.
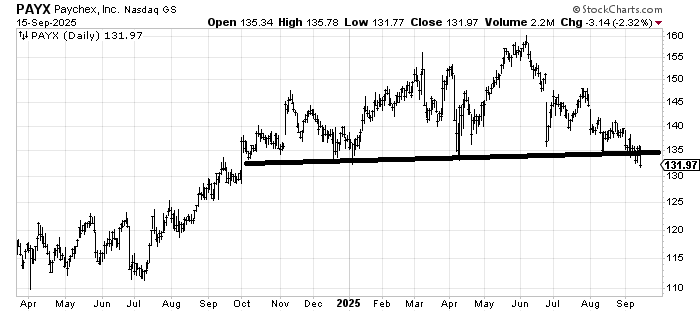
And then there is Paychex PAYX, which I have highlighted before. I thought it was trying to hold 135, and now it seems to be giving way. If it can’t recapture 135 this week, that is going to be a giant top.
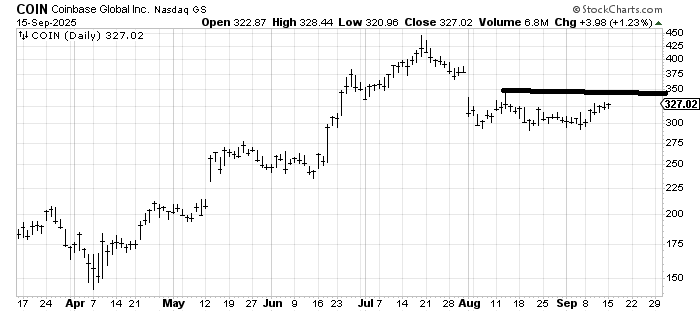
I do not have a measured target for Coinbase COIN, yet. My initial thought is that it ought to get to that 340-ish area where that spike high from August is.
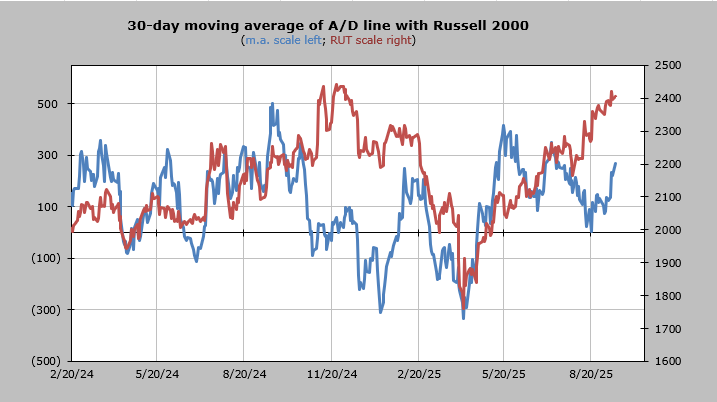
Today’s Indicator
The 30-day moving average of the advance/decline line is getting a little overbought.
Q&A/Reader’s Feedback
Helene welcomes your questions about Top Stocks and her charting strategy and techniques. Please send an email directly to Helene with your questions. However, please remember that TheStreet.com Top Stocks is not intended to provide personalized investment advice. Email Helene here.
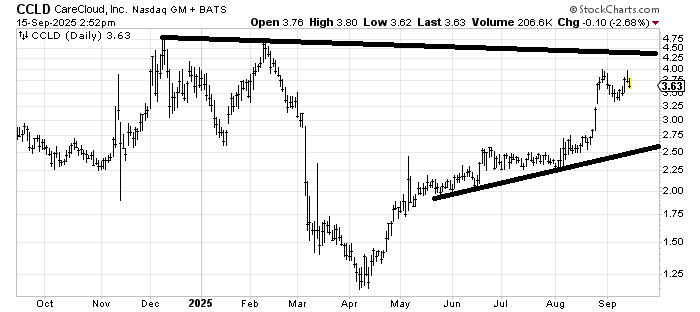
If CareCloud (CCLD) can get down to the lower line (around 2.75 at the end of September) I’d probably think it was okay to buy because it would have tested the line. Otherwise, I still see resistance at that upper line around 4.25. I prefer when a pattern shapes up, and this one feels as if it is in the middle of nowhere.
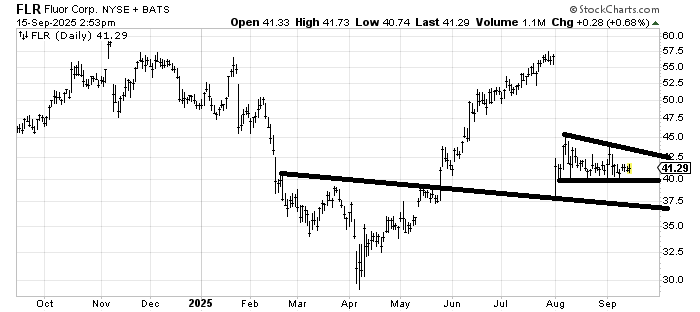
Fluor FLR is interesting in that the risk/reward is pretty good. If it breaks 40, then that 36-37 comes into play, but if it holds it, there ought to be improvement. Maybe it just goes sideways for a bit first. This is exactly the reason the market needs a sell-off—so we can see if these stocks find buyers down below.
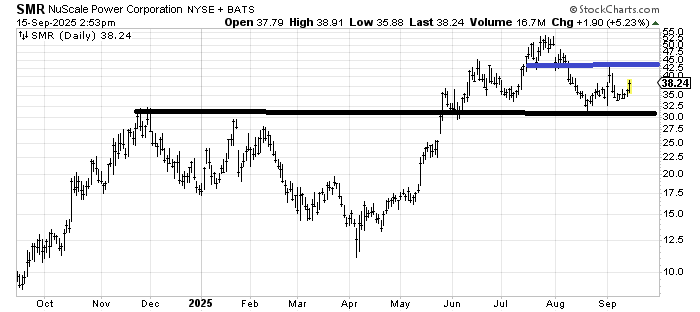
NuScale Power (SMR) ought to make a try for the blue line around 43. If it can’t do that and turns south before then, then we’d be looking at a possible head and shoulders top with a neckline at 30. I think it tries for the blue line, though.
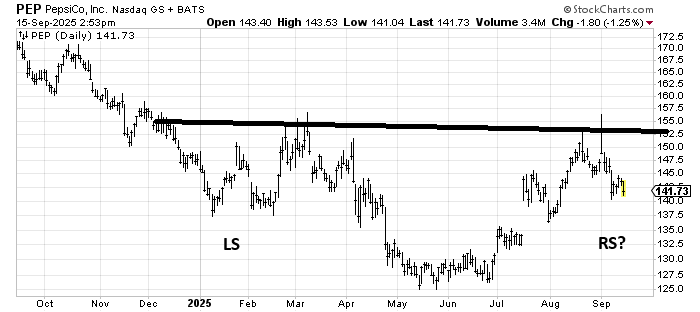
I liked Pepsi PEP when it was down near 126. It had a great run to resistance, and now I’m watching the pullback to see if it can form a right shoulder of a head and shoulders bottom. If it can hold this 137-ish area, that chart is going to look quite symmetrical. My guess is it needs a few more weeks to see if it can hold.