Could Lululemon Actually Fit in My Portfolio?
Let's check the chart, technicals and fundamentals to see where and how we could play this stock.
You've reached your free article limit
You've read 0 of 1 free Pro articles.
Former highflier Lululemon Athletica (LULU) has been in the news quite often recently. I had avoided the name for the longest time and that was the correct call. For most of the year. Then, the stock came to life. On Monday, LULU closed up 1.71% for the day and stood up 33.5% from the stock's 2025 low this past September. Missed the boat? Well, that would be a timing question. LULU is also still down 49.8% from its last January high.
Sales growth went missing. After regularly posting year-over-year revenue growth of 20%, 30% and more every quarter for years, sales growth has printed in the single digits, percentage-wise for five of the past six quarters. Heck, back in 2022, Lululemon put back-to-back quarters together of 88% and 60% growth.
Once LULU was no longer a growth stock, the valuation came off. Over the past 10 years, LULU's average forward-looking price-to-earnings ratio is about 41.5. The five-year average is still 40.1. These averages include the present day, where the re-rating of this stock is quite evident. LULU now trades at 16.3-times 12-month forward-looking earnings. According to Birinyi Associates, the S&P 500 currently trades at 22.3-times.
Recent News
- On Dec. 11, LULU gapped higher by a whopping 9.6%. Yes, it had a semi-nice quarter (still just 6.7% sales growth), but the real news that got investors fired up was the announced departure of CEO Calvin McDonald. The company announced an executive search for a new CEO, as McDonald will step down at the end of January. Oh, it also increased the size of its share repurchase program by a cool $1 billion.
- A couple of days later, LULU learned that because of its dramatic loss in market capitalization this year, it would be removed from the Nasdaq 100 during the December reconstitution. LULU was one of six companies to get that boot, a group that included Biogen (BIIB) and The Trade Desk (TTD) . These names were replaced in the Nasdaq 100 by six stocks that included the likes of Western Digital (WDC) and Seagate Technology (STX) .
- All was not lost. A few days after that, the Wall Street Journal reported that Elliott Investment Management had taken on a $1 billion stake in Lululemon and was lining up its own list of potential CEO candidates. Long-time readers know how much I love when activist investors get involved in my stocks. Just one thing. LULU was not one of my stocks.
- Finally, yesterday, company founder Dennis "Chip" Wilson, who has not been involved with the running of the company since 2015, but remains its second largest shareholder, entered the arena. Wilson launched a proxy fight with his nomination for three seats on the board. Now, you have a well-known activist investor pushing for change and the company's founder doing the same.
What Does the Chart Say?
Actually, the chart has a lot to say...
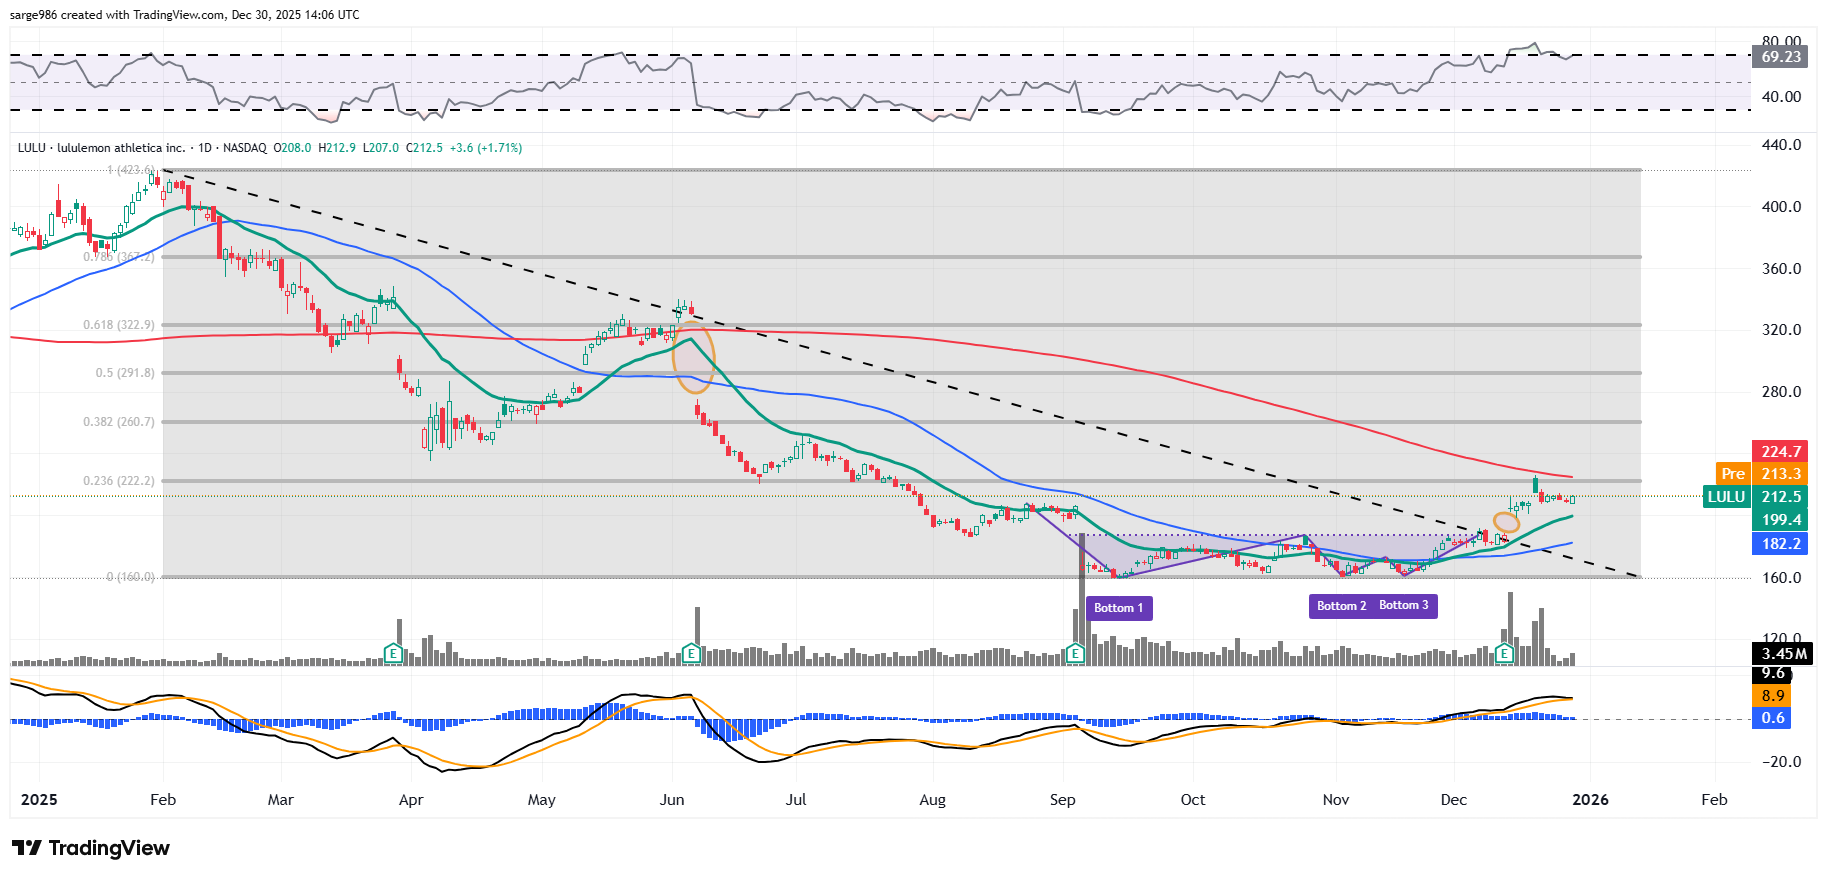
Readers will note that LULU put in a triple bottom (maybe a quadruple bottom) pattern of bullish reversal with a $187 pivot from early September through early December. Out of that pattern, I would have had a $224 target. The stock peaked at $225.98 on Dec. 18.
This resistance appeared not only at what I saw as a pattern-driven target, but was also where the shares ran into both their 200-day simple moving average and the 23.6% Fibonacci retracement level of the entire January through December sell-off.
What that means is that this is a real resistance level driven by professional money. It also means that if that level can be taken that this professional money will be forced to chase and increase exposure before the stock gets away. That will create support at that red line as it had been resistance.
There are some warning signs. Relative strength is straddling the edge of being considered technically overbought and has been for more than two weeks. The daily moving average convergence divergence looks tired as well. All three components are still aligned bullishly, but the signal is weaker as the 12-day EMA is dangerously close to crossing below the 26-day EMA.
Lastly, there is an unfilled gap to the downside that would require a tick at $188.50 or lower to fill. But there is also an unfilled gap from early June that would require a tick at $329.60 or higher to fill. Now, we all know that unfilled gaps do not have to be filled. That said, we also know that they usually are.
My Plan
At this level, I sit on my hands and pretend I'm a statue. Where do I get long these shares? At two spots. Close to LULU's 21-day EMA (currently $199.50), if I see signs of increased swing trader-type activity. Second, on momentum on a take and hold of the 200-day line (currently $224.70). Won't everyone be trying to buy it there in that case? Precisely. I'll have a floor to work with. I would not be opposed to getting long a $225 / $240 bull call spread for a net debit of something like $2.05-ish. That way, I would not have to chase with the big cats when it all does shake out.
At the time of publication, Guilfoyle had no position in any security mentioned.
