Costco Faces More Losses as Lengthy Downturn Continues
The wholesale retailers has seen Wall Street revise earnings estimates as the stock remains mired in a slump.
You've reached your free article limit
You've read 0 of 1 free Pro articles.
Is it time to buy the dip?
Costco (COST) will not report again until March 5 (or so). I was thinking that perhaps it was time to get involved on the long side in this name.
The stock, mired in a lengthy downturn, is now 18.4% off of the early June high and 19.2% off of the stock's 2025 high, which occurred in mid-February. The community of sell-side analysts are not going to be much help.
The consensus view for the current quarter is for almost 12% earnings growth on more than 8% revenue growth, which is fine. The situation is this:
Of the 29 analysts that I know of that cover this stock, 12 have revised their original earnings estimates for the period lower, 11 have revised their original estimates higher and six have left their numbers untouched. So, I went to the charts.
The Charts
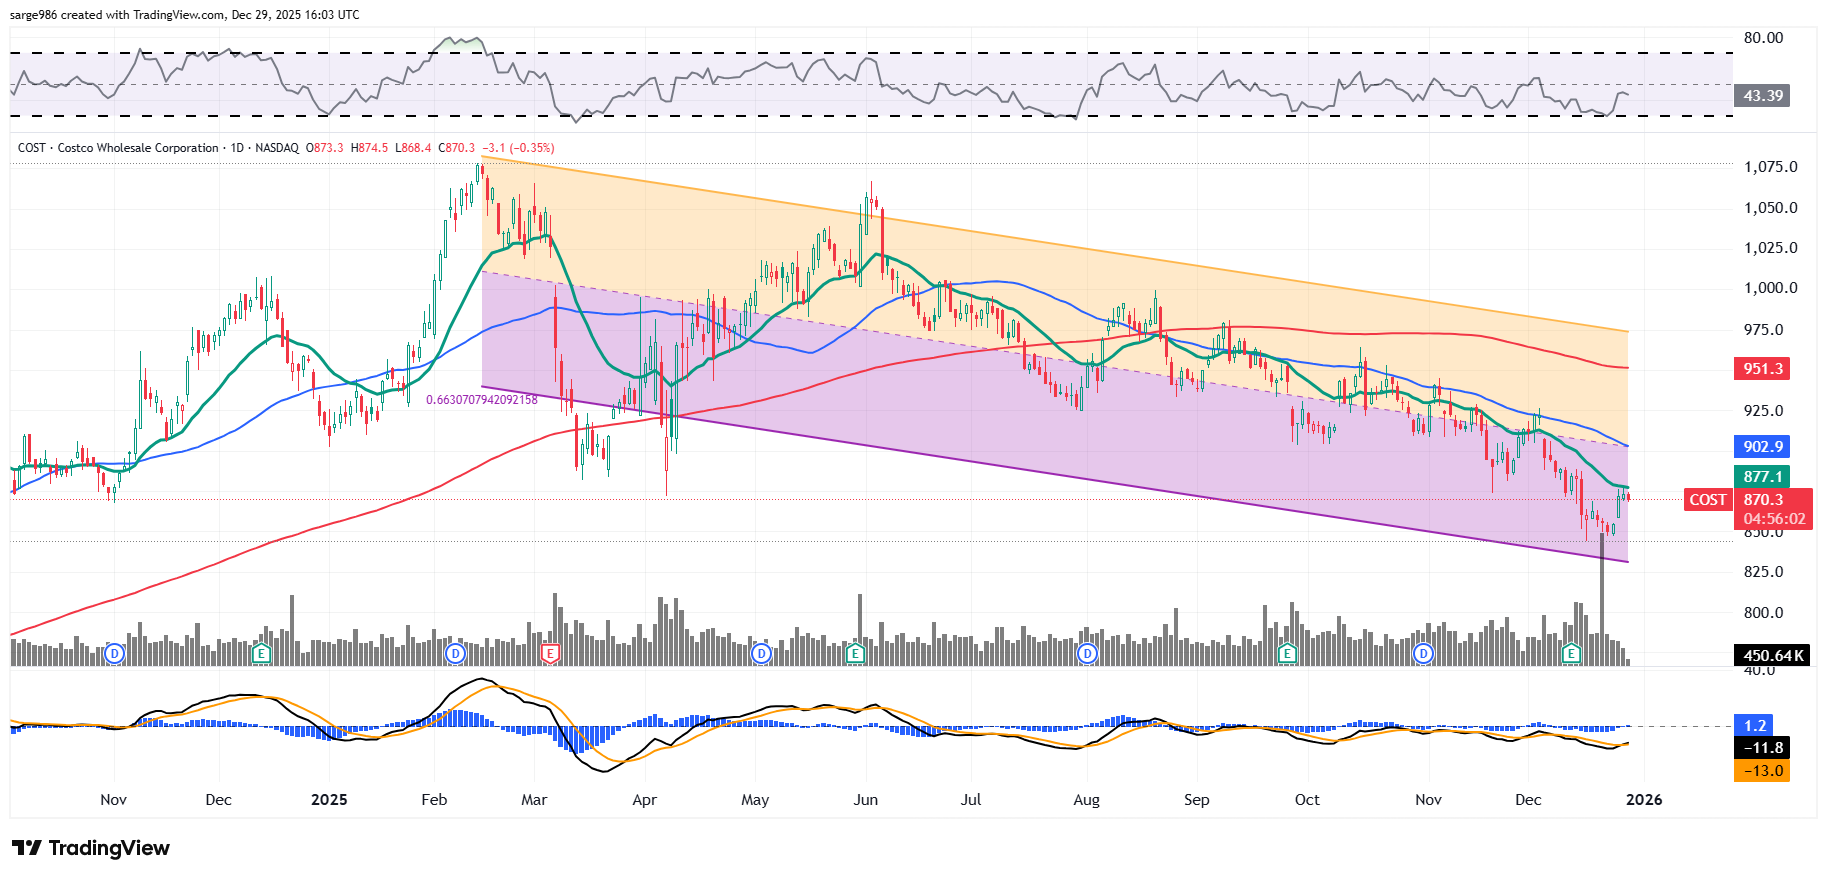
First, I tried an Andrews' pitchfork model. That looked ridiculous. Then I tried to apply this Raff regression model. That didn't really work either. Then I realized that I was looking at a double-top pattern of bearish reversal that only now was testing its downside pivot. If this pivot does not hold, all I can say is "oh no." Take a look:
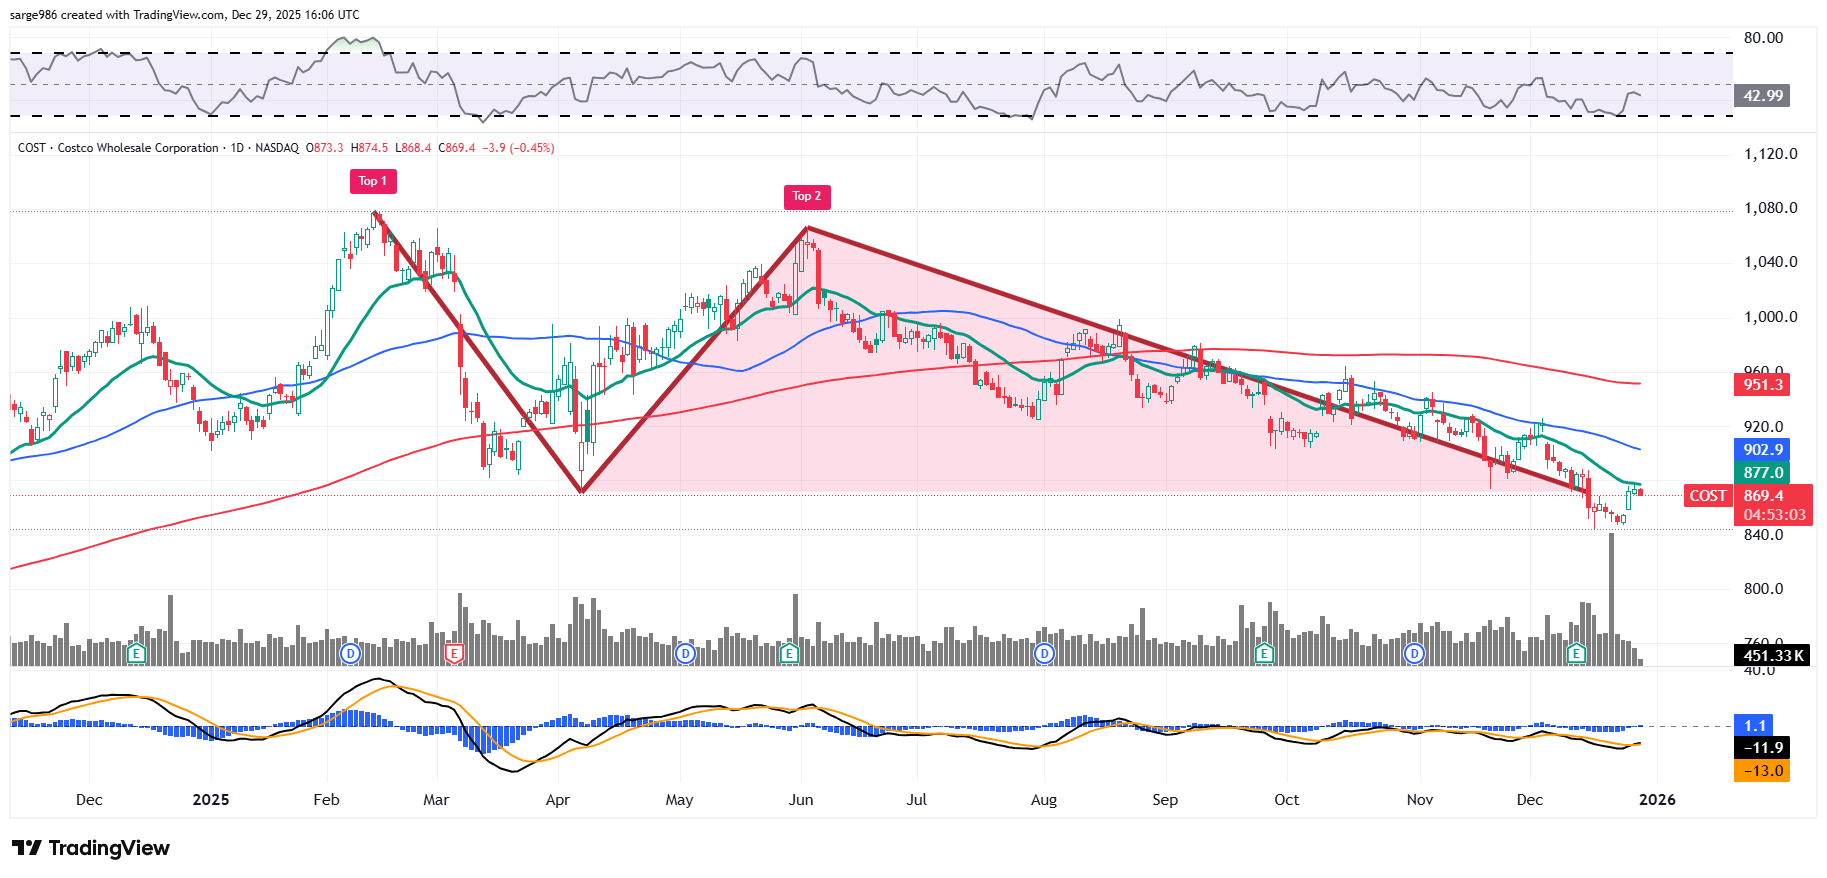
Readers will see (and I can't believe I'm only seeing this now) a double top with peaks in February and June with a trough in between that bottomed at $871. This produced a sell-off that has taken almost six months, just to get to pivot.
The stock has lost the professional support that could come at either or both the 50-day SMA and 200-day SMA. The swing crowd has shown up as resistance every time the stock has tried to take on its 21-day EMA. This is "sub-optimal" to quote a friend in common of ours.
Now, the indicators that I use most often are weak but not awful. Relative strength has been on the rise of late but is still not yet at a neutral level. Within the daily MACD, the histogram of the nine-day EMA has moved into positive territory. That's short-term bullish. The 12-day EMA has moved above the 26-day EMA. That's a positive too but is somewhat negative by how deep into negative territory both of those lines are.
That pivot is the problem. Should that spot crack and lose what support we are now seeing, this stock could drop another 20% or so from here. Now, I would not set a target that low as I usually target 8% to 10% profit zones on my shorts, of which COST is not one, but I see the technical case for COST with a "6" for a first digit.
Additionally, even if support is sustained here, that could turn the double top into a descending triangle, which is still bearish. The COST bulls need to see the pattern broken completely and need portfolio managers to increase exposure at the key moving averages.
The Answer Is...
No, I am not buying this dip in COST. I would consider shorting the name if I was sure that this pivot had been lost.
At the time of publication, Guilfoyle had no positions in any securities mentioned.
