Chop Till You Drop
Here's what it would take to go from more volatility to bearish; also SLV breaks out, energy stocks are due for a rally, a read on Berkshire's chart and ... what would get me to the GAP.
You've reached your free article limit
You've read 0 of 1 free Pro articles.
The Market
Well we got some volatility didn’t we? Once again, let me remind you that my call is for volatility. I have thought it is too soon to be bearish, but I will explain what it would take for the market to move from higher volatility to bearish.
To get bearish, we have to see selling, and that selling has to be aggressive. All that we have now is a lack of buying interest (which is what we tend to get when a market gets overbought).
The McClellan Summation Index is heading down, which is not bullish. But it needs a net differential of +400 advancers minus decliners on the New York Stock Exchange to halt the decline. That is a pretty small number, easily beatable. Any one day in the market can turn it. If I started to see that number get to +1,000 or more, I would say it means the selling has become more aggressive.
The number of stocks making new highs has not increased in more than a week. Again, to me that shows a lack of buying. If we saw the number of stocks making new lows increase that would make me believe the selling is becoming more aggressive. We have not seen that yet.
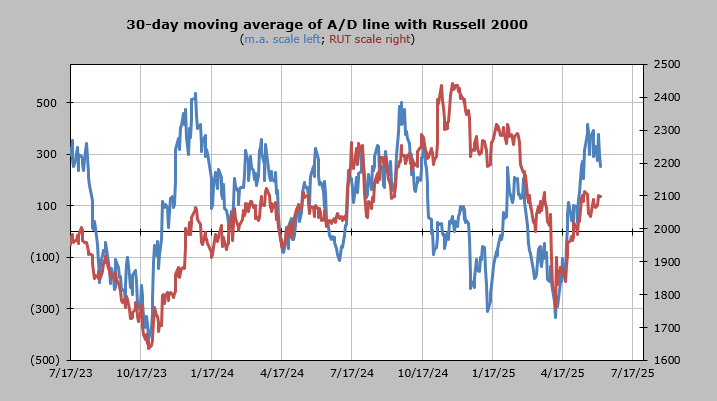
The overbought indicators such as the 30-day moving average of the advance/decline line are working off their overbought condition. It will take quite a bit to get this to an oversold condition, but this is one of the reasons I think the market is more apt to struggle on rallies.
Thus my call for more volatility. Sometimes more volatility, such as we got today, manifests into more selling, which then changes the indicators. Think of it like stages. You have to go through the first stage before you can go to the next. Sometimes all we’re doing is waiting.
So now you know what we need to watch for as we head into the jobs report tomorrow morning. Does the selling get aggressive or not?
New Ideas
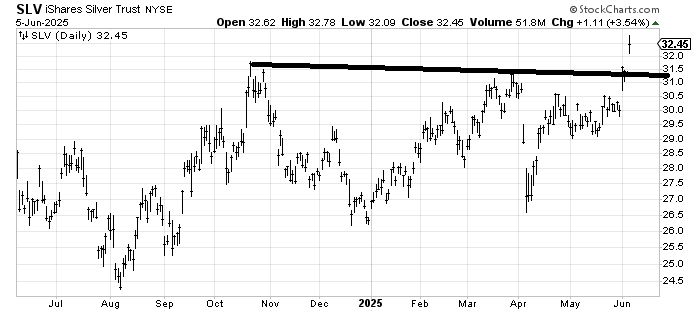
The silver exchange-traded fund SLV finally broke out today. It tends to be quite volatile, which means it could easily give up some of the rally tomorrow. But I did want to tell you the measured target is in the $34-$36 area.
Today’s Indicator
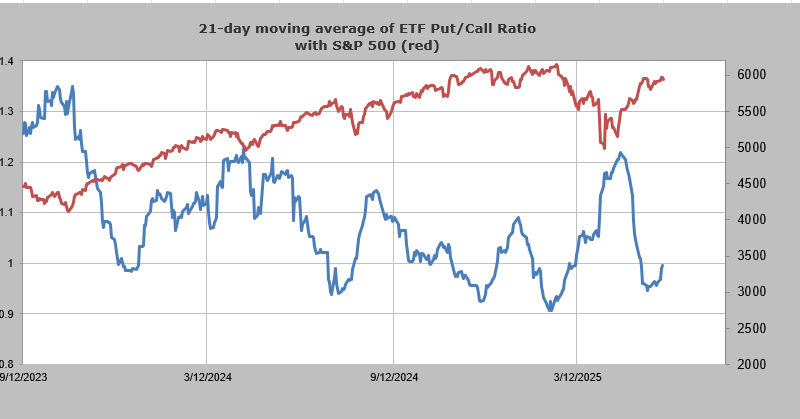
The 21-day moving average of the exchange-traded fund put/call ratio has turned upward. That typically it means a market pullback.
Q&A/Reader’s Feedback
Helene welcomes your questions about Top Stocks and her charting strategy and techniques. Please send an email directly to Helene with your questions. However, please remember that TheStreet.com Top Stocks is not intended to provide personalized investment advice. Email Helene here.
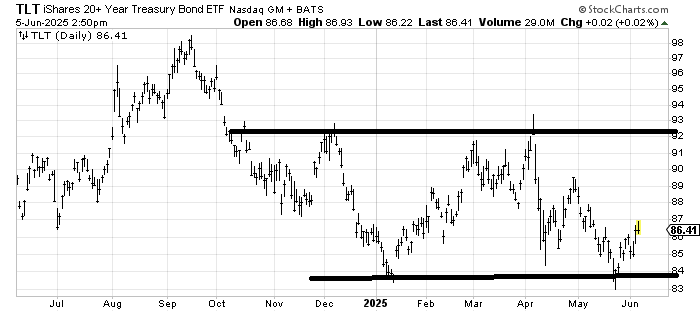
Bond Fund Stuck in a Range: My base case on the bond fund TLT is that it is not going to break out in either direction. A few weeks ago, I said I thought it would hold the January low and it has. The short term will depend heavily on tomorrow’s employment number, but I think if the number is good and TLT gaps down, it won’t break. If it gaps up, it runs into resistance around $88-$89. Mostly I just think it stays in a wide range for now.
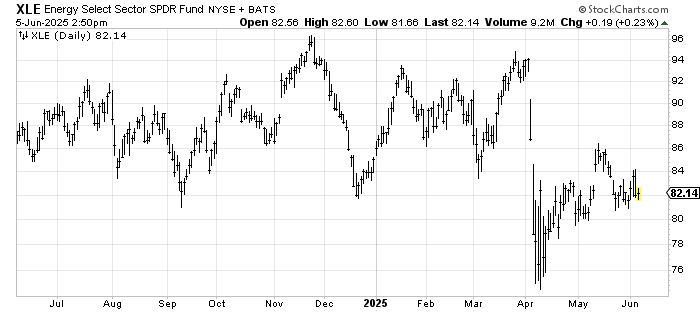
XLE Paces Back and Forth: I was asked about energy and as you can see, the energy ETF XLE has so much resistance overhead. It filled that gap at $86 and came right back down ... but all it does is mill around.
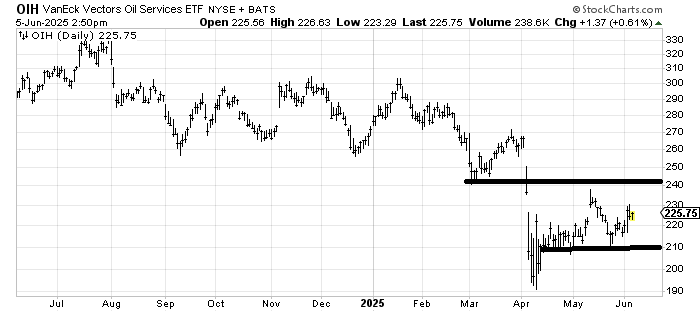
OIH Mills Around: The oil services fund OIH can’t get out of its own way as it too filled the gap and backed off and milled around.
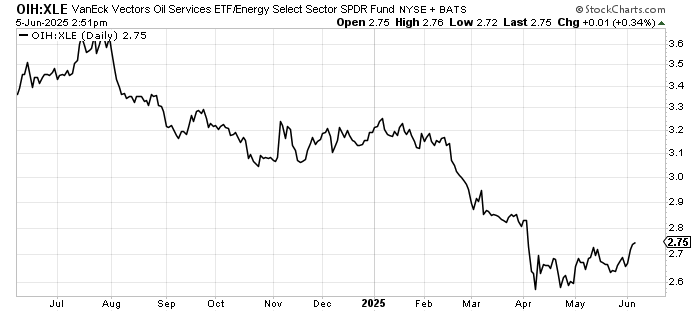
Rally Due for Energy Stocks: But here’s the chart that matters in my view. The ratio of OIH (high beta) to XLE (low beta). It has been making higher-lows and squint hard and you can see it has made a higher-high. That typically means we’re due a rally in energy stocks.
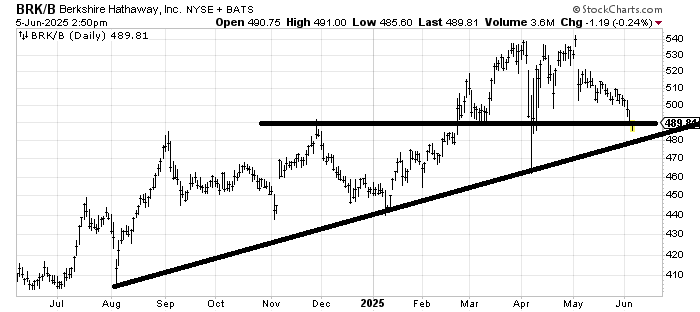
How to Read Berkshire: I was asked in early May where one would buy Berkshire Hathaway BRKA, BRKB now that Warren Buffett has stepped down. I didn’t have a great answer and I still don’t. But I do think this $480-$490 area has some good support and we should see a bounce off it. If it bounces and cannot get up and over $500 I’d consider that bearish, because it would mean the next trip down the uptrend line breaks.
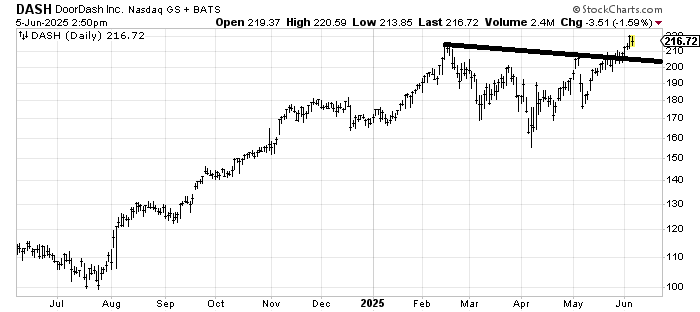
Door Dash No. Is ... 240: I don’t like stocks up at their highs, so Door Dash DASH is not my cup of tea. However the measured target is around $240 as long as it doesn’t break under $200.
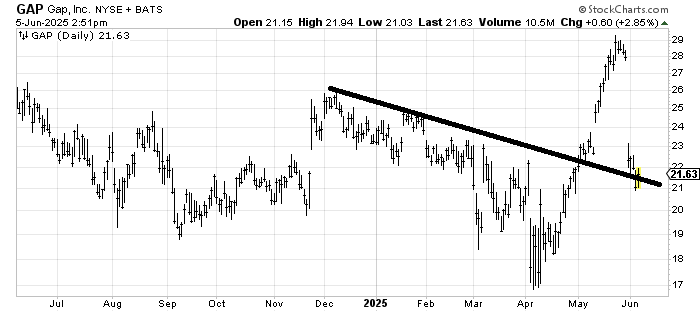
What Would Get Me to the GAP: Gap Stores GAP had a terrific run and then went plop. It is into support, but I think it’s too soon to get involved. I would wait for the stock to prove that this $21-area wants to hold. If it is still holding by say, late June, then I might be interested in taking a stab at it.