Charts to Pay Attention to This Week
Breadth has held up well, but the 492 remain overbought. Here's what I'm watching this week.
You've reached your free article limit
You've read 0 of 1 free Pro articles.
The Market
For a week now, I have thought the market, but mostly the 493 were overbought and in need of a correction. Thus far, all we’ve gotten is that they have all stalled over the last week. And even Friday’s down two percent day in the Russell 2000 did not yield a terribly poor breadth day.
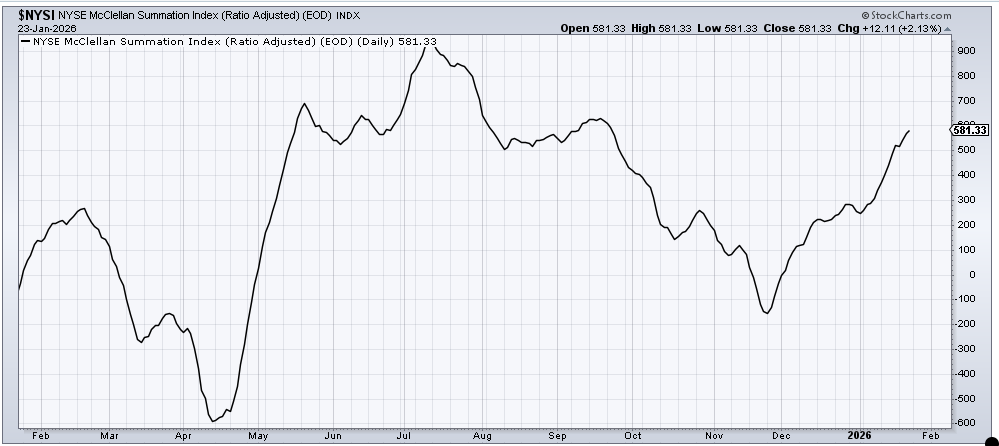
In fact, breadth held up rather well considering. The McClellan Summation Index is very much in focus now, though, because it will take a mere net negative of -500 advancers minus decliners to stop the rise in the Summation Index. That is not much of a cushion.
But let me share the charts I think are important to watch this week.
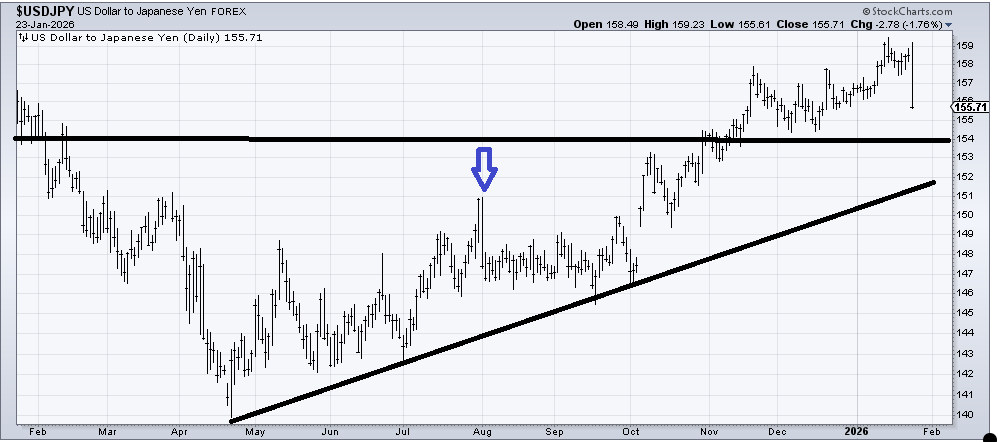
The first, and probably the most important, is the chart of Dollar/Yen. There was a time that central banks intervened in the currency markets all the time, but in the last decade or so that has not been the case. I will leave the fundamental side to others more conversant in it, but I would highlight the move in the currency pair.
Currencies don’t tend to move nearly two percent in a day—heck, a one percent move is a big deal. Now there have been massive moves in this pair before—see late July/early August. But look at any chart of any index, and you will see what stocks did at that point in time. So be prepared that such a move is again on the table. And should it arrive ought to shake up all that complacency that has built up.
Next is the Bank Index. I have not been a fan of this group for a few weeks now. It has been my contention they are tired, over-owned, and reached a measured target. Now there is a flat support line they sit at. Notice in July/August, they tried to break the line but held. Also, notice the two-day whack (see the currency discussion above). A break of that flat line (163-ish) that does not recapture the line quickly is worth fussing over.
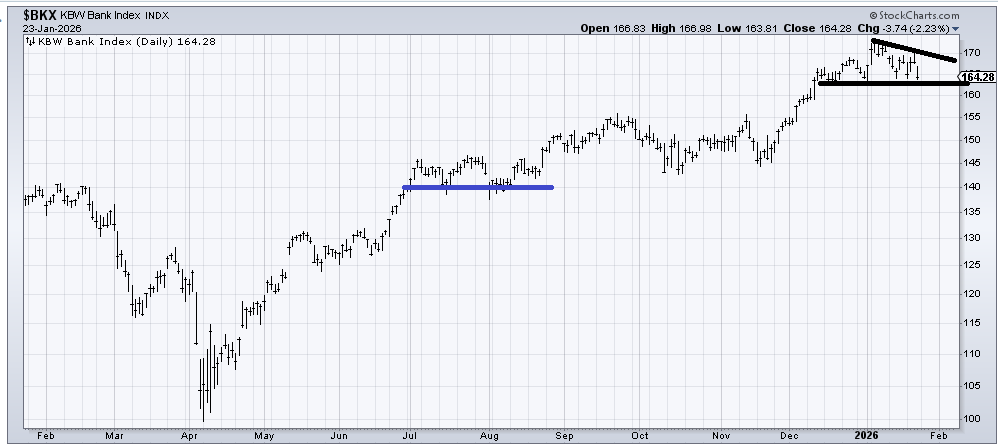
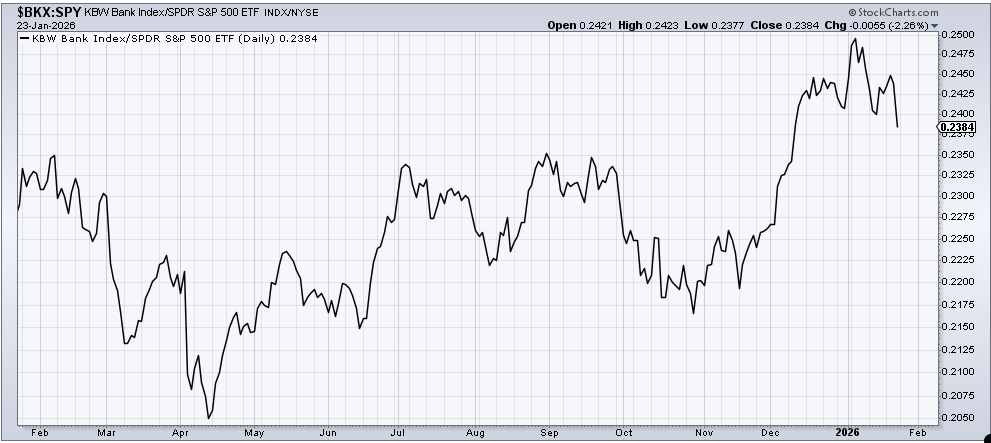
One reason I think it is worth fussing over is that I do believe the banks are over-owned, but also when we look at the ratio of the Bank Index relative to the S&P, we see it has in fact broken ‘the line’ and that banks have been underperforming since the calendar turned to 2026.
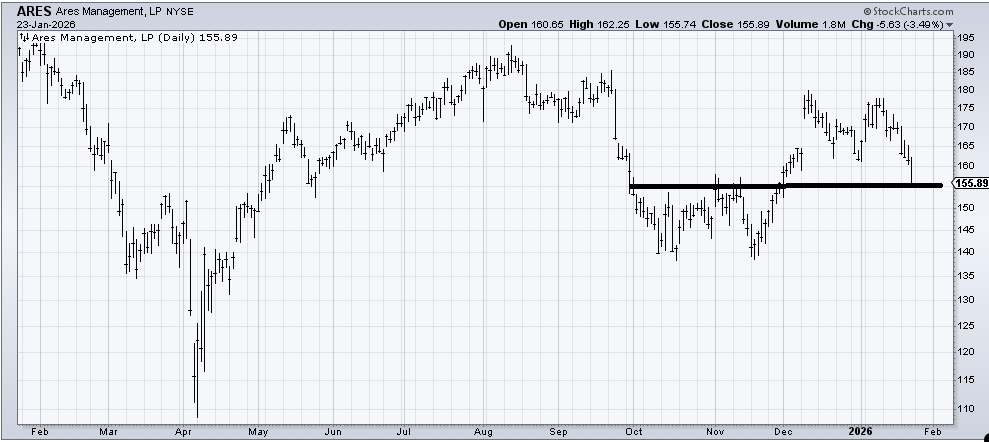
Then there are the asset managers, which have quietly started breaking down again. You might recall I highlighted this group back in September when they started falling apart. Ares Management (ARES) is just one name in the group, and you can see on Friday it fell out of a support it had been holding for the last two months. Now it has another layer here at 155. But that is not great action.
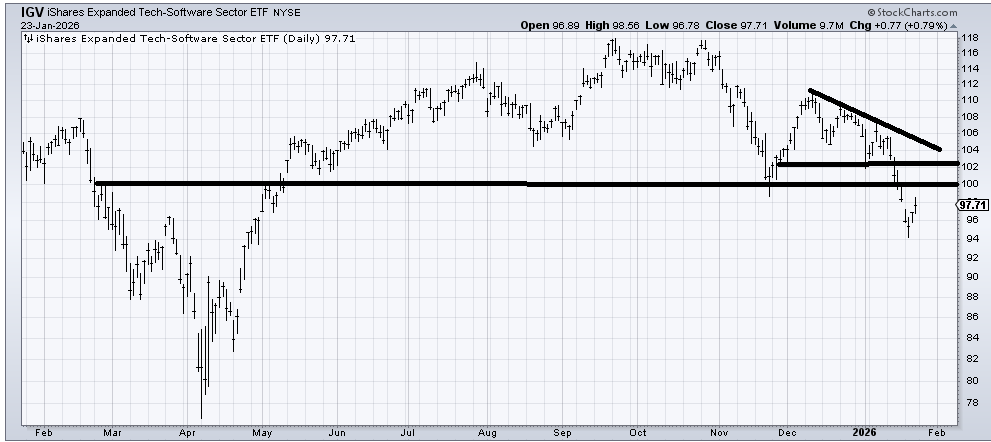
Sure, the mega-cap tech stocks finally caught a bid and rallied Friday, but now we focus on the overhead resistance in charts like (IGV) , the ETF for software. I suspect that 100-102 area stops on the first trip up there.
Finally for those who keep asking, the DSI for both Gold and Silver is 88.
New Ideas
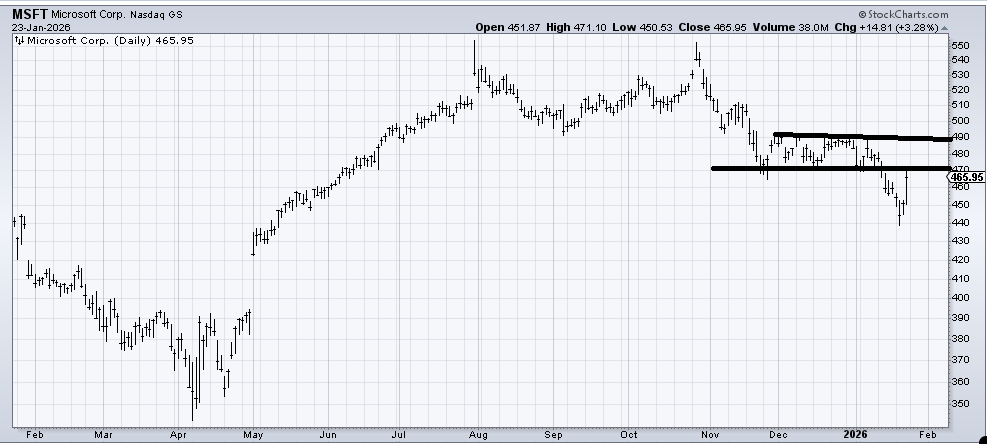
We got lucky with a trade in Microsoft (MSFT) as it rallied well on Friday. It is now pushing up against resistance, and earnings are due out Wednesday. Unless the stock gaps up over that 500 area, I suspect it runs out of gas short-term in this resistance zone.
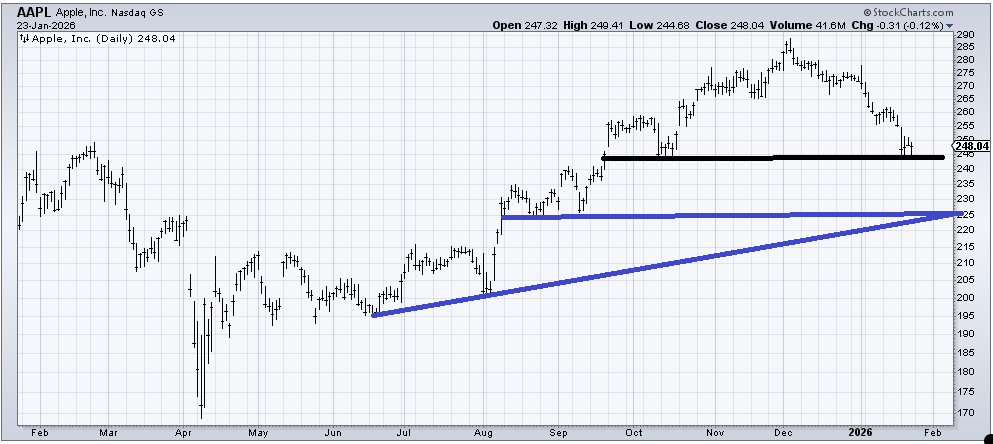
I want to also highlight the chart of Apple (AAPL) , which has earnings on Thursday. It’s been a terrible chart, but I don’t have the same sense of a bounce as I did with Microsoft. However, let’s talk about options since several have asked.
It has good support at 245 (black line). Maybe it bounces from here. But you see those blue lines and how they intersect right around 225? I think if AAPL somehow finds its way down there, I’d consider it grossly oversold and at support. Also, if AAPL did make it to that area, I can only imagine how the negative chatter would be deafening. And that would be enough for a decent bounce.
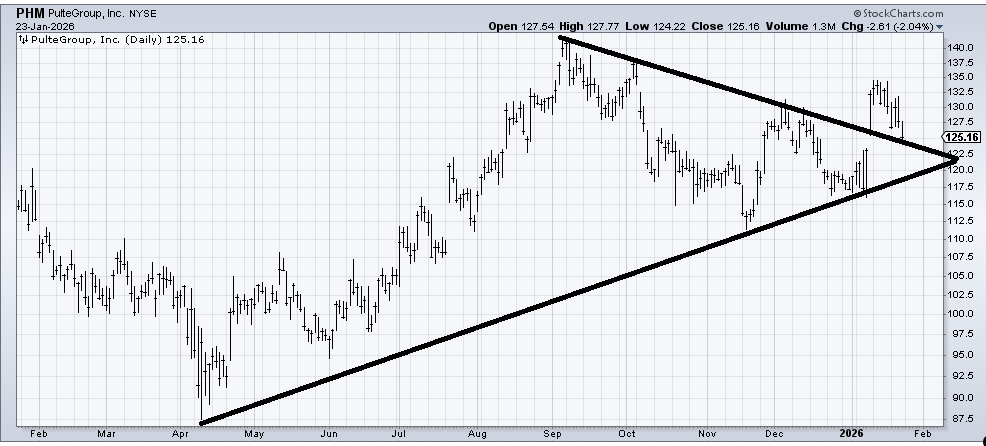
Finally, a few weeks ago, I recommended Pulte (PHM) , and we had a terrific pop in it. I thought the leakage was normal after such a pop, but I did not like Friday’s action. It ought to rally again after filling that gap around 123, but I fear the chatter now will be the weather across the US is holding back the homies.
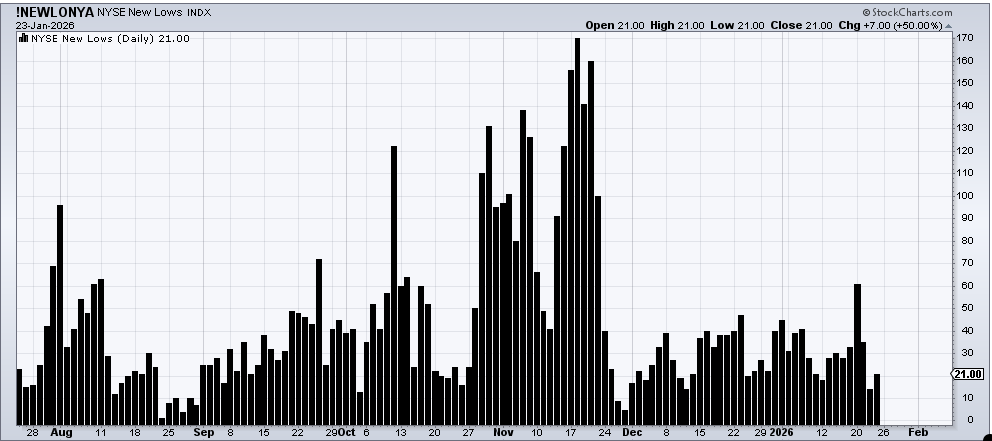
Today’s Indicator
The new lows did not expand on Friday.
Q&A/Reader’s Feedback
Helene welcomes your questions about Top Stocks and her charting strategy and techniques. Please send an email directly to Helene with your questions. However, please remember that TheStreet.com Top Stocks is not intended to provide personalized investment advice. Email Helene here.
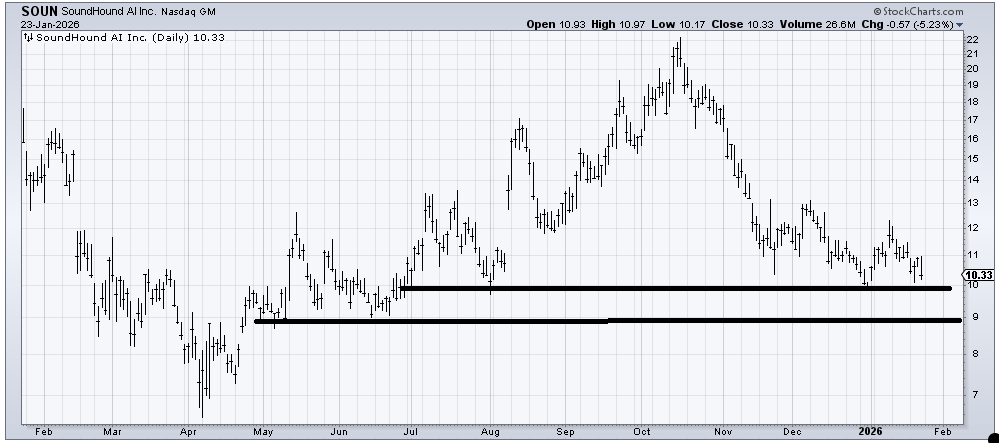
Soundhound (SOUN) has layers of support all the way down. It broke support at 11 and rallied. If it breaks support at 10, now you can see there is support at 9. Then a gap fill just over 8, etc. If you want to buy it, it’s hard to say use a stop under 10 for that reason, but what you want to see is when the stock does rally again, can it get over that early January high, just over 12. Because it hasn’t managed to make a higher high since October. If it is still holding 10 as we get back to an oversold condition, then maybe it looks more like a base.
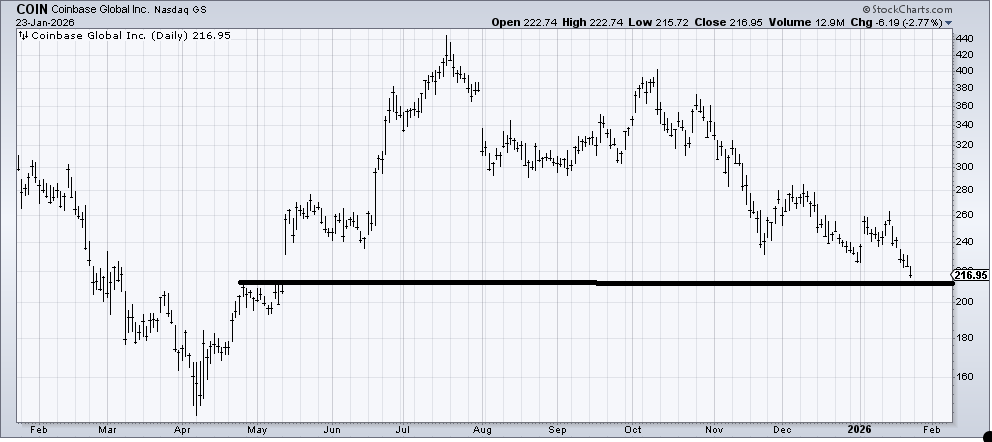
Last time we checked in on Coinbase (COIN) , I thought it would bounce off 240. It did. But I did not expect it to break 240 so handily on the next trip back down. There is a gap fill just below (I’m using a range of 212-215), and it is getting oversold, but that’s the best I can say about it.
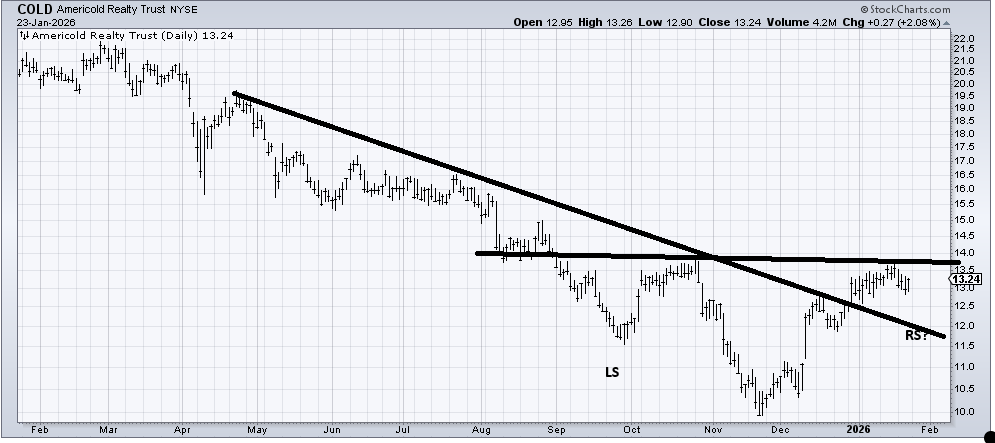
Americold Realty (COLD) has a great ticker symbol and also appears to be trying to develop the right shoulder of a head and shoulders bottom. Getting over the neckline at 13.75 isn’t a great breakout since you can see the layers of resistance all the way up, but it would sure improve the chart. Of course, I love symmetry and would love to see a quick trip to test the downtrend line around 12 first.
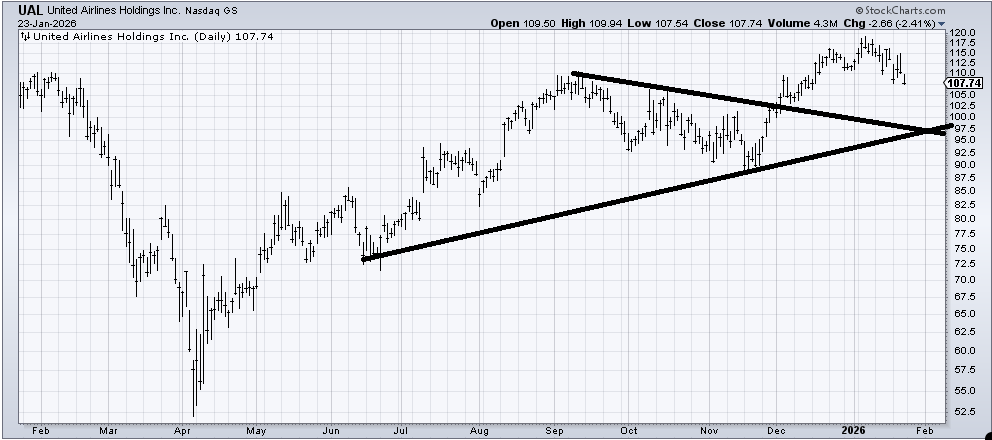
United Air (UAL) , like the Transports, can use a solid correction. There is support all the way down, so it’s hard to say the exact level it is going to, but if it gets to that 95-100 area again, I’d say it would be time to have another look at it.
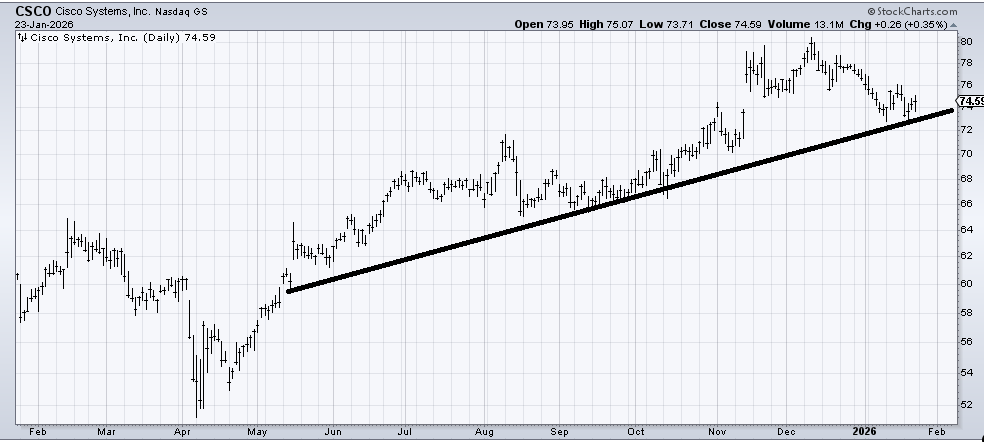
We looked at Cisco (CSCO) a few weeks ago when it filled that gap, and I thought it would bounce. I like the way it tested that low and bounced as well as bouncing off that uptrend line. It probably takes some time, but the pullback looks okay to me. I would prefer it doesn’t crack under 72, though.
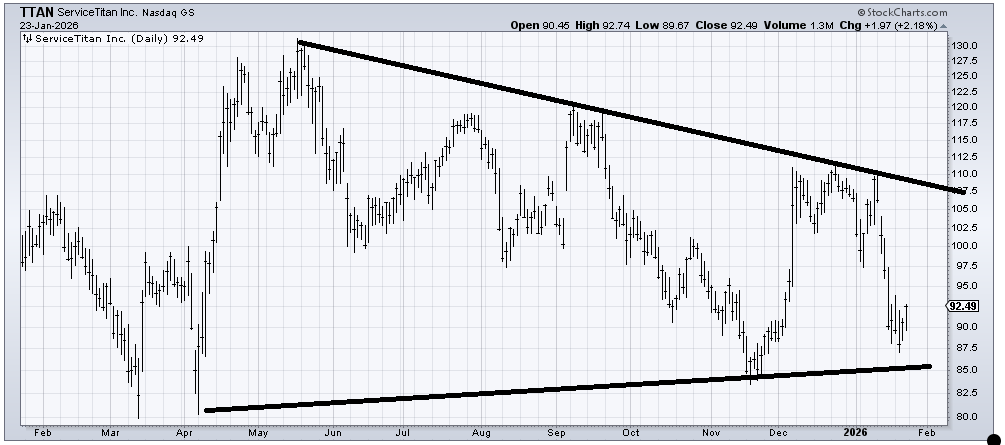
Service Titan (TTAN) held support and is trying to enjoy an oversold rally. Right now, it appears to me that this is just an oversold rally. However, I can see the chart developing over time (a few months) to build a base. So as long as that lower line stays intact, I would keep an eye on this each time it comes down to this area.
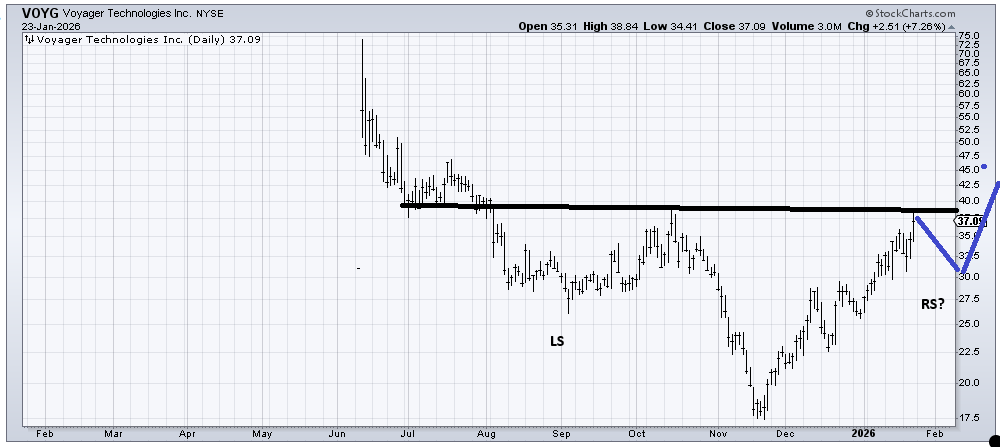
If Voyager Technologies (VOYG) can map out a right shoulder to develop that base a bit more, I think the chart would be a lovely one.
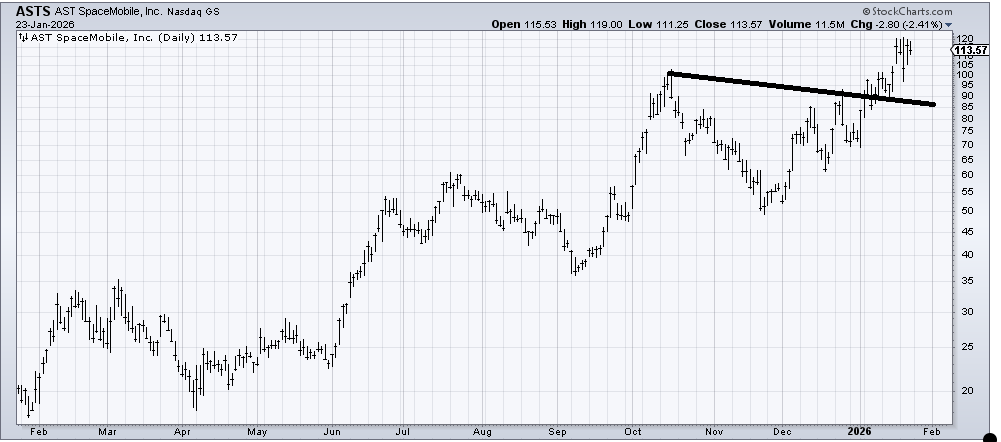
AST Spacemobile (ASTS) hasn’t done anything wrong, but it is not my kind of chart to chase. I’m not sure it pulls back to support (90-100), but if it does, it would look okay to me; otherwise, I would call it a hold. There is a short-term target around 125-ish and another one at 140.
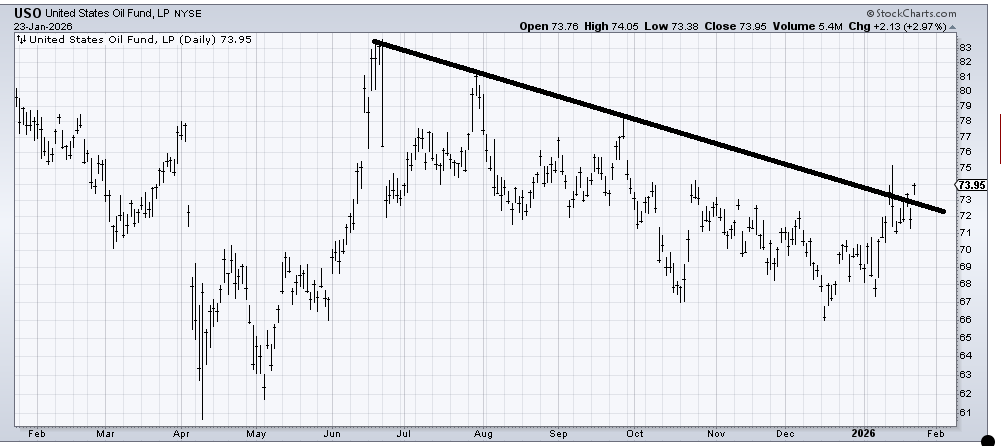
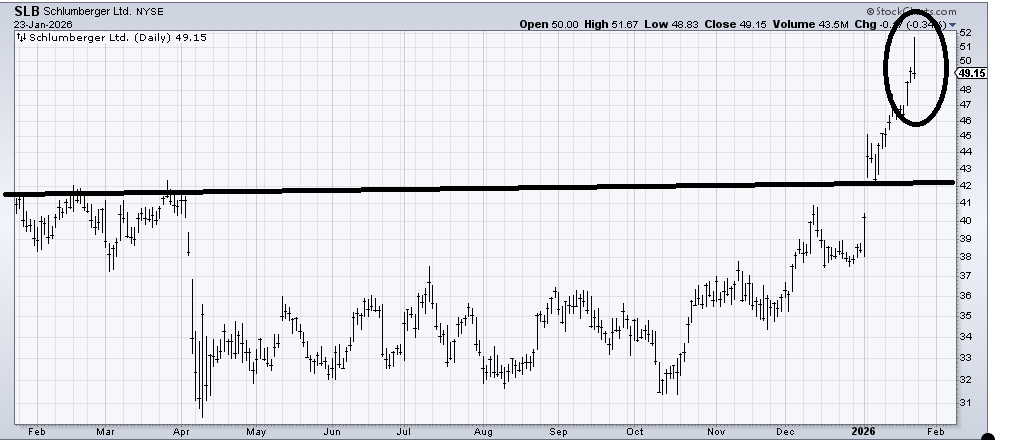
(USO) , an ETF to be long oil, is trying to build a base, but there is so much resistance all the way up, I can’t come up with any targets. All we can do is watch the DSI, which is currently 70. What I would point out is that OIH looks overcooked up here and is in need of a pullback. That includes a stock I have liked for a long time: Schlumberger (SLB) . SLB has tagged its target at 51. Taking something off the table there is encouraged.
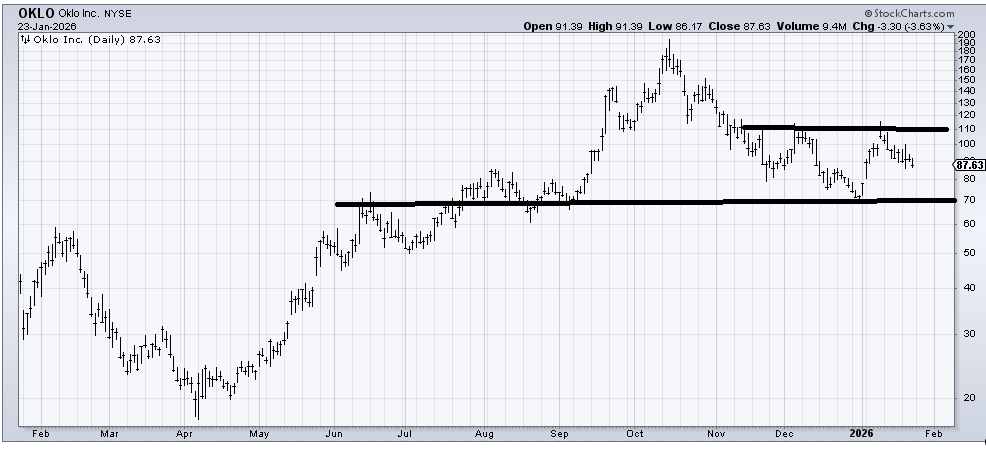
Instinctively, I look at Oklo (OKLO) and want to think it is forming a small head and shoulders bottom now (right shoulder would be at 80-ish), but I am also aware that many of these charts that peaked in October have only enjoyed short-term rallies before heading down again. For now, I’d say near 80, I’m a buyer for a trade, and then let’s see if that works and how it works.