Charting the Stocks That Will Control the Market’s Next Move
Taking a technical look at the Magnificent Seven, from hanging in there to hanging by a thread.
You've reached your free article limit
You've read 0 of 1 free Pro articles.
 Mag_7_4
Please read my earlier article on planning trades and managing risk.
As a general rule of thumb, we want to avoid stocks that are reaching multi-month lows. We also want to avoid stocks that are trading below their key moving averages.
The ETF on the chart below is indicating a fresh six-month low, and is trading below its 50-day (blue) and 200-day (red) moving averages.
You’re looking at a chart of the Roundhill Magnificent 7 ETF (MAGS) .
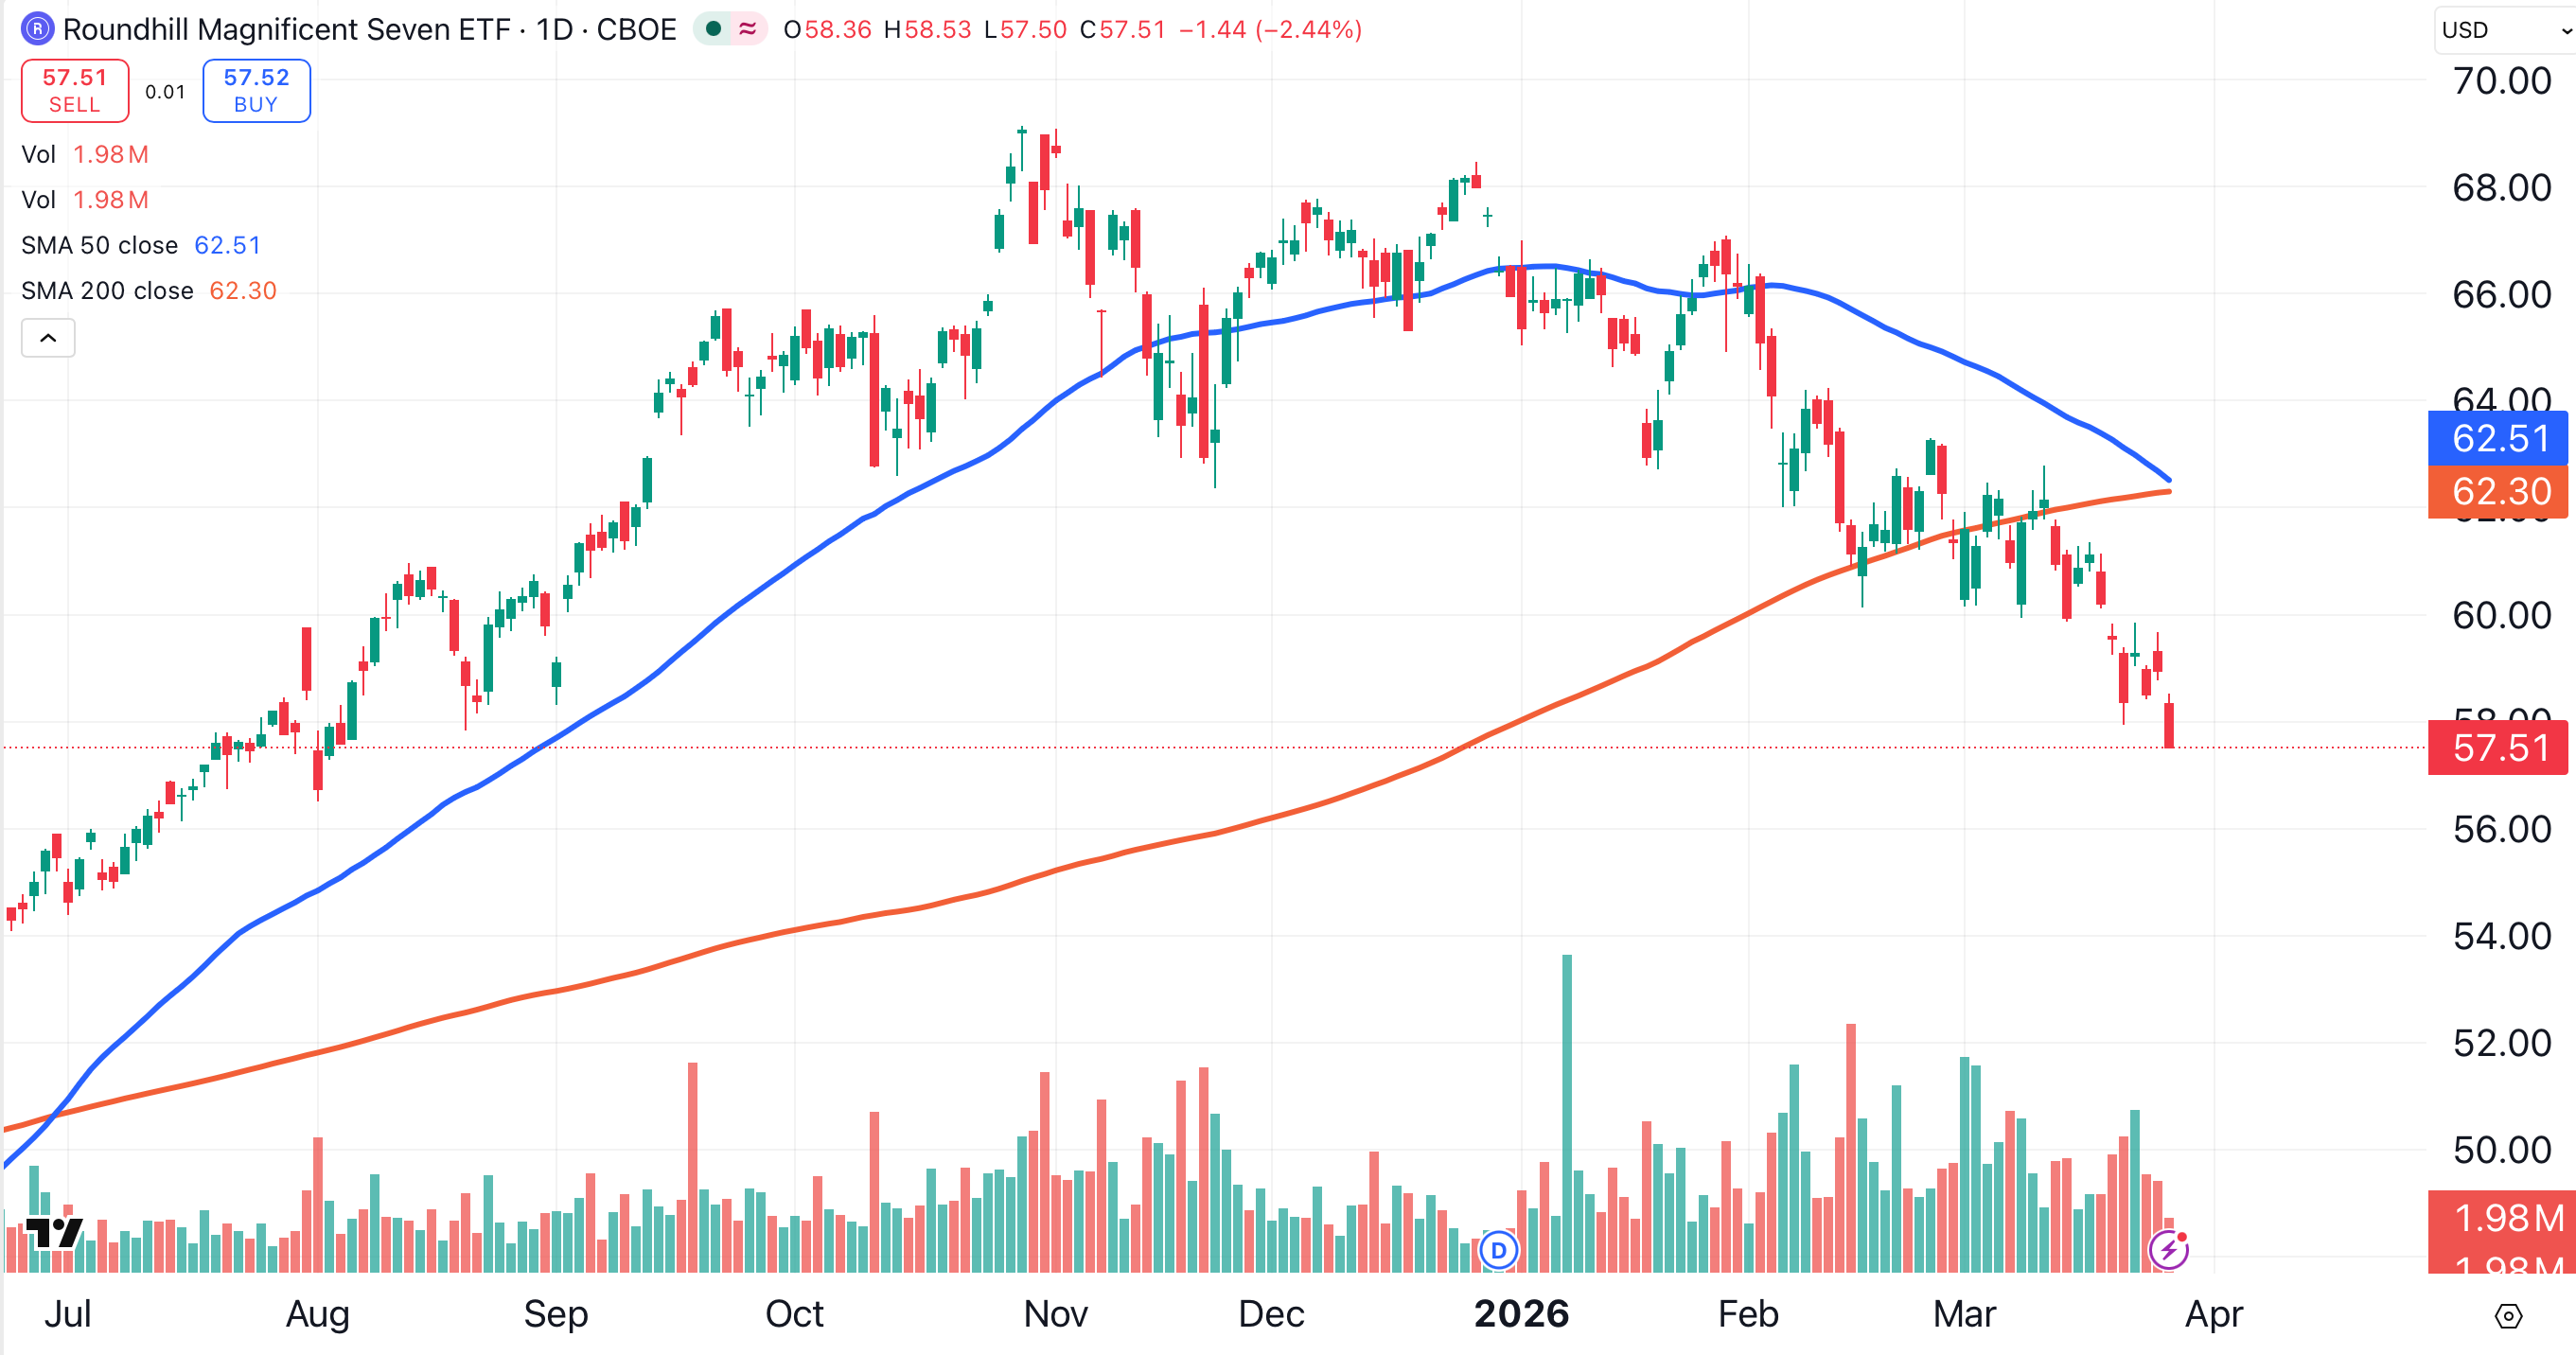
The Magnificent 7 stocks matter because all seven have a market capitalization above $1 trillion. They are top-heavy components of weighted indexes like the S&P 500 and the Nasdaq Composite. Because of this, they exert outsized influence on market direction, either positively or negatively.
Let’s go through all seven, from strongest to weakest.
Hanging in There
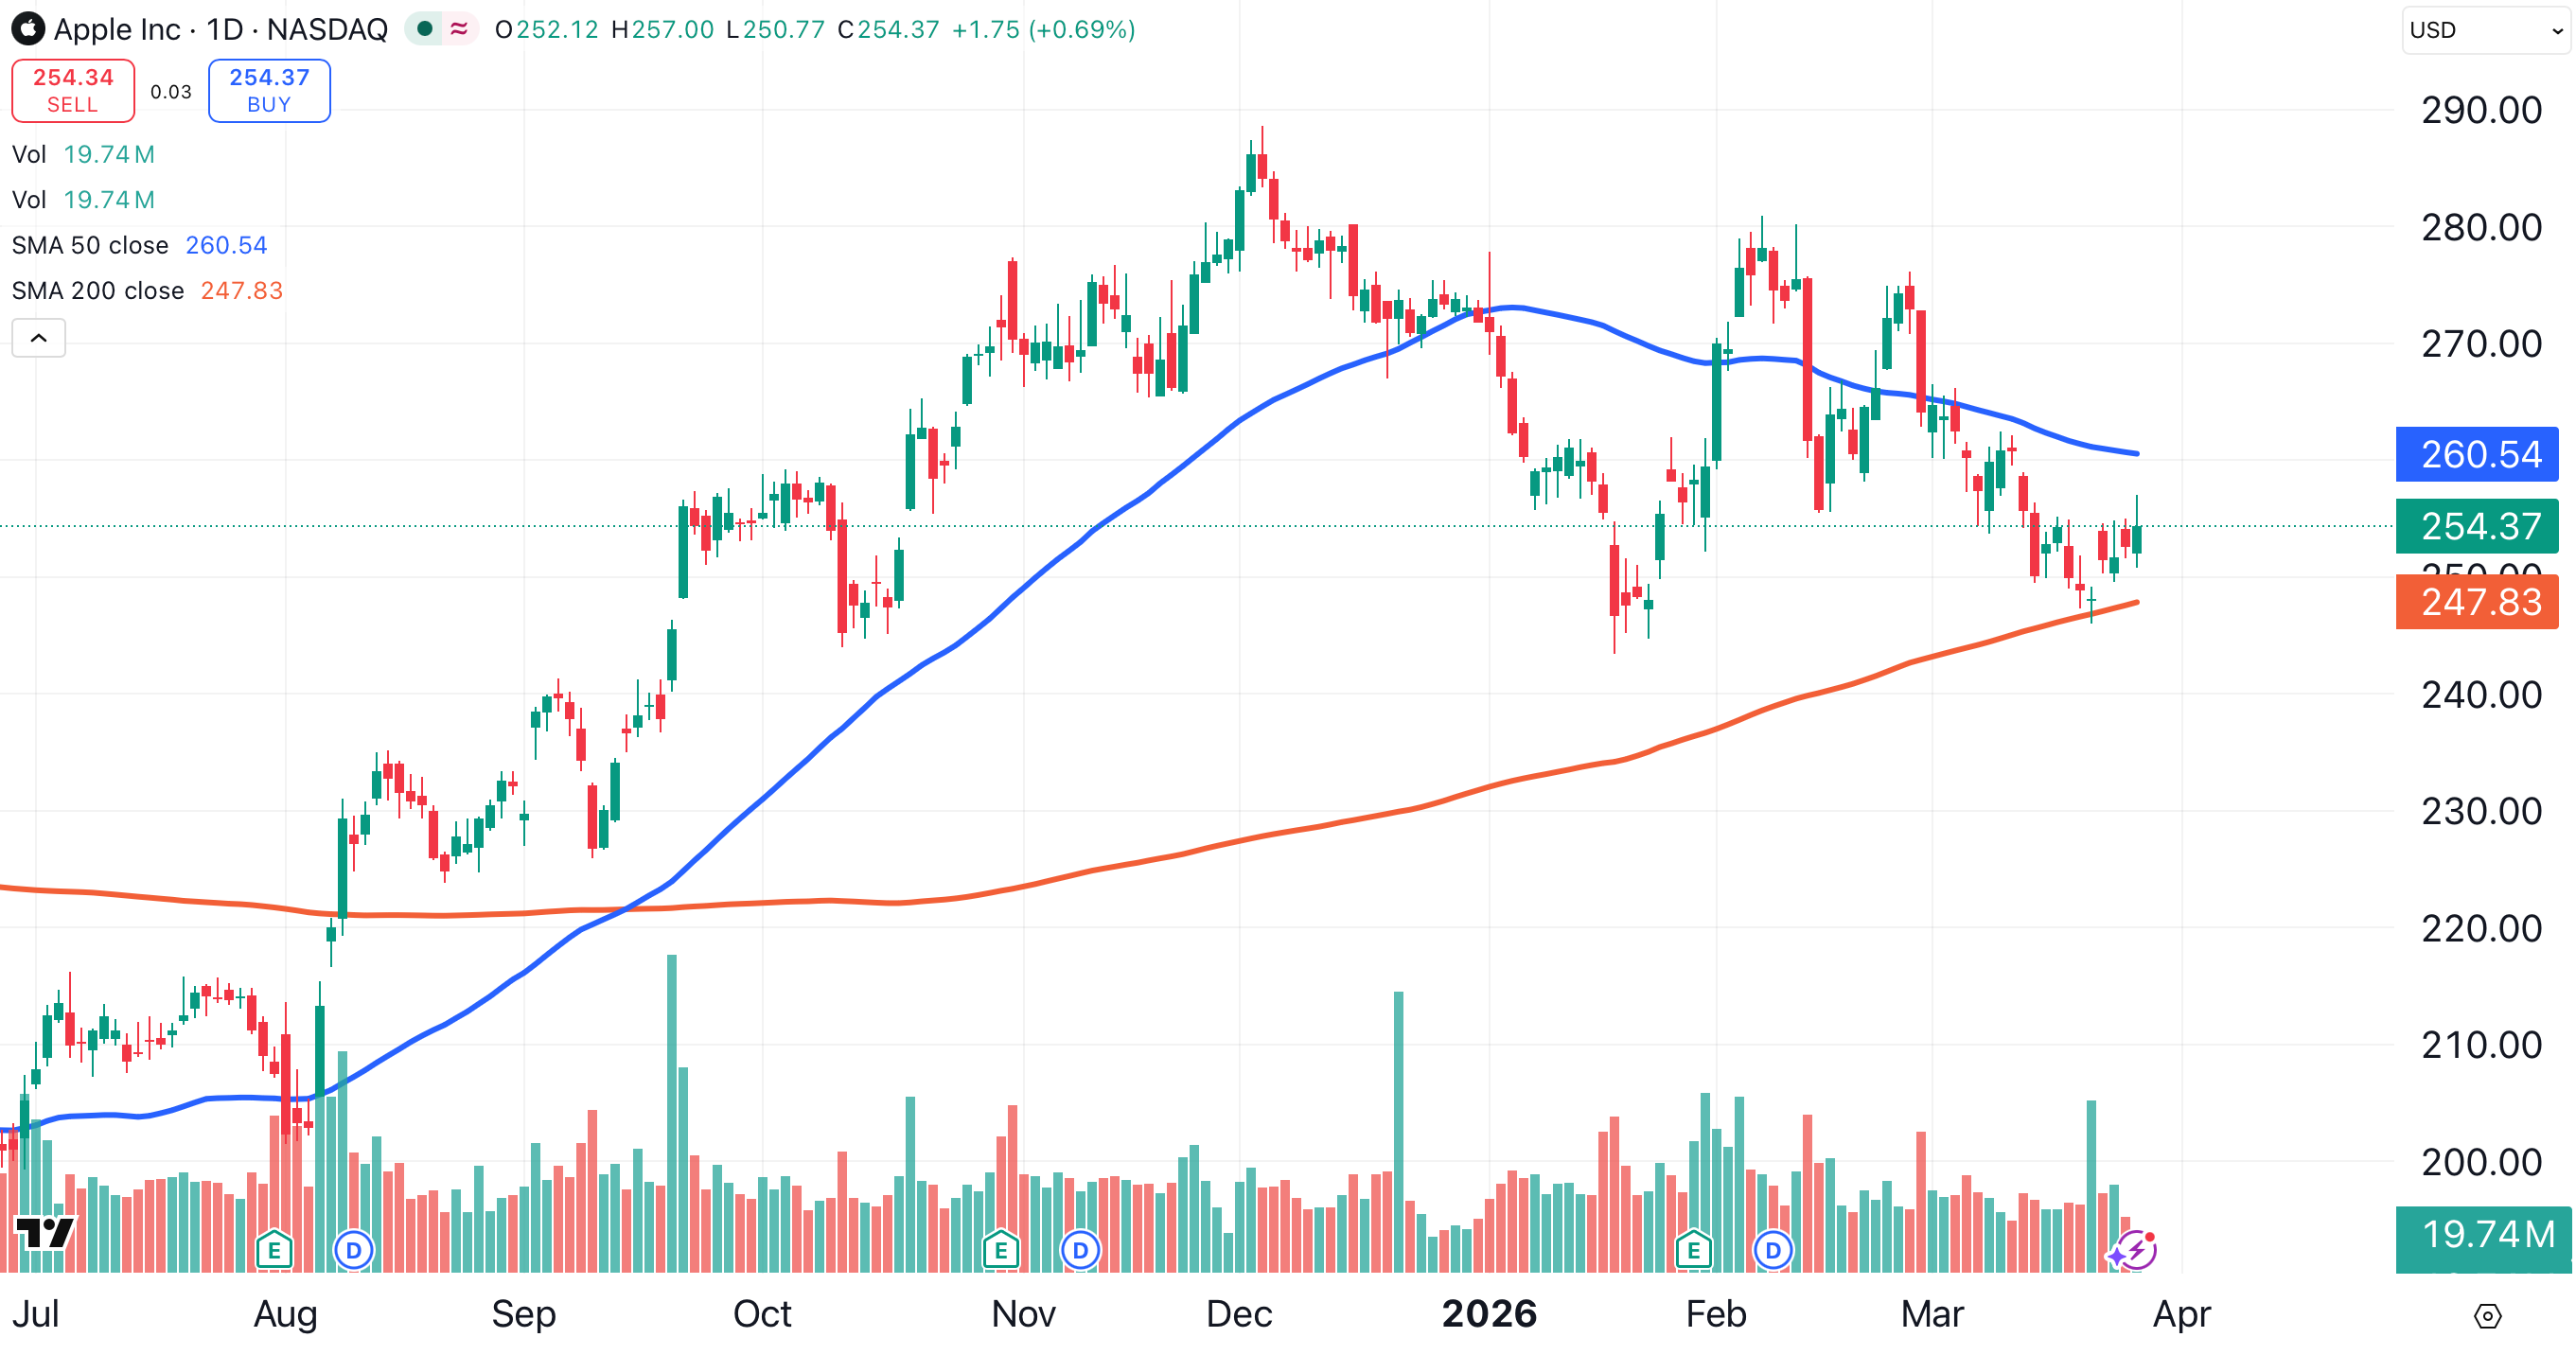
1. Apple
I’m long Apple (AAPL) and have been for years. I consider it a lifetime investment.
Apple doesn’t look great, but it’s still trading above its 200-day moving average (red).
2. Alphabet
Despite reaching a four-month low on Thursday, Alphabet (GOOG) also remains above its 200-day moving average (red).
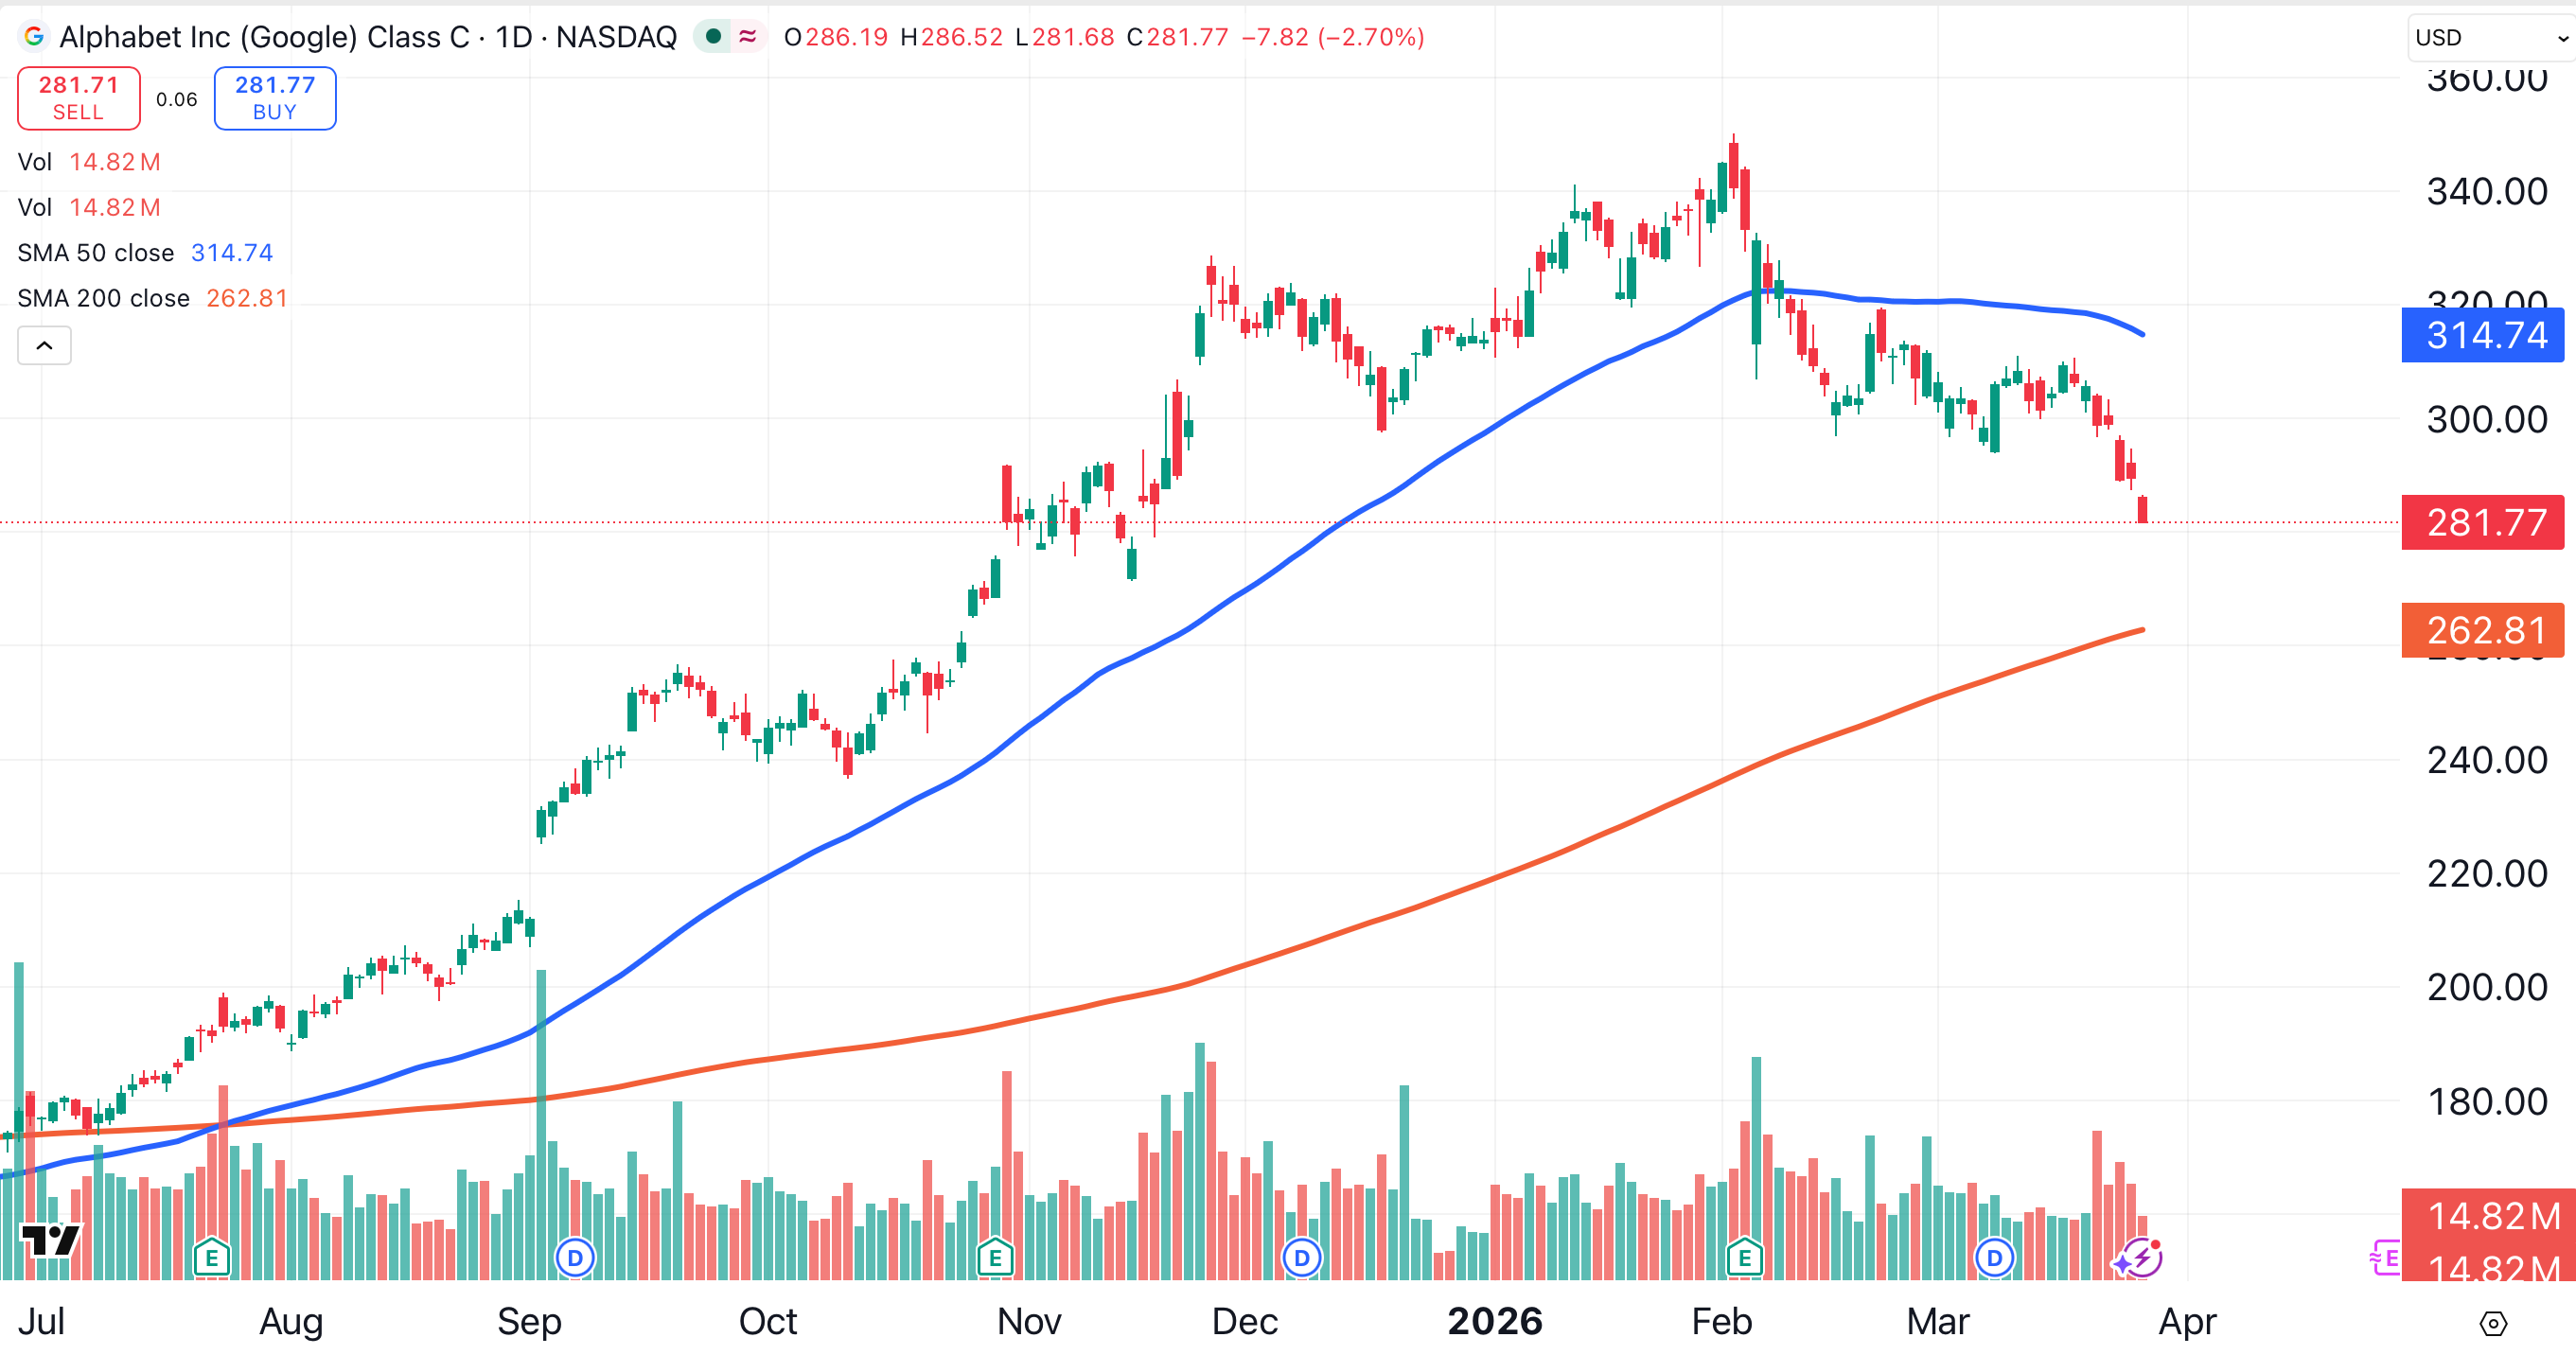
That’s more than I can say for the S&P 500, the Nasdaq Composite and the Dow Jones Industrial Average. All of those indexes have closed beneath their respective 200-day MAs for at least six consecutive sessions.
Only the Russell 2000 remains above its 200-day MA. This article explains why the R2K is leading the pack.
Apple and Alphabet are the only Mag 7 names trading above their 200-day MAs.
Hanging By a Thread
3. Nvidia
Nvidia (NVDA) has slipped below its 200-day MA (red), but remains within a sideways range (shaded yellow). Unfortunately, Nvidia is near the bottom of that range, which ends at approximately $170.
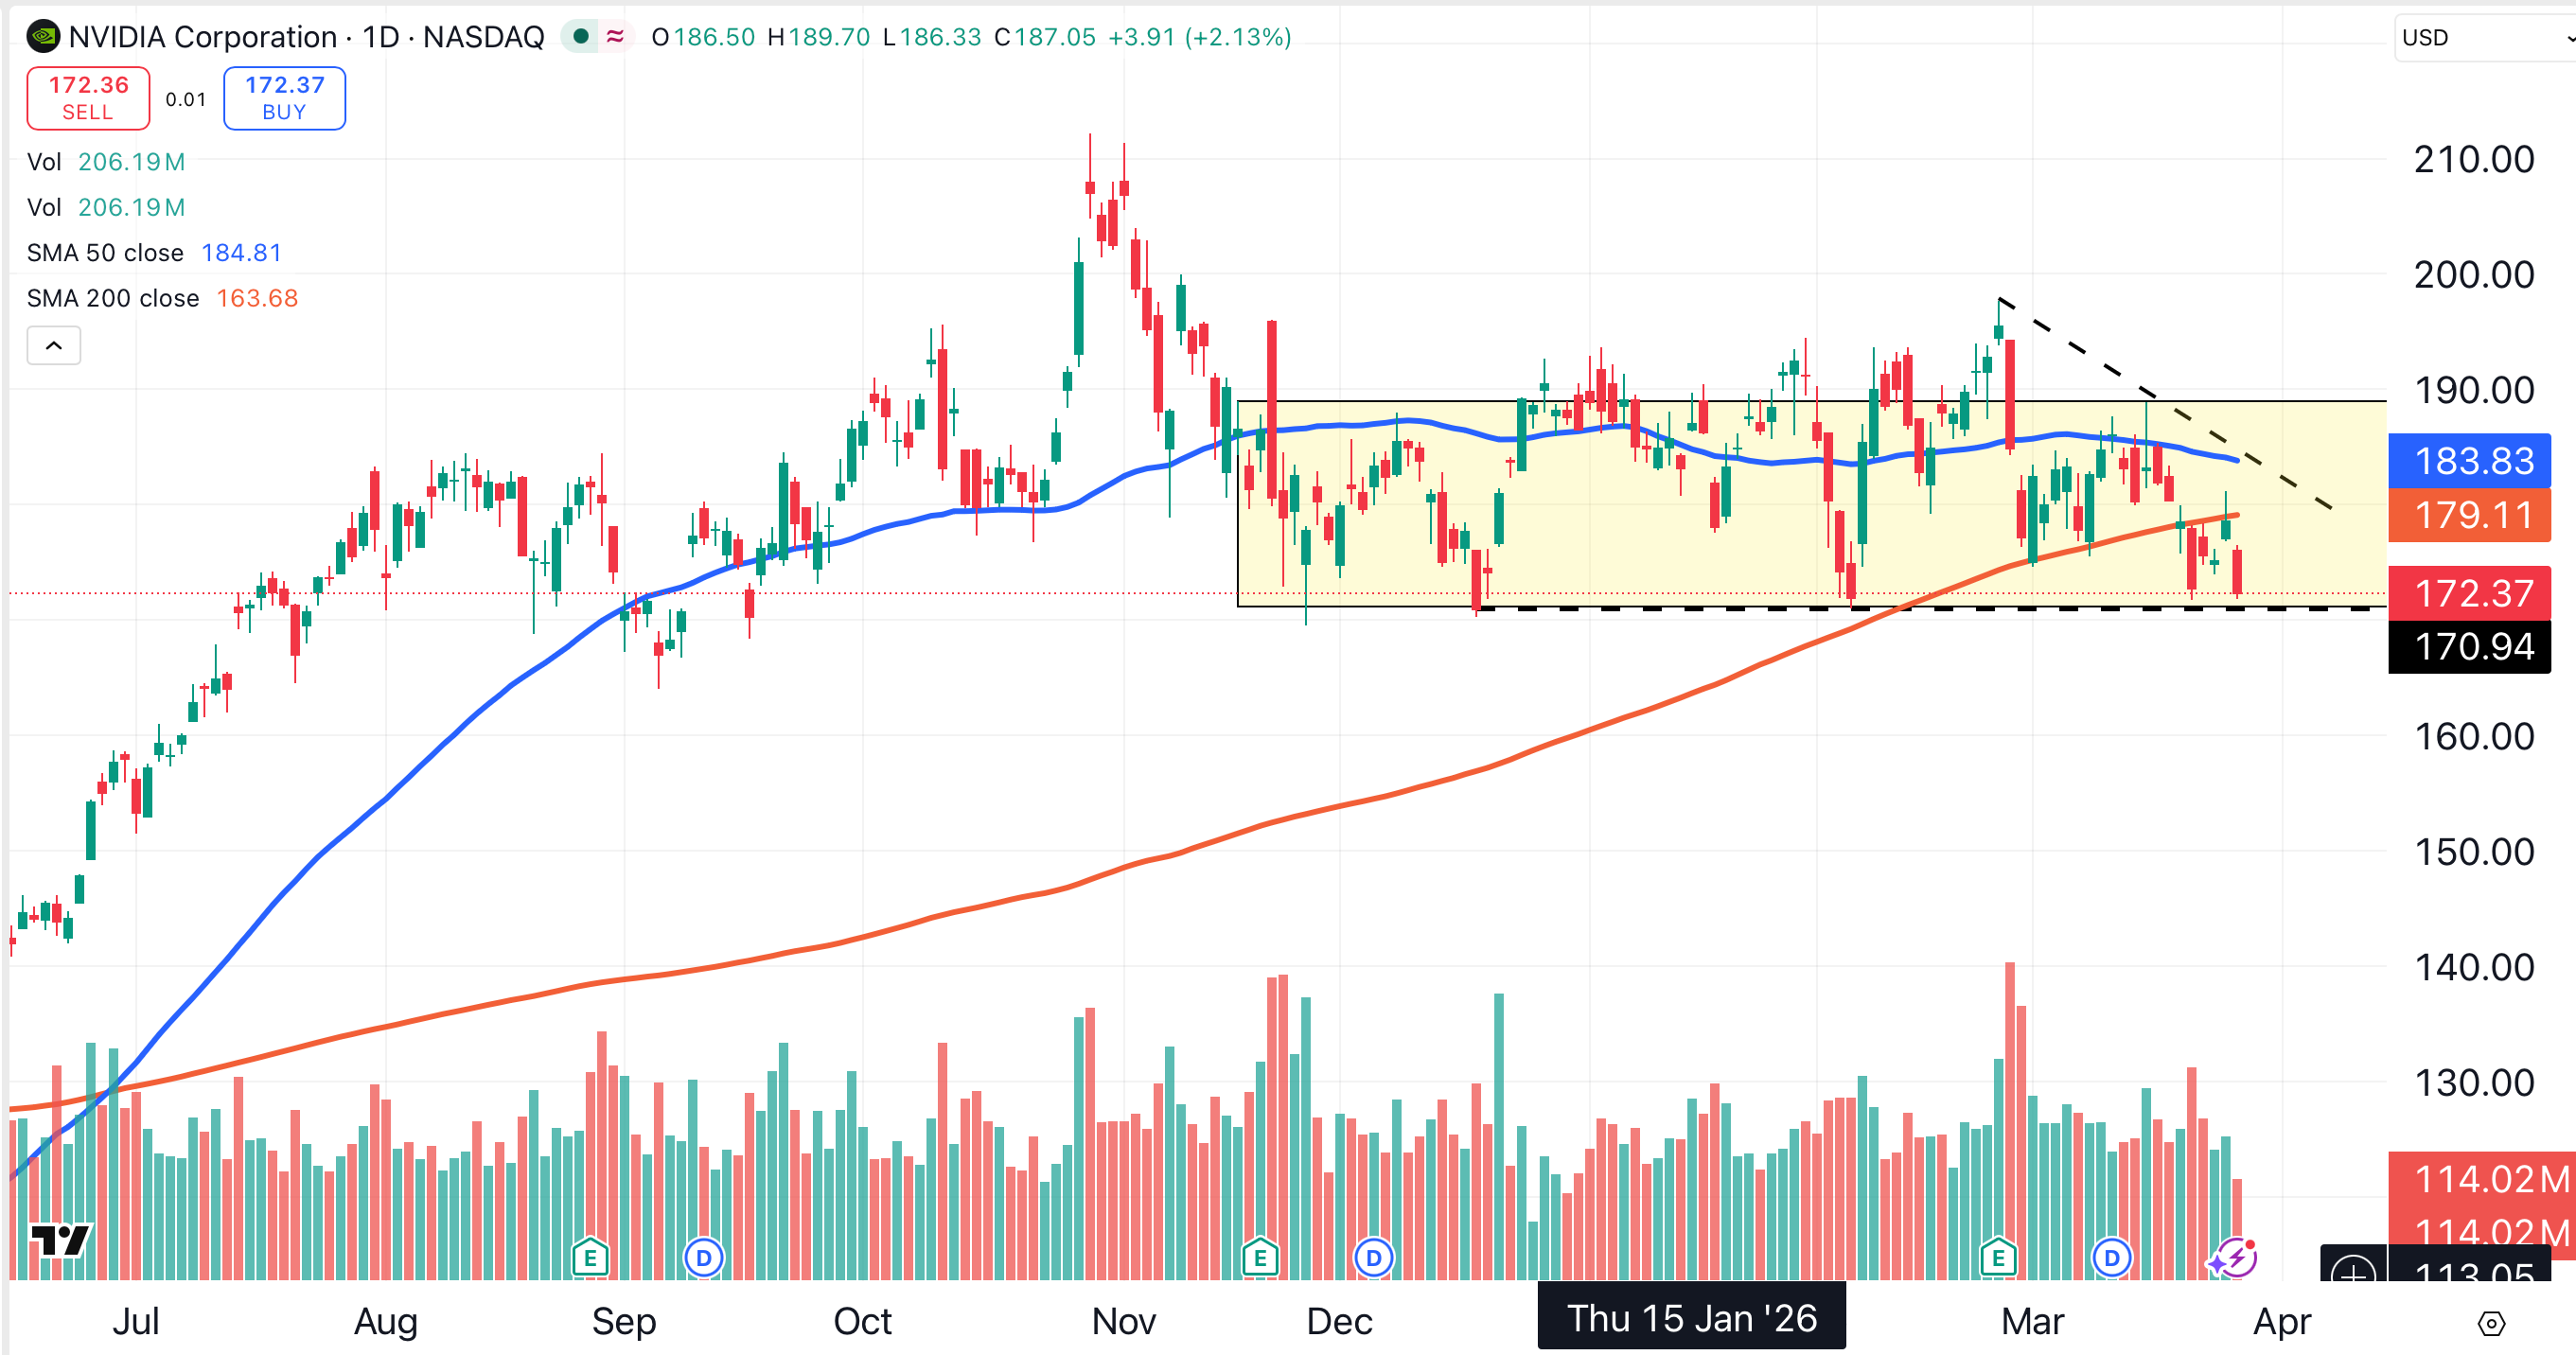
As long as Nvidia remains above $170, shareholders can relax. If it falls below that level, this $4.1 trillion mammoth could generate additional selling, pulling the indexes lower.
4. Tesla
Despite breaking support and falling below its 200-day MA, Tesla (TSLA) is also hanging tough. The EV and robotics company is holding firm just below resistance of $385.
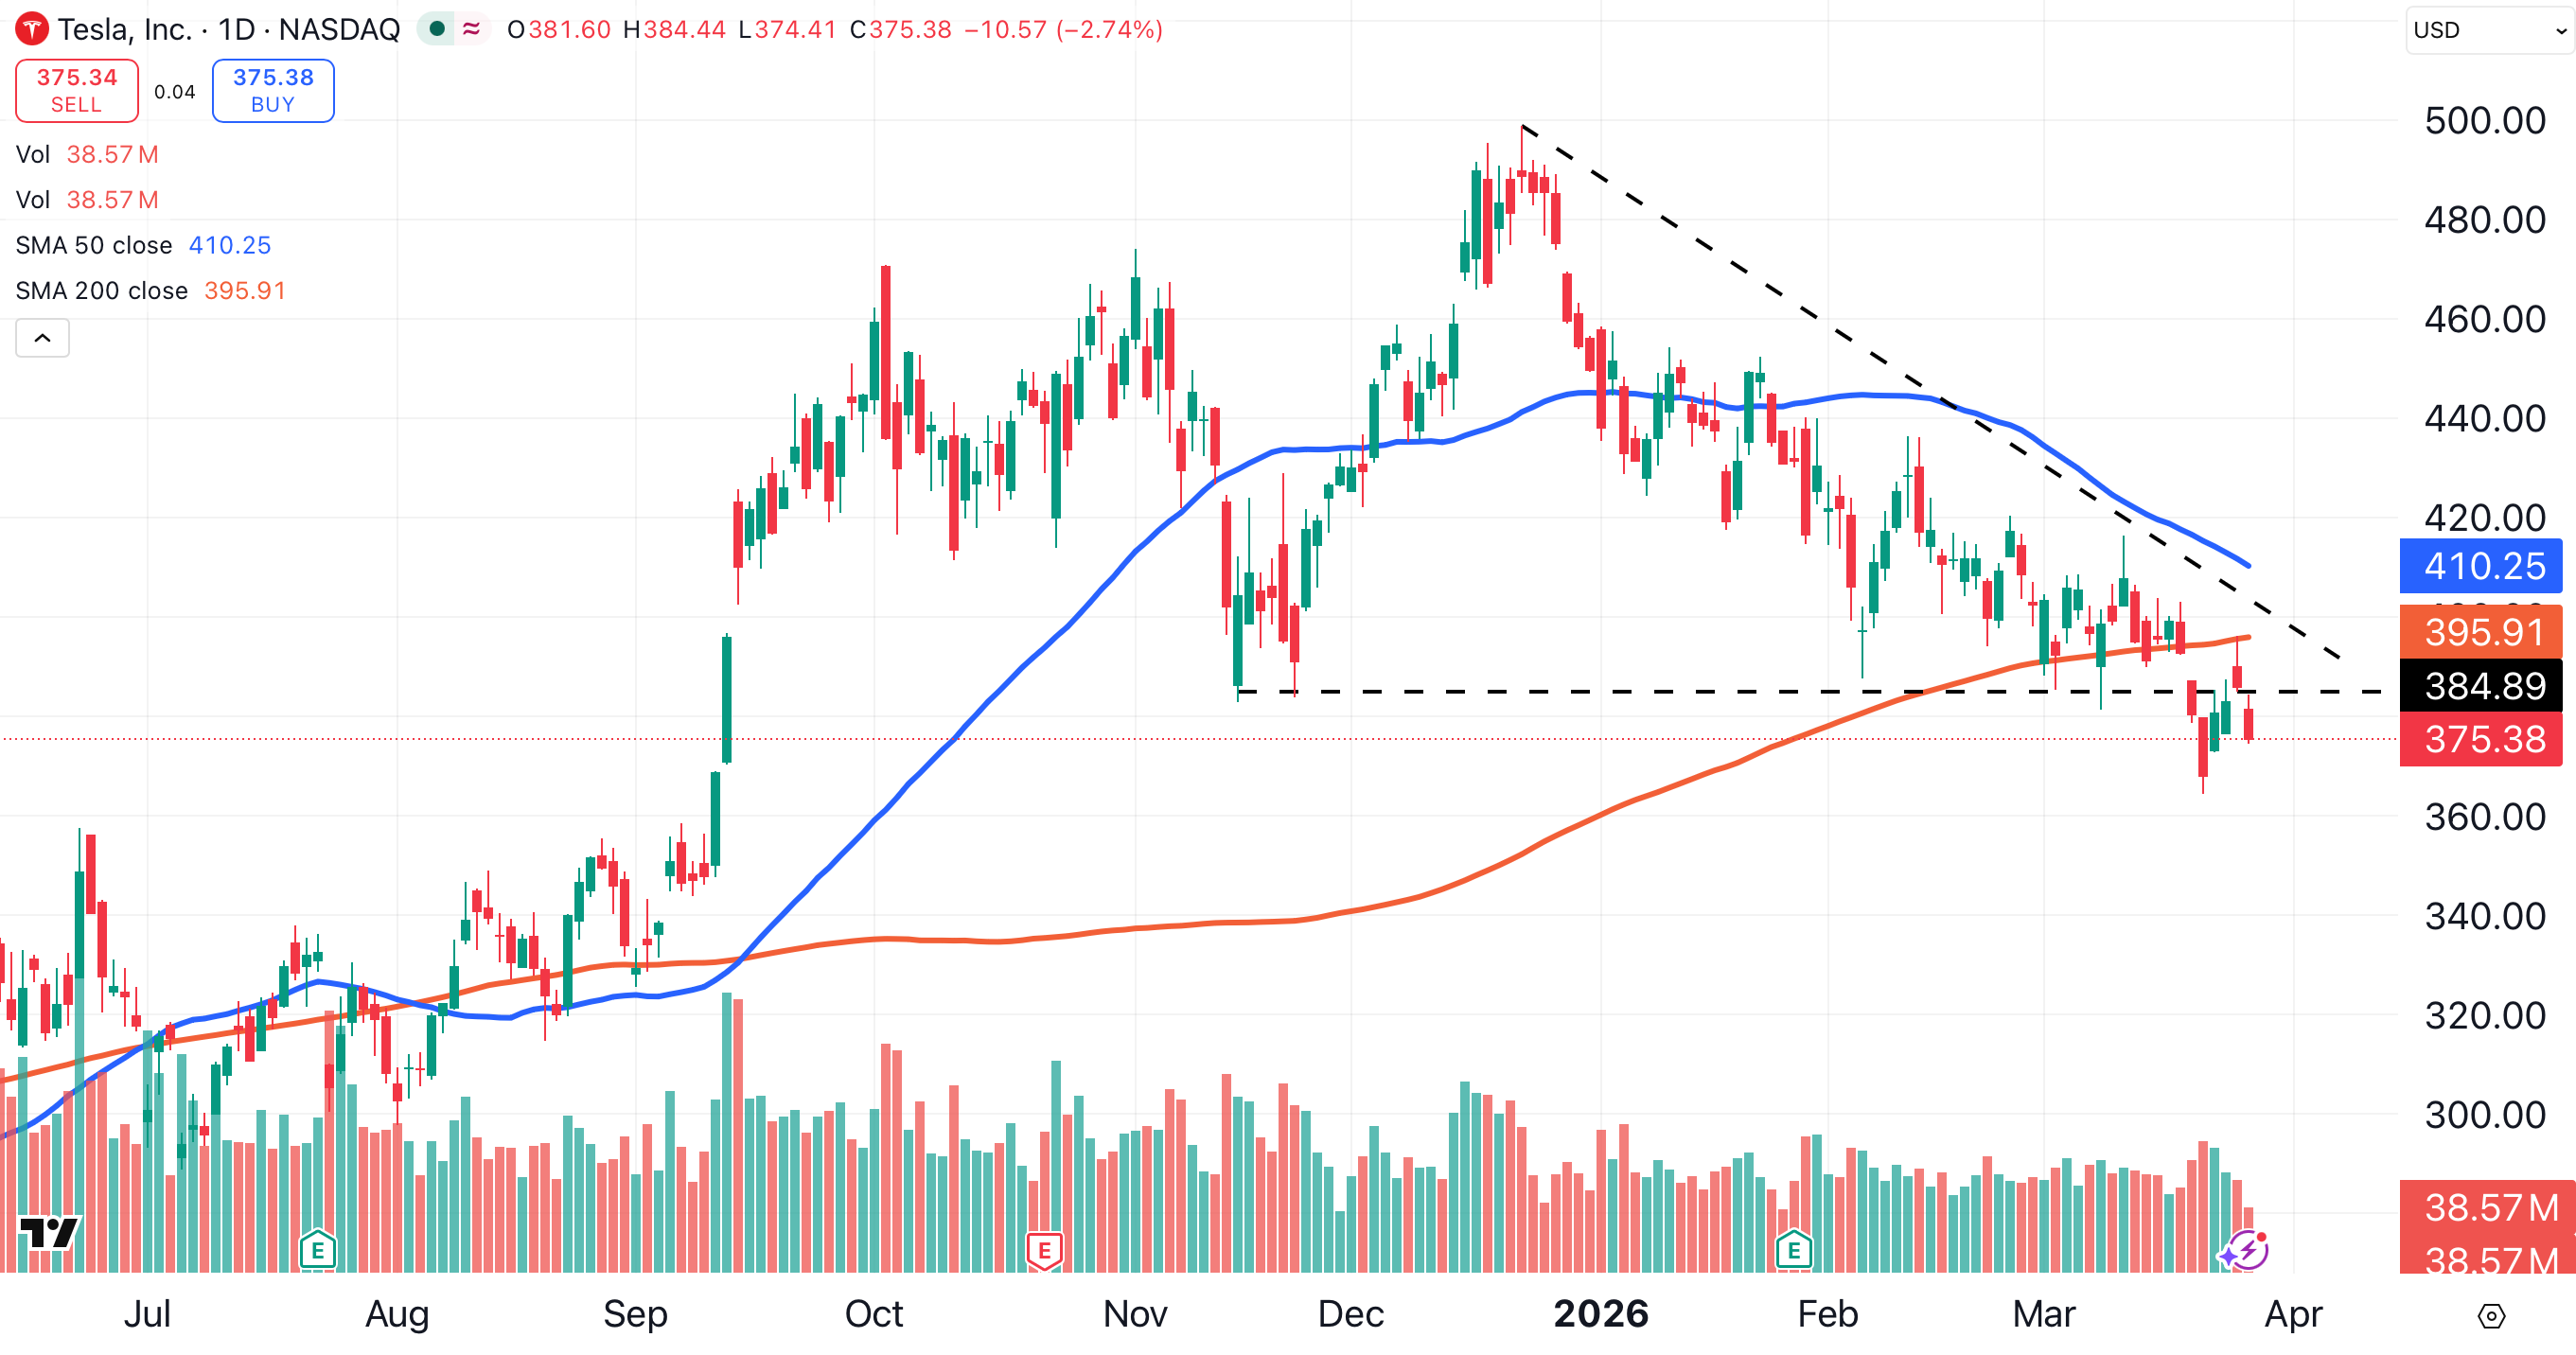
Tesla is still at a point where a decent bounce could place it back above resistance at $385, and above its 200-day MA at $395.
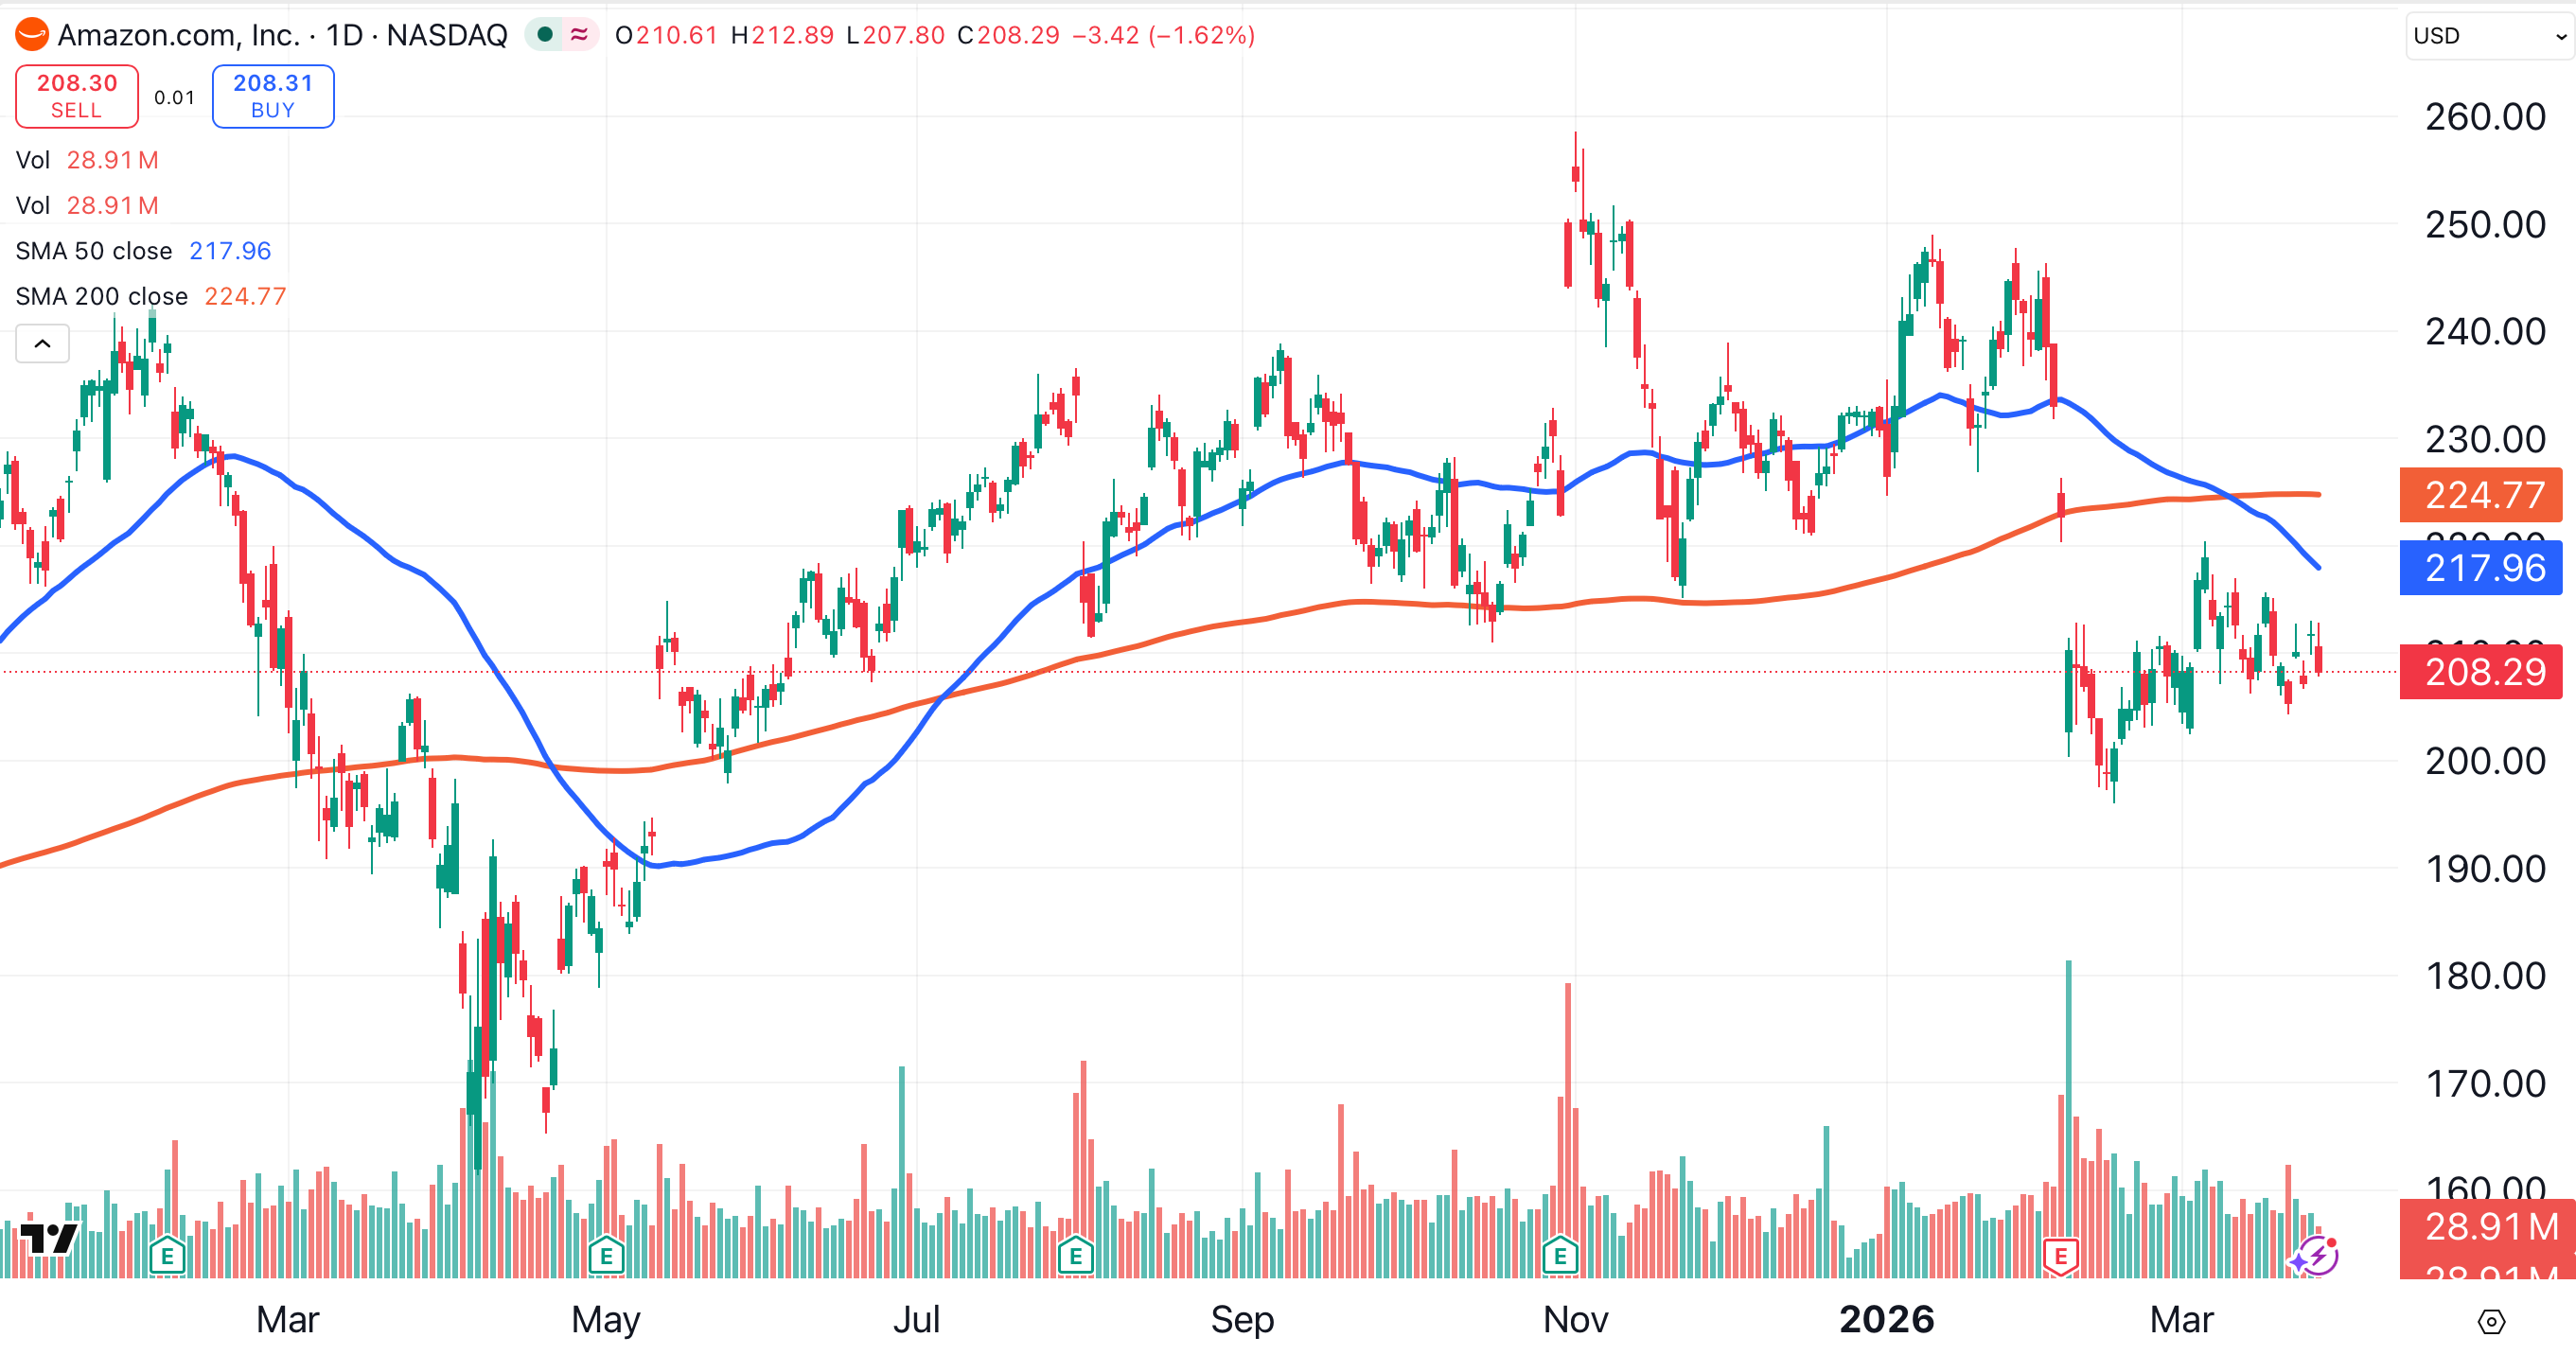
5. Amazon
Amazon (AMZN) is in a similar position, consolidating just below support, and not far below its key moving averages.
Hung Out to Dry
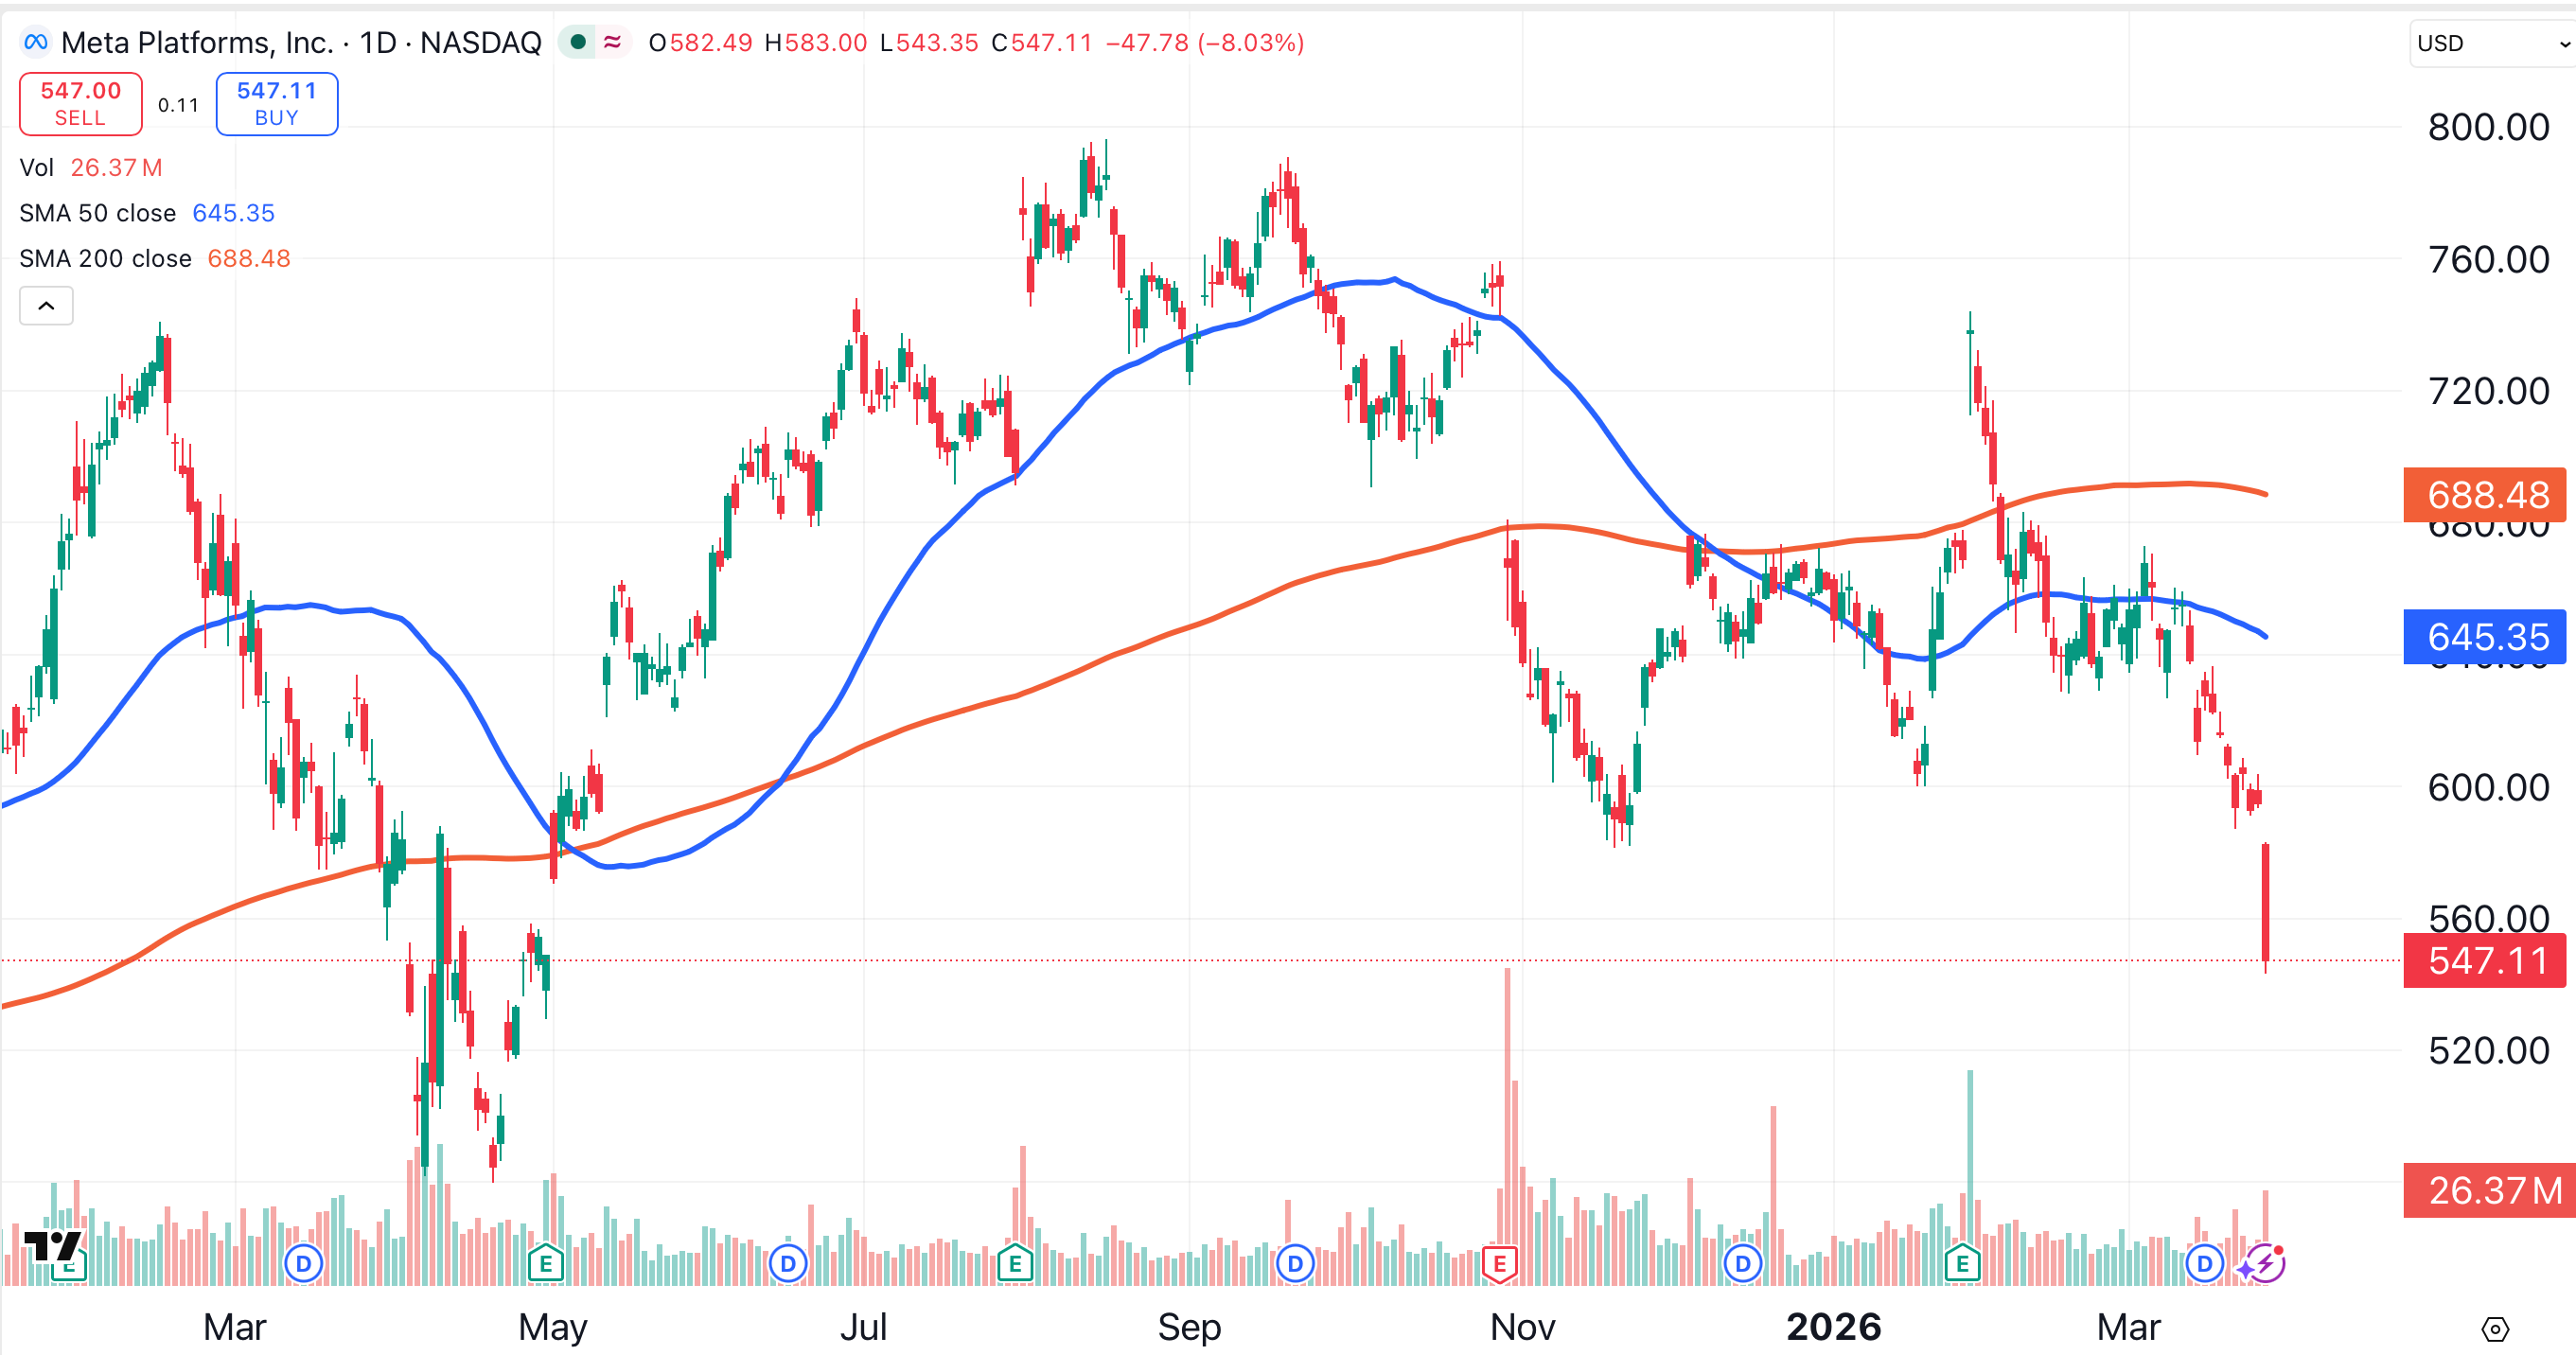
6. Meta Platforms
After losing a landmark court case, Meta Platforms (META) dropped 8% on Thursday to reach its lowest level in nearly a year. Meta is trading well below its 50- and 200-day moving averages.
Zooming out to the weekly chart, Meta has formed a large topping pattern over the past 18 months (shaded yellow).
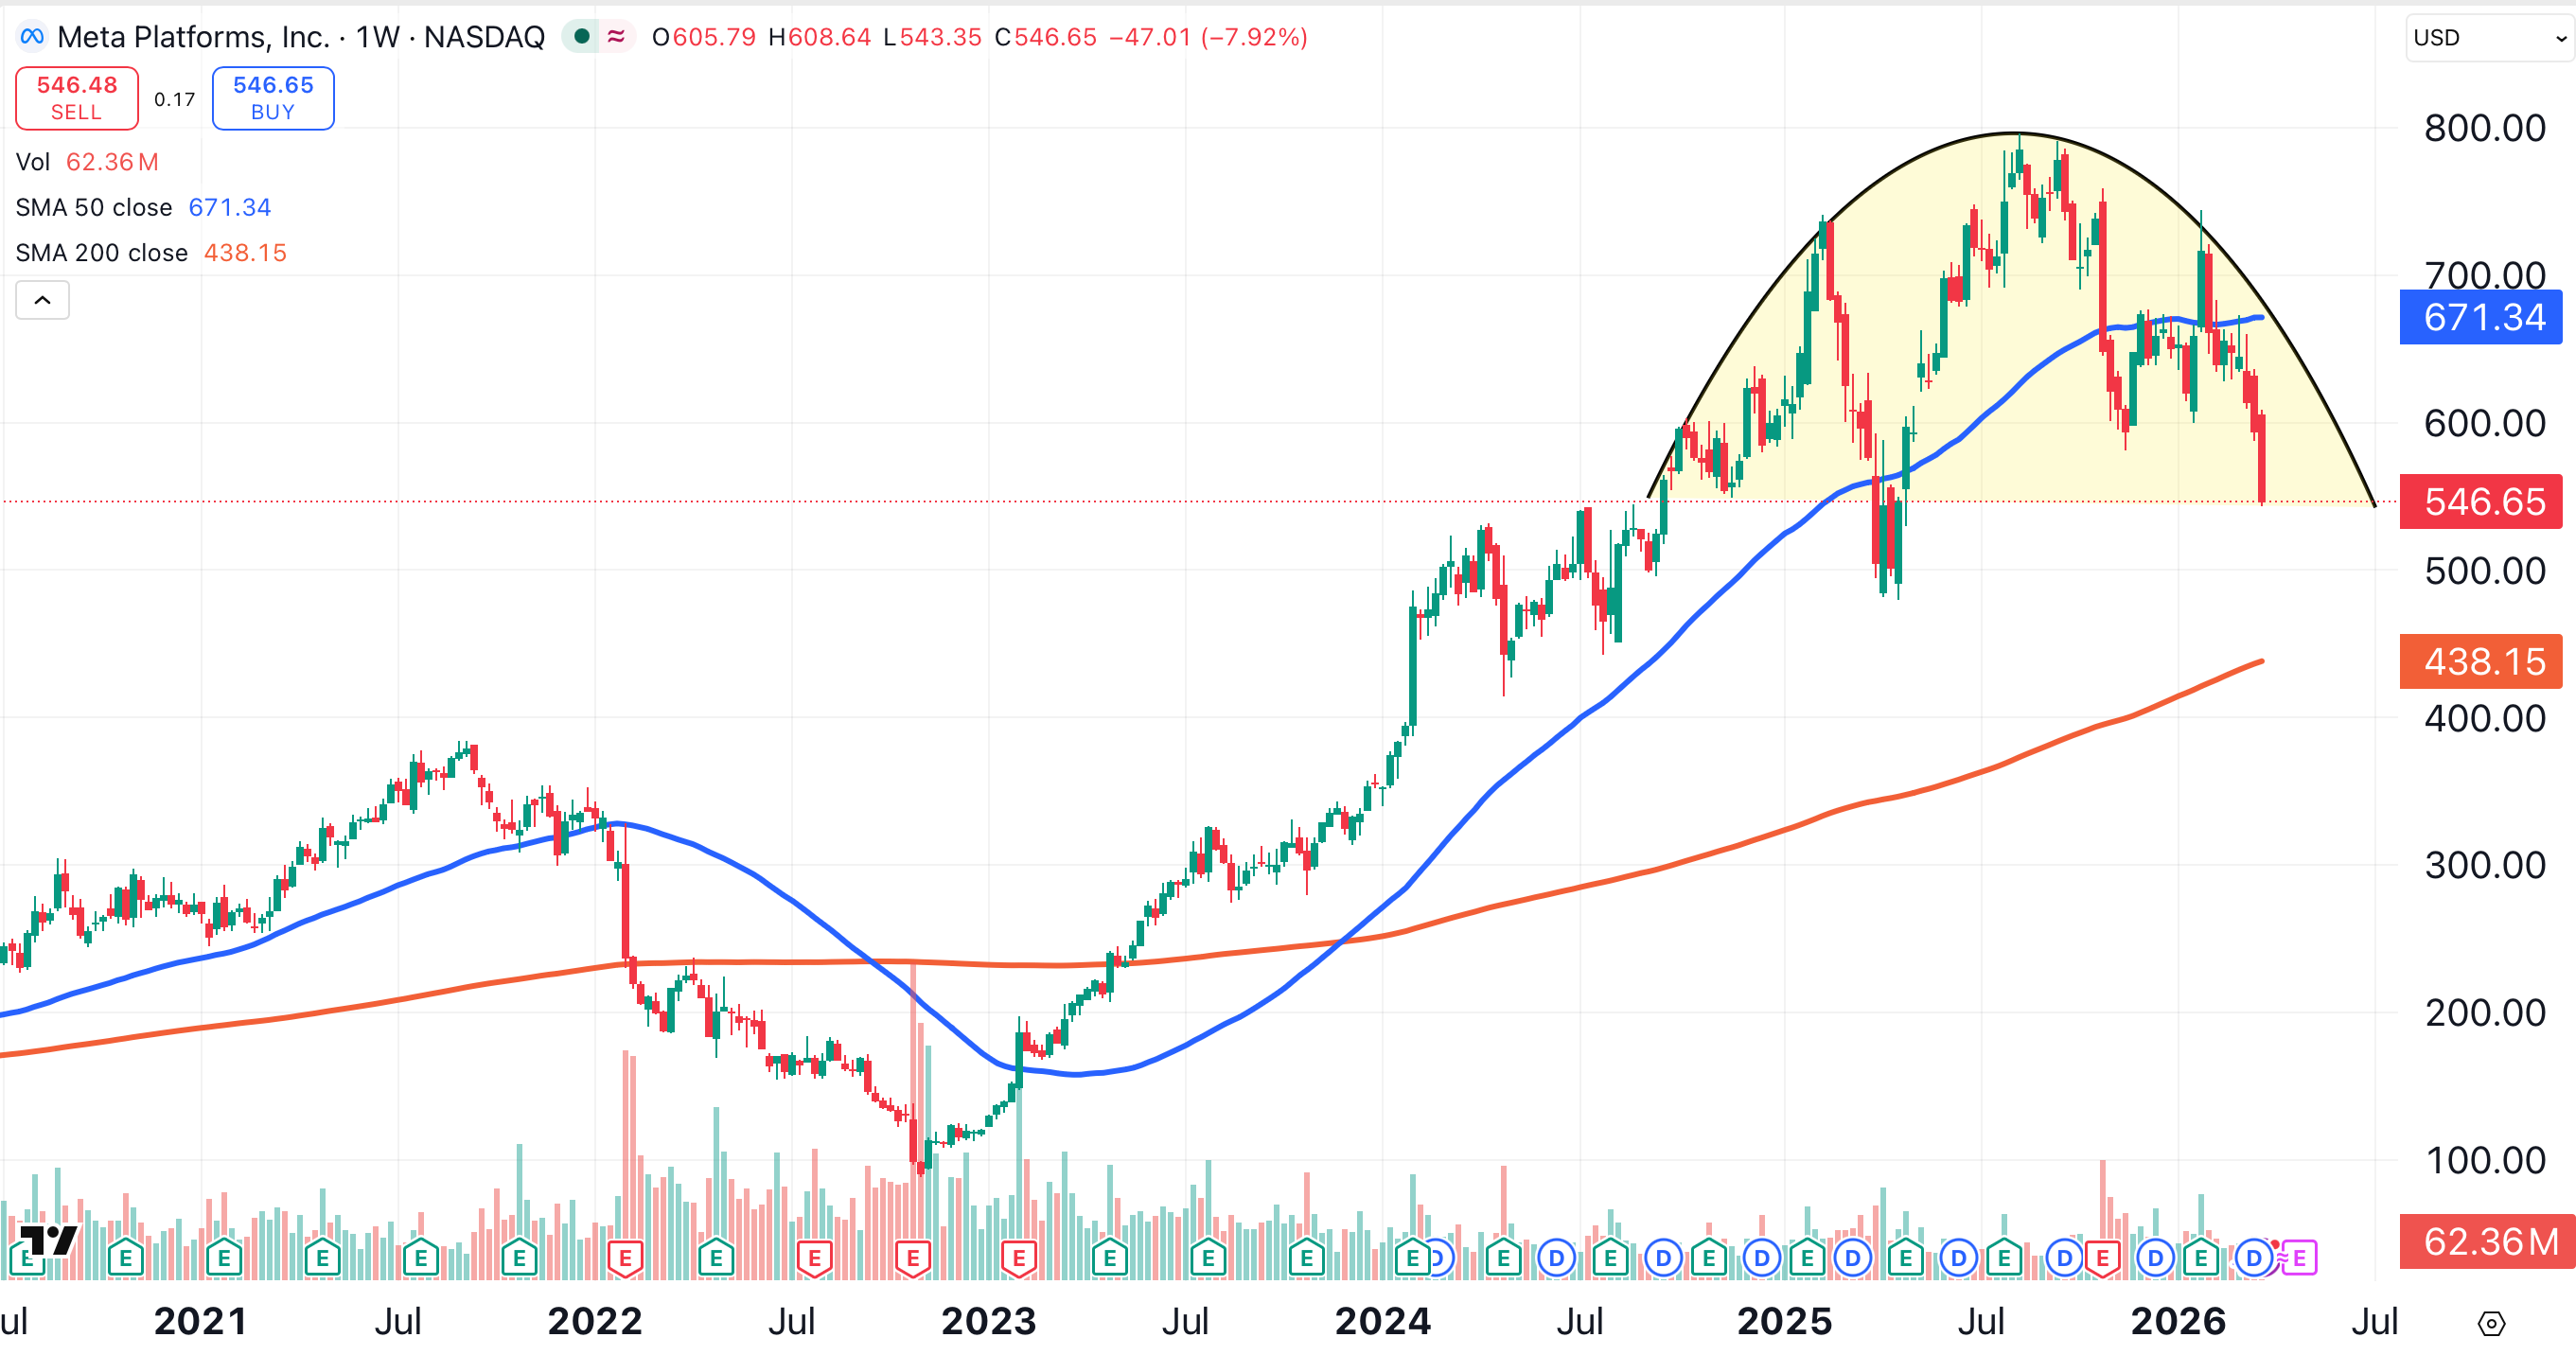
Since this is a weekly chart, Meta is trading below its 50-week moving average (blue), which is considered similar to a 200-day MA.
The red line on this chart is the stock’s 200-week MA, which could still act as support. A 200-week MA could be considered similar to a 1,000-day MA.
7. Microsoft
Microsoft (MSFT) is the weakest of the group. On the weekly chart below, we see Microsoft breaking its 200-week moving average. Also broken is a trend line dating back to late 2022 (black dotted line).
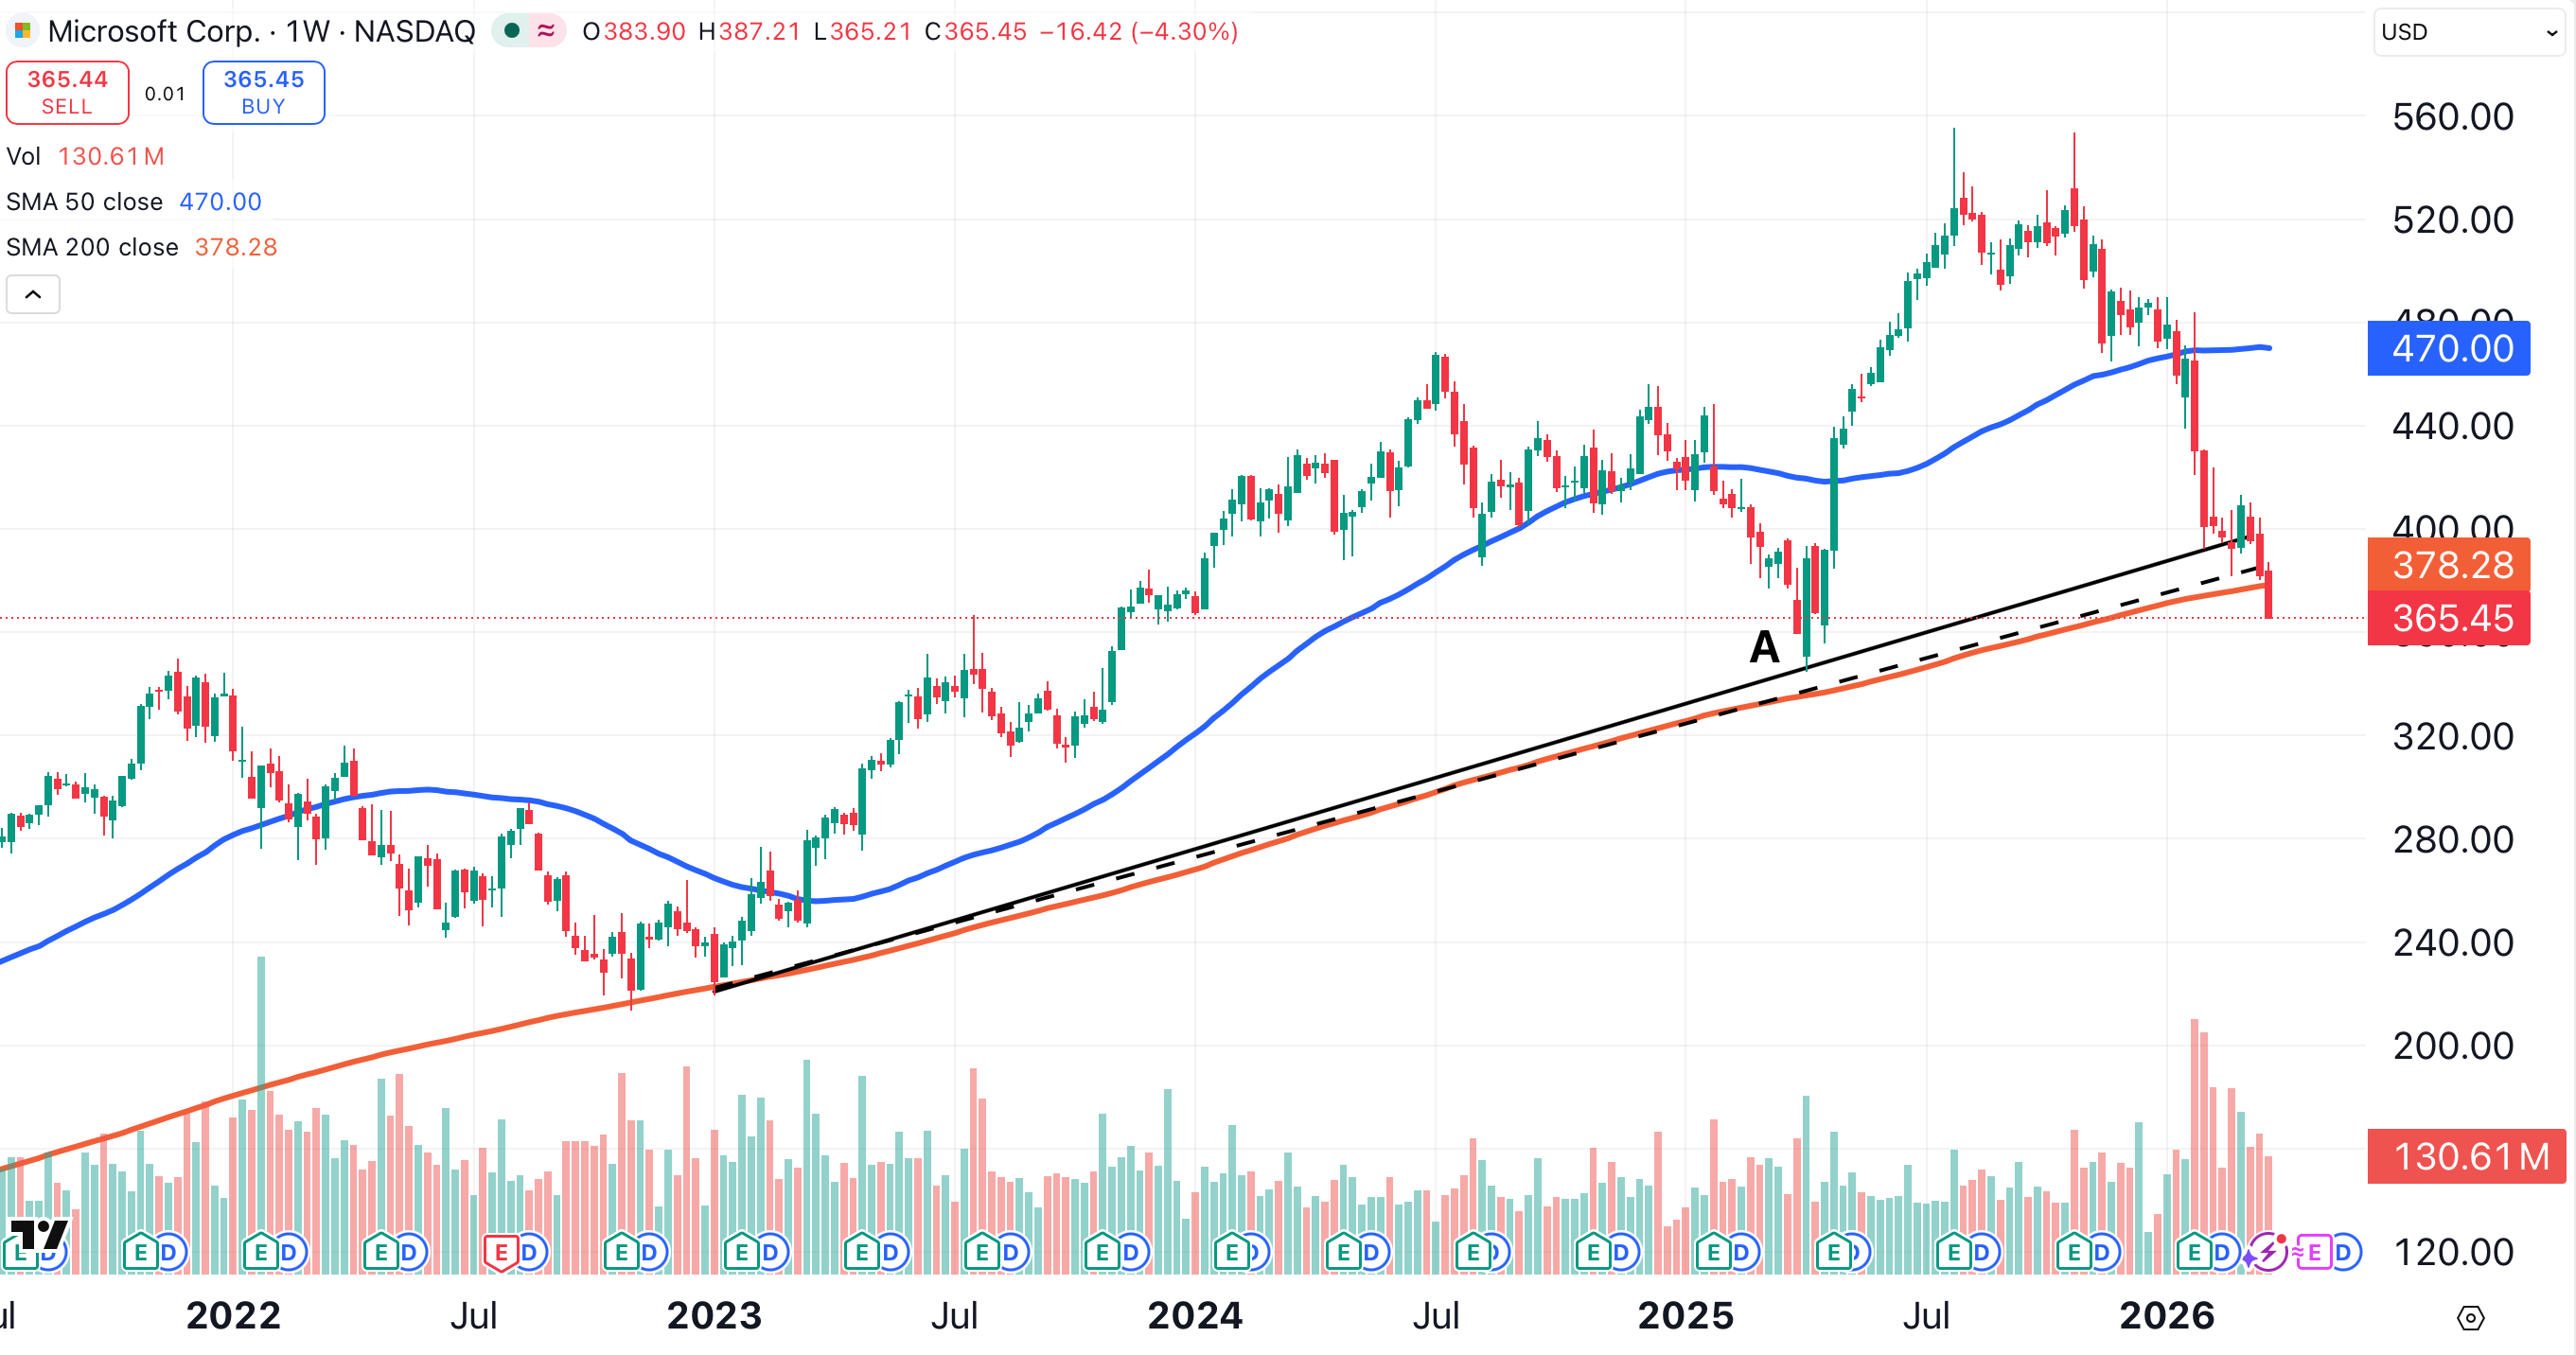
Microsoft is the only Mag 7 stock to fall below its 200-week moving average. The stock could find support near $344, a major low point from April of last year (point A).
Related: Asia Preps for Worst-Case Energy-Disruption Scenarios
At the time of publication, Ponsi was long AAPL, TSLA and NVDA.
