Can a Fed Day Move the Indicators? Not This Fed Day.
After five weeks without much of a change, the Either/Or market continues unabated.
You've reached your free article limit
You've read 0 of 1 free Pro articles.
The Market
Just in case you thought today, a Fed Day would change the indicators, I am here to report that no, the indicators still haven’t changed.
We are now working on the fifth or sixth week of this, something I am not sure I have ever seen. In any event, breadth closed the day absolutely flat. We can say that’s bearish because it was up so much most of the day, or we can say that’s bullish considering the S&P got clocked most of the day.
My take is that this is just more of the Either/Or Market or group rotation. It’s why the major indexes act the way they do. The indexes respond to the index movers, and the rest of the market can only rally when the index movers take a day off. Thus, we slosh back and forth.
Now, on the positive side of the ledger for today, the QQQs had some pretty high volume at nearly 70 million shares, which often leads to a bounce. And the put/call ratio zipped right up to 1.07. That is the first reading over 1.0 since July 31st. The very next day, the S&P was down a hundred points. Then it went back up.
The negative side of the ledger is that, despite that big move up in the small caps –the others—early in the day, the number of stocks making new highs is still pretty sluggish. The market is short-term overbought as well.
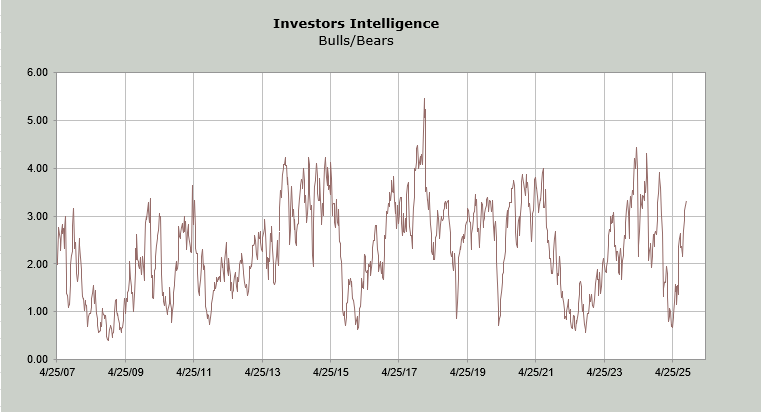
And then, there is this week’s Investors’ Intelligence survey, which has 56.6% bulls and 17% bears. Once the bulls stretch up over 55%, we’re getting a wee bit giddy (over 60% would be downright giddy). The ratio of bulls to bears is now at 3.3, which leans high, although more recently it’s only meant something once we get closer to 4.0.
I could list other negatives, but most of them haven’t mattered, such as the Transports not being able to get out of their way. So, for now, I’ll stick with my view that we should have a little pullback over the next few days.
New Ideas
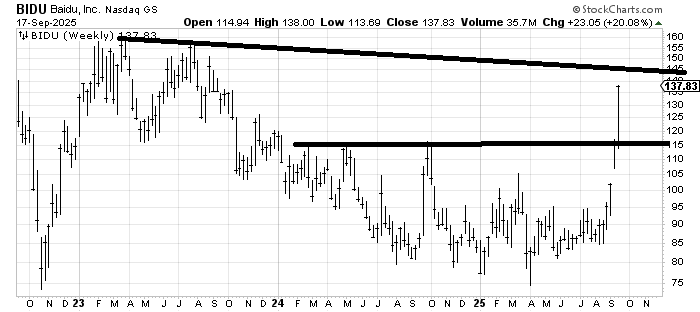
When I recommended Baidu BIDU a few weeks ago, I did not expect it to be up 40% so quickly. This is a weekly chart (3 years), and there is a next measured target of 135-140 and a downtrend line that comes in around 145. If you wanted to take a little something off the table, I wouldn’t blame you at all. It needs a rest.
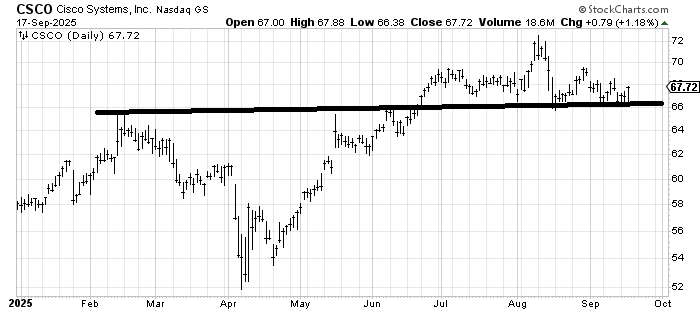
There is someone who inquires about Cisco CSCO quite frequently, and for the last few months, I have been lukewarm. I want to note that the stock has corrected by going sideways, so as long as it holds 66, I’d be okay with dipping a toe back in.
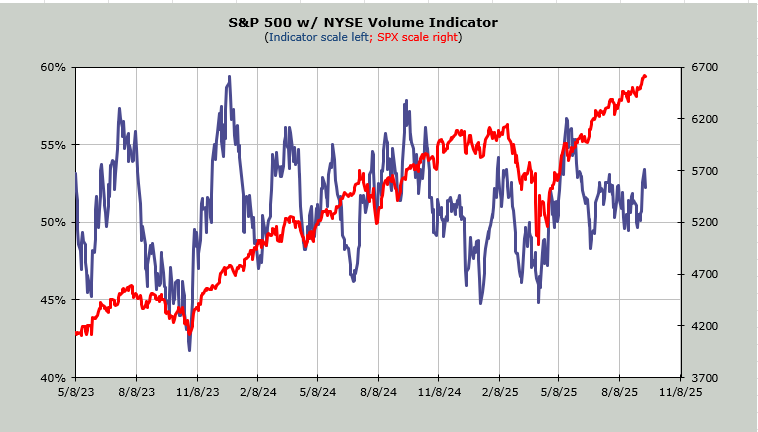
Today’s Indicator
The Volume Indicator moved! Up to 54% and right back down to 52%!
Q&A/Reader’s Feedback
Helene welcomes your questions about Top Stocks and her charting strategy and techniques. Please send an email directly to Helene with your questions. However, please remember that TheStreet.com Top Stocks is not intended to provide personalized investment advice. Email Helene here.
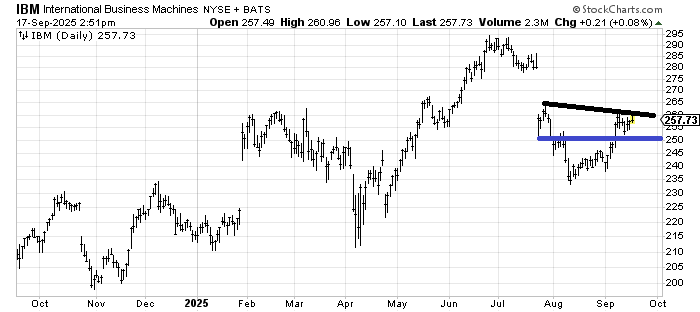
Part of me is tempted to see the pattern IBM IBM has developed since late July as a head and shoulders bottom with a target of filling that gap above. The other part of me wonders if this is the right shoulder of a much larger head and shoulders top, with the left shoulder over there in February. If IBM cracks under 250, I would think the former view is wrong.
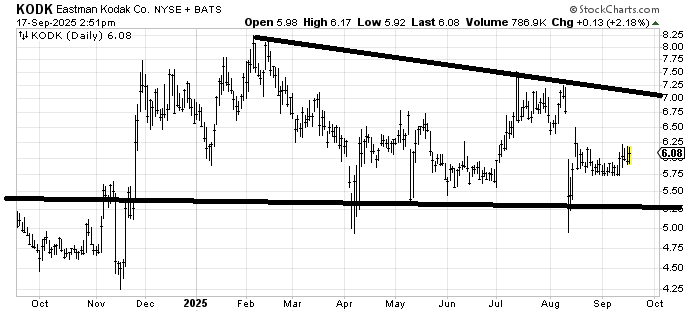
I really thought Eastman Kodak KODK had gone away, but it turns out it hasn’t. The stock hasn’t gone anywhere in nearly a year, which would make me warm up to it, but quite frankly, if it rallies, it’s probably because it’s become a meme stock. That having been said, the range looks to be 5.25 to 7.25.
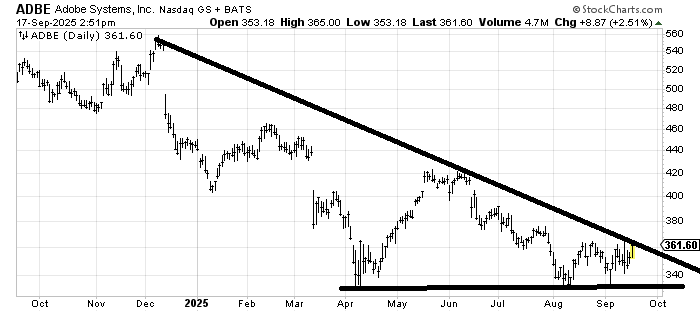
Every single time I think Adobe ADBE is bottoming, along comes an earnings report that gaps it down. With that caveat in place, if it can get over this 365-ish area, which would clear the last month’s highs and the downtrend line, it would greatly improve the chart that really does appear to be bottoming. One final note: any stock sitting near its lows in September, as we head into the fourth quarter, is a candidate for tax loss selling.
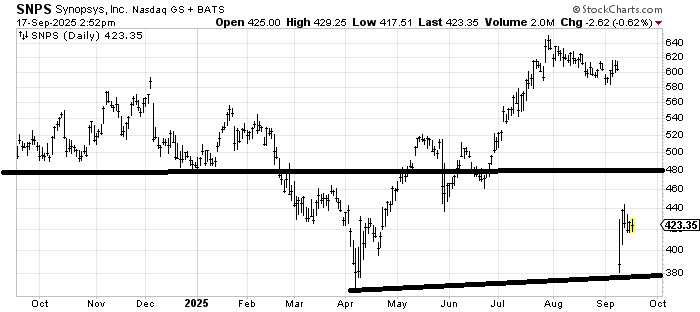
Synposys SNPS took a hit, and while I believe spike lows tend to hold on the first trip back down (and therefore the stock would be buyable for a trade should it come down there) I think there is a lot of resistance all the way back up in this chart. I’d wait for a pattern to set up before I feel comfortable buying it without watching every tick.
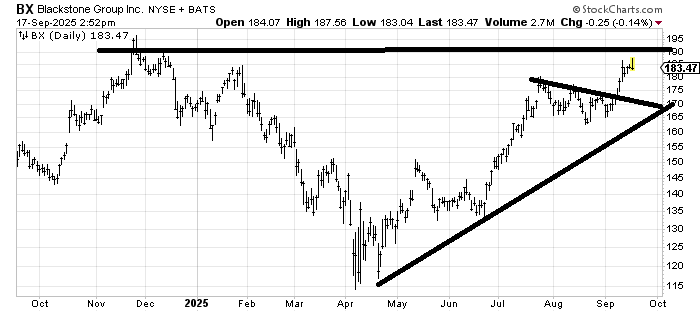
Blackstone BX is not my kind of chart with that old high still on the chart and support quite far away at 165-170. If the chart came down nearer support, I would take a stab at it because the risk/reward would be better (knowing you are wrong with a crack under that uptrend line.