Bulls Slumped. Bears Jumped. Key Stocks Broke.
Despite the declines, it was an orderly day, with little panic.
You've reached your free article limit
You've read 0 of 1 free Pro articles.
The Market
Should we start with sentiment? The AAII bulls slumped ten points to 19%, and the bears jumped 20 points to 60%. Everyone is fussing. Let me begin with my views on this (you’ve probably heard it before)
AAII is a bunch of old people, maybe 100, who point and click a survey each week. If you look at their asset allocation, which comes out monthly, so we’ll get a read on it next week, they are often fully invested even if they vote bearish.
That is not to say that these aren’t extremes. They are. And we should not ignore them. But they are the sort of extreme that works much better as a contrary indicator when there are other sentiment indicators confirming it.
Yesterday we discussed the Investors Intelligence survey, which had 44% bulls and 24% bears. So, the spread is +20 as opposed to the AAII spread, which is -40. That’s just not close.
I do however expect next week we could see the II survey at/near 40% bulls, maybe even something in the 30s. If the bears jump to the 30s as well that would be a spread worth fussing over.
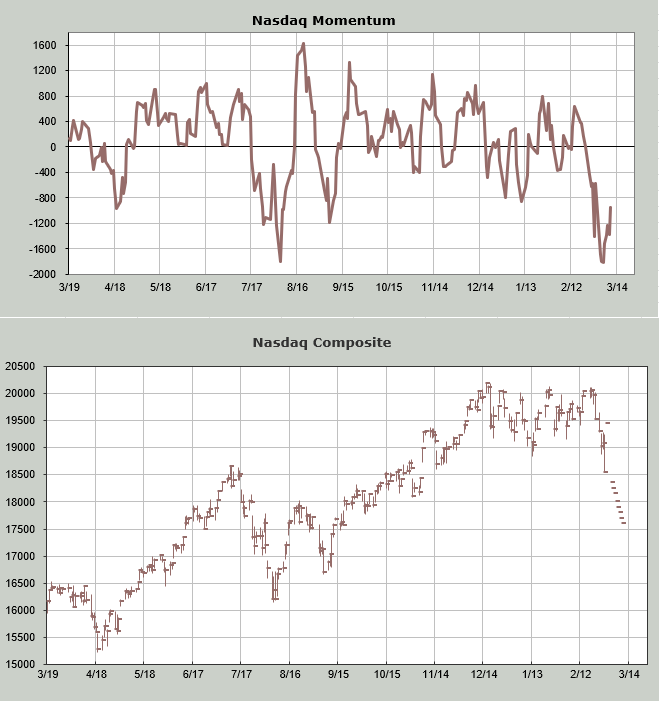
Speaking of next week, my own oscillator will get oversold around midweek next week. But I also decided it was time to do a what-if for the Nasdaq Momentum Indicator. Earlier this week I noted that it was too far away for us to consider an oversold condition. Now I can tell you that when I plug in lower closes, walking Nasdaq down nearly one thousand points over the next week we find the Momentum Indicator no longer goes down beginning Wednesday, March 5th. As a reminder, the exact day is not nearly as important as the general time frame, and we are now getting much closer.
Was there panic today? No. Not by any measure I look at. The VIX did not get jumpy. The put/call ratio did not even get into the 90s, let alone over 1.0. And downside volume was around 67% on the NYSE while Nasdaq had 70%.
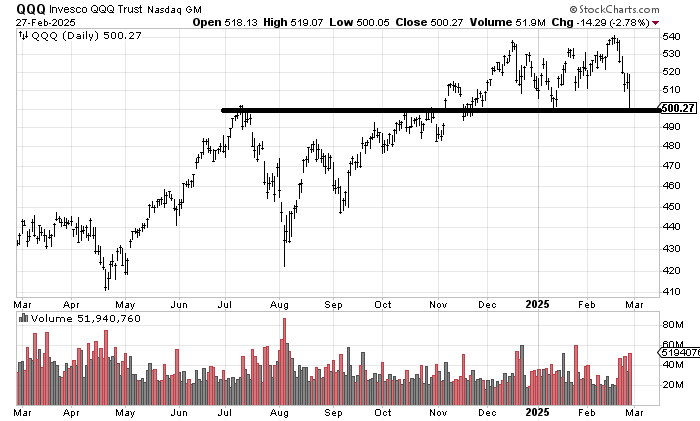
However look at the volume for the QQQs this week: each day traded more than 40 million shares. That is not excessive but it does tell a story and the story is one of selling at a clip we have not seen since last August (August was more, you can see the volume spike).
The intermediate-term indicators are not even close to oversold, though. For example, the NYSE Hi-Lo Indicator is at .50, and Nasdaq’s is at .40. It is possible we can see Nasdaq’s fall in the coming days, so we’ll monitor that.
But you saw the Volume Indicator last night, which is still in the 50s. Oversold is in the mid-40s. So right now, I’m only talking about a short-term oversold condition next week.
New Ideas
IWM broke. The SOX broke. MSFT broke.
So far, ITB is still holding, and the Transports, while down seven straight days, is still holding on by a fingernail.
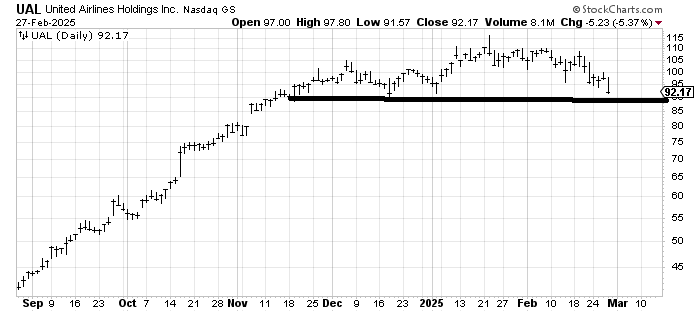
UAL UAL is closing in on the level I thought it would get to when we looked at it last Sunday. If it breaks, that would imply a much lower target, near 80.
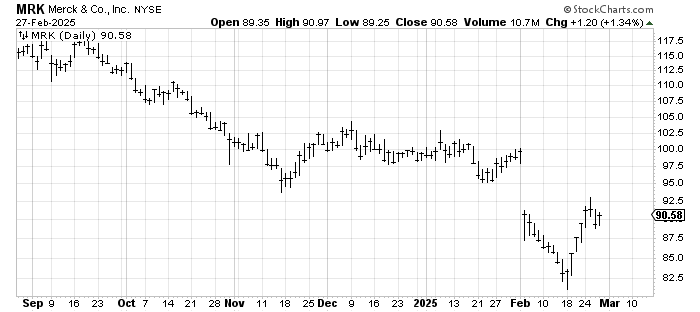
I was asked to follow up on Merck MRK, which I thought would bounce, but not this much. I then thought it could come back down to form a W. That is still a possibility, but the fact that it got into the gap tells me it is likely to fill it.
Today’s Indicator
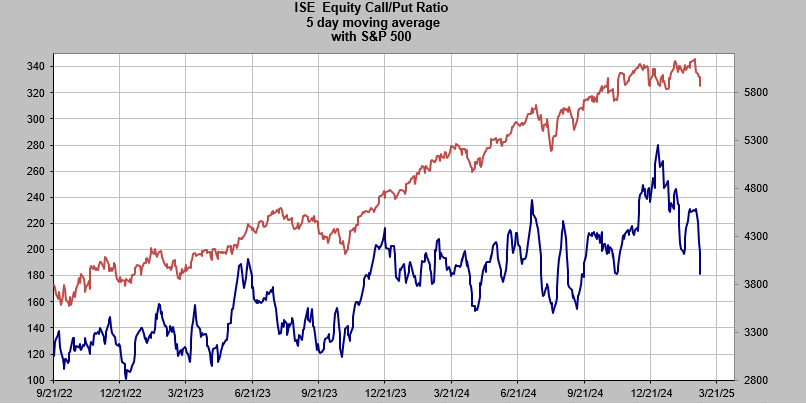
The ISE Equity call/put ratio, where we usually look at the 21 DMA, hasn’t budged much. However, the more sensitive 5 DMA has plunged to where it was in September. This goes along with the selling we’ve seen in the QQQs, which means there is a shaking of the complacency tree.
Q&A/Reader’s Feedback
Helene welcomes your questions about Top Stocks and her charting strategy and techniques. Please send an email directly to Helene with your questions. However, please remember that TheStreet.com Top Stocks is not intended to provide personalized investment advice. Email Helene here.
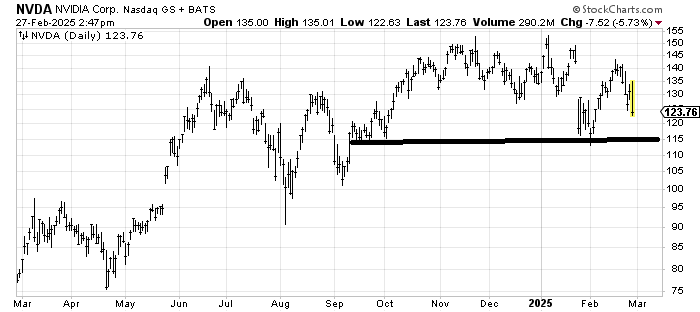
Nvidia NVDA filled the gap and is heading back down again. It is finally starting to look toppy. I would guess that 115 support beckons for now. If it breaks that, we have a lot more to talk about in terms of the big-cap indexes.
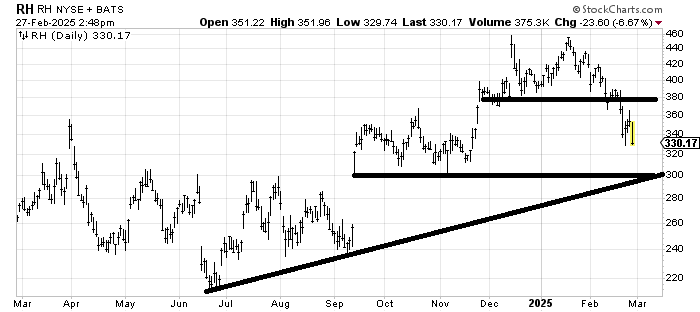
Now that RH RH broke 380, it measures to 300, and possibly the gap fill at 260. There will be support at 300, though so I would expect a bounce from there.
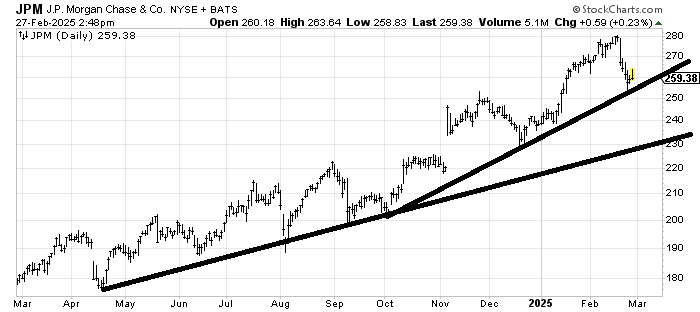
JPMorgan Chase JPM is trying to hold that shorter-term uptrend line. While I don’t think a break of it takes it down to the lower line quickly, that 230 area would be the next support area. If it waits a month or so to get there that number rises to 240.