Bulls Make Money, Bears Make Money...
It was one of those days that had something for everyone, whether they were bullish or bearish.
You've reached your free article limit
You've read 0 of 1 free Pro articles.
The Market
Keep your trading hats on!
First, let me note how today was different than last Monday’s decline. Last Monday, breadth was positive, today, it was almost two to one on the negative side. Last Monday it was the index movers that held the market down after the open. Today, it was just sloppy all around.
Sure there was selling, but not anything that was panicky. The selling dried up almost immediately after the market opened, maybe thirty minutes in. And that was that. We never saw 90% of the volume on the downside, same as last week.
Here’s something else: for the last three days, the ISE Equity call/put ratio has been under 2.0. On its own, that’s no big deal. Except that we haven’t seen it do that since late October. Notch that up to a minor change in sentiment.
Also the final put/call ratio today was .94. That is not panicky at all but it is the highest reading since the low on January 13th. So there is a minor shift in sentiment.
I think it has to do with the Mag 7 being split now, no longer moving together as a block. It’s easier when you see that handful of names working together. When they split off, it’s harder to follow their path.
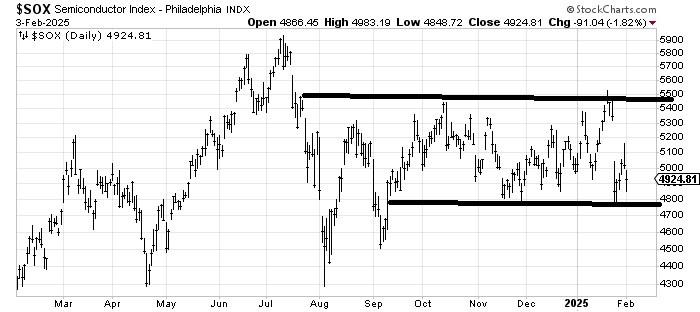
I would point out that the SOX didn’t come close to last week’s low, so it continues to stay in that range that has been with us for months now, well before the election.
I still have no strong view on what the week as a whole brings. We could easily be green tomorrow, and the index movers could be the leaders as they were last Tuesday. I just continue to see the next few weeks as volatile. Keep your trading hats on.
New Ideas
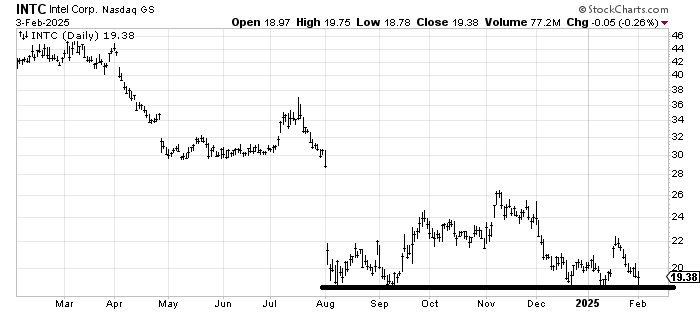
I don’t know why Intel INTC keeps holding at this 18-19 area but it does. I was asked about it and all I can say is that as long as it holds that level, it’s probably okay to buy but the chart looks like it’s going nowhere. A break of 18-ish would probably also see the SOX break that lower line.
Today’s Indicator
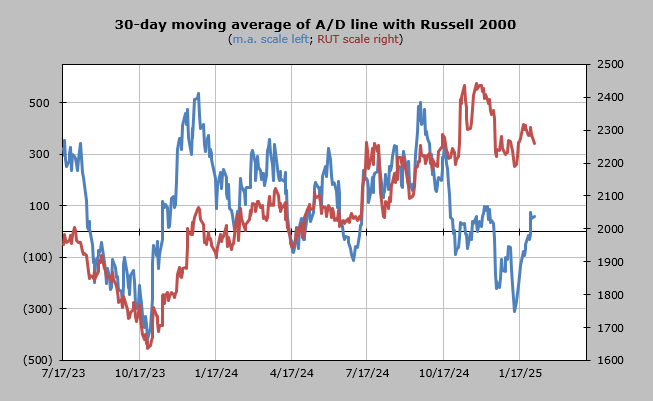
The 30-day moving average of the a/d line will be overbought midweek this week.
Q&A/Reader’s Feedback
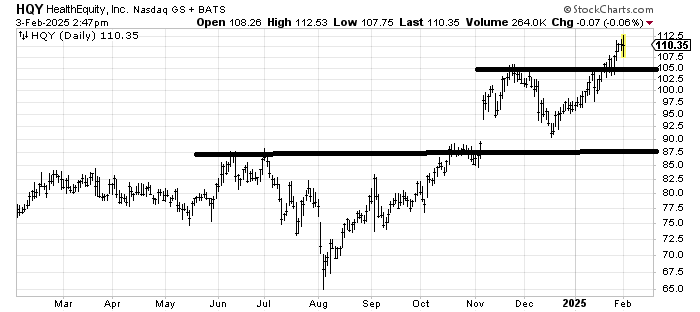
Health Equity HQY hasn’t done a thing wrong. It met its initial upside target and has a next one around 120. A pullback to that 105 area would be a gift.
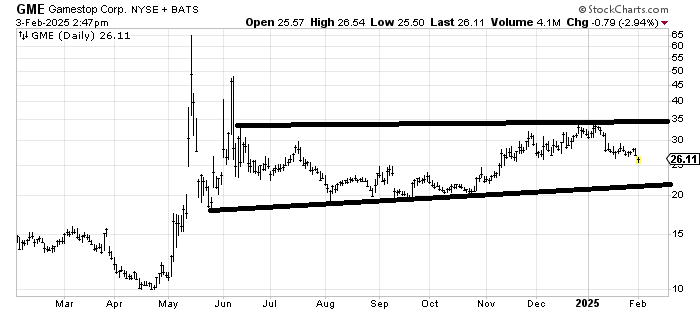
Let’s call Gamestop GME another chart in a wide range. All of these charts are the same: you buy the low end of the range and sell the top. Until something changes in that pattern, that’s the trade.
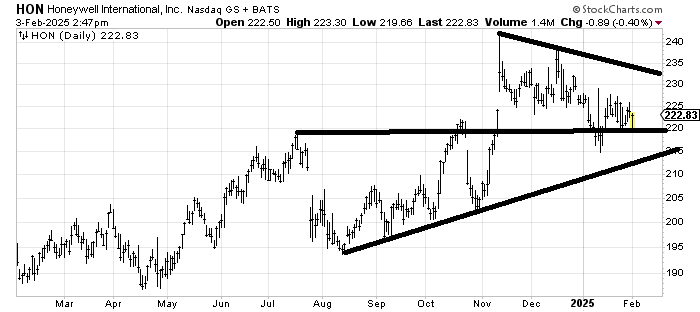
I really want to like Honeywell HON because it had that terrific breakout in November, but then it leaked all the way down, giving up more than the gap up. I think 215-220 is decent support, so it's a good area to pick some up. However, there is resistance all the way up, so hard to imagine it can fly easily. Probably a slow go.
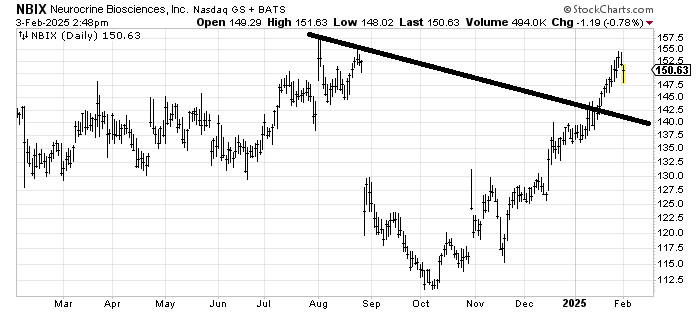
Neurocrine Biosciences NBIX looks vulnerable to me all the way back to that line. Let’s call the line 140-ish, but know that the longer it takes (without making a higher high), the lower that number is since the line is down-slanting.
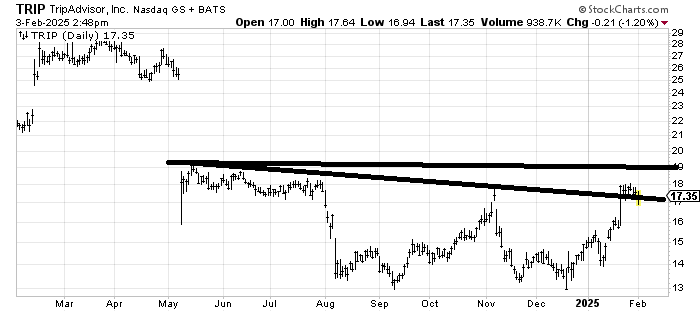
Trip Advisor TRIP looks like it is trying to build a base. Full disclosure: I am biased against this stock, though. Every time I have traded it, thinking it’s a base, I’ve gotten a pop and drop. Maybe you shouldn’t trust it unless/until it gets over 19. Use a stop under 16.
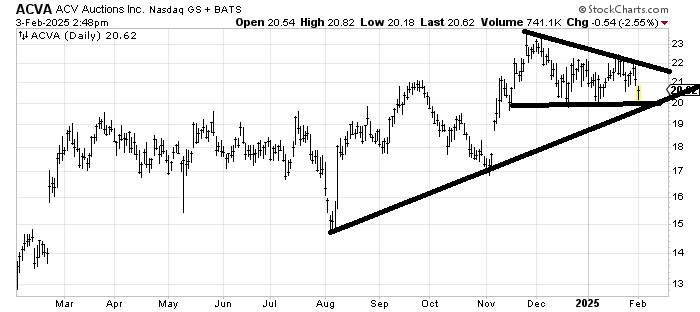
ACV Auctions ACVA is a major small cap stock so with the caveat that my work tends to lend itself better to big cap stocks, this chart looks like if it breaks 20 you want to get the heck out of the stock. My guess is it breaks down in the next month.