Bulls Go Into Hibernation While the Bears Stretch Their Paws
While the Investors' Intelligence Bull to Bear Ratio still favors the bulls, that ratio is trending in the bears' favor.
You've reached your free article limit
You've read 0 of 1 free Pro articles.
 Adult Grizzly Bear Growling in the Forest
The Market
It’s as if the market is paralyzed. No one wants to buy or sell. Volume has been contracting for a few days now. But let us talk about something that did move, and moved quite a bit.
The Investors’ Intelligence Bulls fell 3.5 points to 49.1%. That’s not a big deal but it is the first reading under 50% since the November low (when the bulls got to 44.4%.
The bears shot up seven points (that’s a lot!) to 21.8%. Again, 21.8% isn’t extreme at all, but you can see on the chart it’s a serious change in sentiment. The bears are now the highest since last summer.
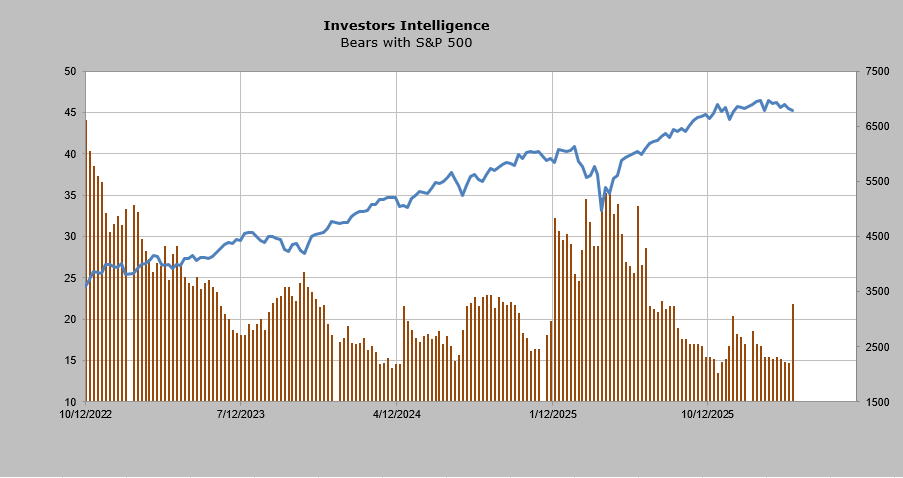
Finally, I have harped away about the bull/bear ratio. Recall the first week of February, the ratio topped 4 to land at 4.13. At the time, I said readings over 4 (meaning there are four times as many bulls as bears) tend to mean folks got too giddy and therefore is not bullish stocks.
The bull/bear ratio is now at 2.25. Again, this is not extreme; it is where it was at the November low. An extreme reading would be under 1 because that means there are more bears than bulls.
For me, this slow-moving survey finally started showing the concern in the market that began via options several weeks ago. I know many are quick to laud the S&P for going nowhere all these months despite the news and the violent action underneath. I am of the mind that we tend to get a cleanout low when the indexes fall, too.
I would note one other sentiment factor. I do not keep a chart of this indicator, but the put/call ratio for the Russell 2000 has been running quite high for over a week. At some point, when the market gets oversold, I suspect that is where the shorts will run for cover, and they will have help from the options traders.
And we are getting closer to an oversold condition. Remember every day that we have a day of negative breadth is one day we get closer to a short-term oversold condition. We’ve got five straight negative breadth days now and six of the last seven. A few more days and we’ll be back to a short-term oversold condition.
New Ideas
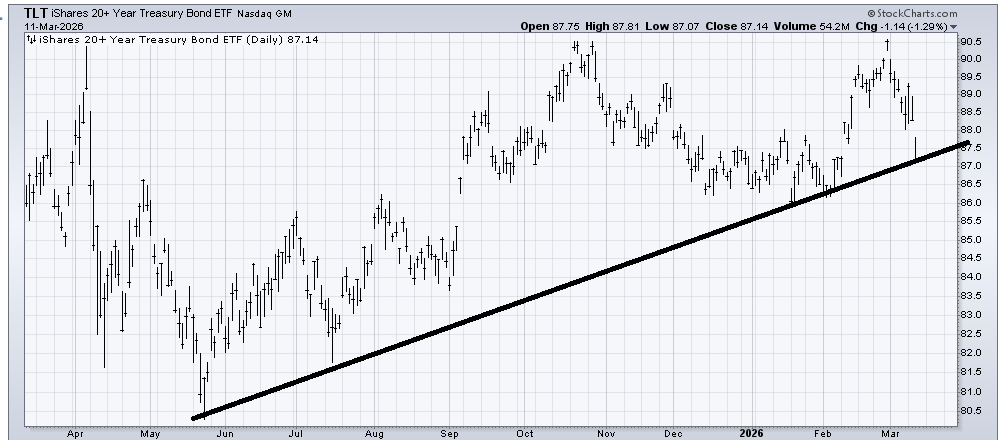
TLT is trading quite volatile. It finds itself back at the uptrend line. Usually, I have a good sense of whether or not I think it will hold, and I can honestly say I do not. But I do think if it breaks the line, it will find support in that 86.50 area on the first trip down. I still think bonds are in a very wide trading range overall.
Today’s Indicator
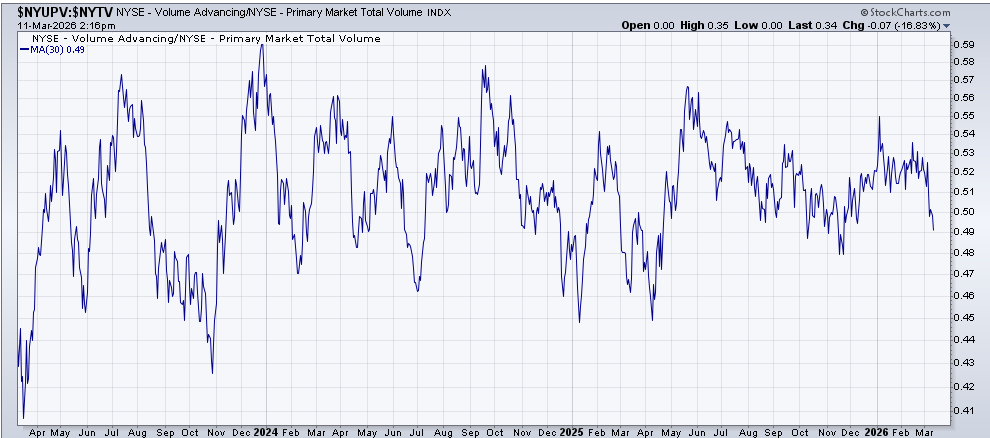
The Volume Indicator moved! And it moved a lot. It is now at 49%. In bull markets, usually 47% is oversold. In bear markets, it can get all the way down to the 40% area. So, at 49% at least, this intermediate-term indicator is finally under 50% again.
Q&A/Reader’s Feedback
Helene welcomes your questions about Top Stocks and her charting strategy and techniques. Please send an email directly to Helene with your questions. However, please remember that TheStreet.com Top Stocks is not intended to provide personalized investment advice. Email Helene here.
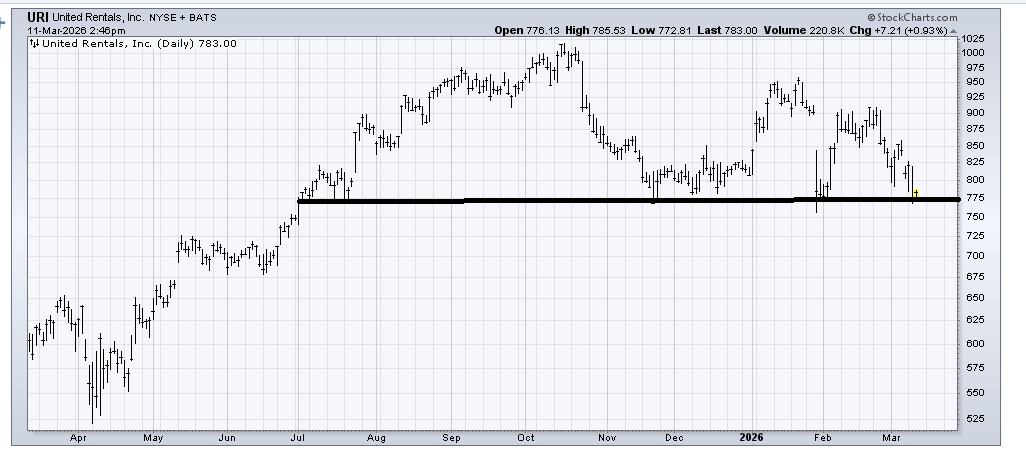
It’s a lot easier to decide if you should buy a stock after it collapses than when it holds. When it holds as United Rental (URI) has you can use a stop under that 770 area, but it is not the best risk/reward. This would be the fourth trip down to this level. The first trip or two, we tend to see it hold. After that, it tends to be a wild card. It’s oversold enough to bounce, but that’s all I see now. And if it bounces to say 825 and then heads back down, I’d give high odds of a break. If it can rally over 860, I would change my mind.
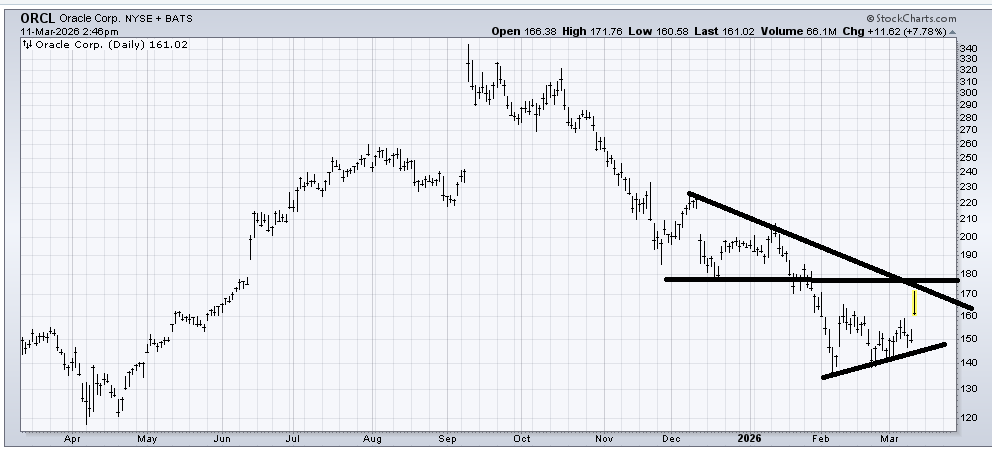
I suspect that Oracle (ORCL) will rally again, but it’s going to take a long time to build a proper base, so I’d call it a trading stock (as most software names are). If it fills that gap from this morning, I’d look for a rally from there on a trading basis.
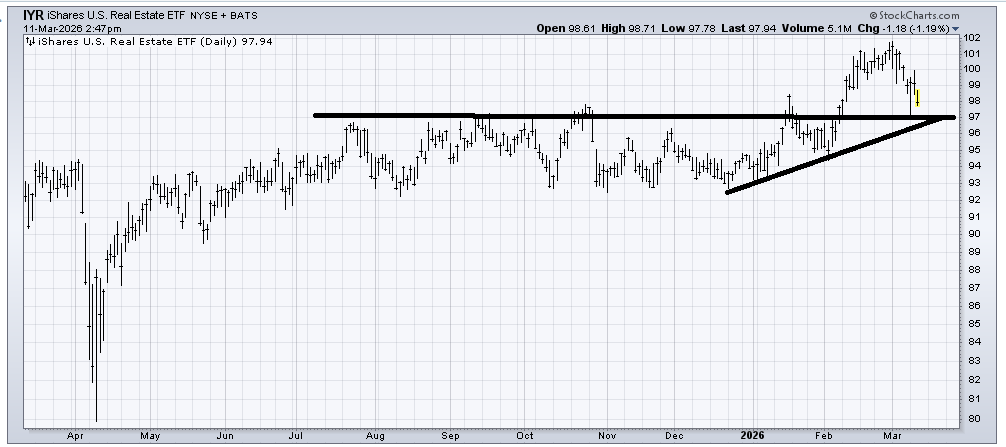
(IYR) , an ETF to be long REITs, was a chart I liked in late January. It hasn’t broken down yet, but in this environment, it now looks vulnerable. If it breaks 95-ish, I’d get out.
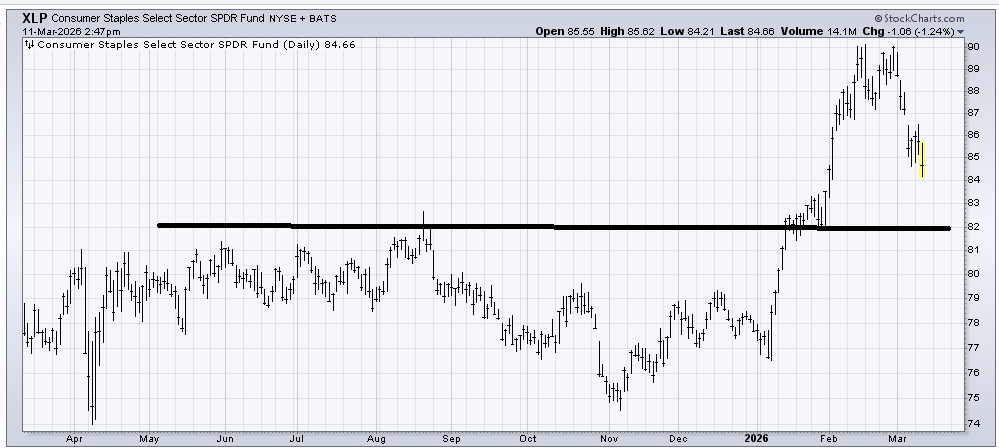
Two weeks ago, I turned cautious on the staples (XLP) , and I remain that way for now. If XLP can take the next several weeks to work their way down to the 82 area, I might like them again.
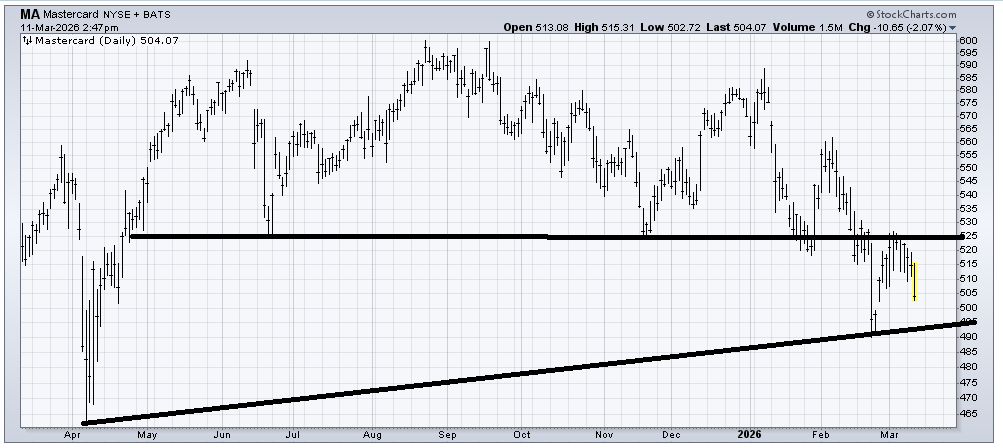
Mastercard (MA) looks similar to Visa in that it broke support, snapped back, and is now revisiting the recent low. I would think the first trip down to that 490-500 area produces a short-term bounce. But overall, there is too much resistance overhead for this to chew through. If it breaks 490, the next target is last April’s lows.
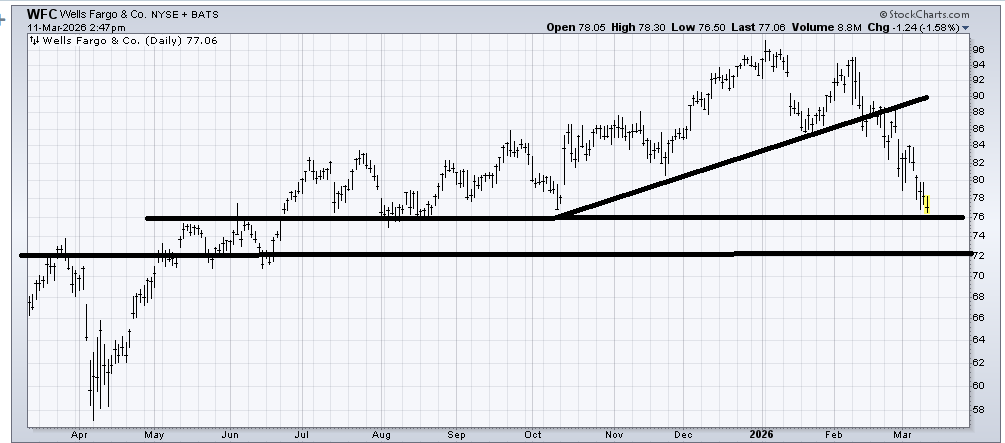
By now, you probably know that I am not a fan of the financials, although Wells Fargo (WFC) is getting a little short-term oversold in this 76 area. But that’s the best I can say. It might almost be better if it had a good whoosh down to 72 to clean out whatever weak holders are still there.
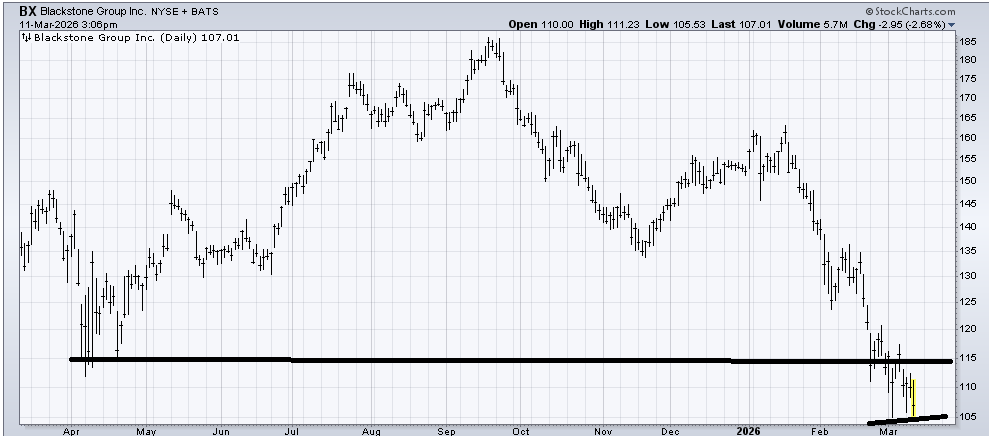
Blackstone (BX) broke support, and while it is short-term oversold, the resistance at 115 looms large. A break of 105 would measure another 10 points. What I would love to see is some back and forth between 105-115 for weeks to build at least a small base; otherwise, it’s a coin toss.
Related: Stocks & Markets Podcast: Key S&P 500 Levels to Watch as Oil Prices Surge
