Breaking My Rule to Short This Troubled Regional Bank
The banking sector has rallied, but I'm not convinced it's in the clear.
You've reached your free article limit
You've read 0 of 1 free Pro articles.
Less than two weeks ago, regional banks were plunging. Zions Bancorp (ZION) , Western Alliance (WAG) and Jefferies Financial (JEF) suffered double-digit losses, due to bad loans and exposure to the flailing automotive aftermarket parts industry.
For those of us who’ve been in the business for the past two decades, the combination of plunging banks and bad loans brings up some vivid memories.
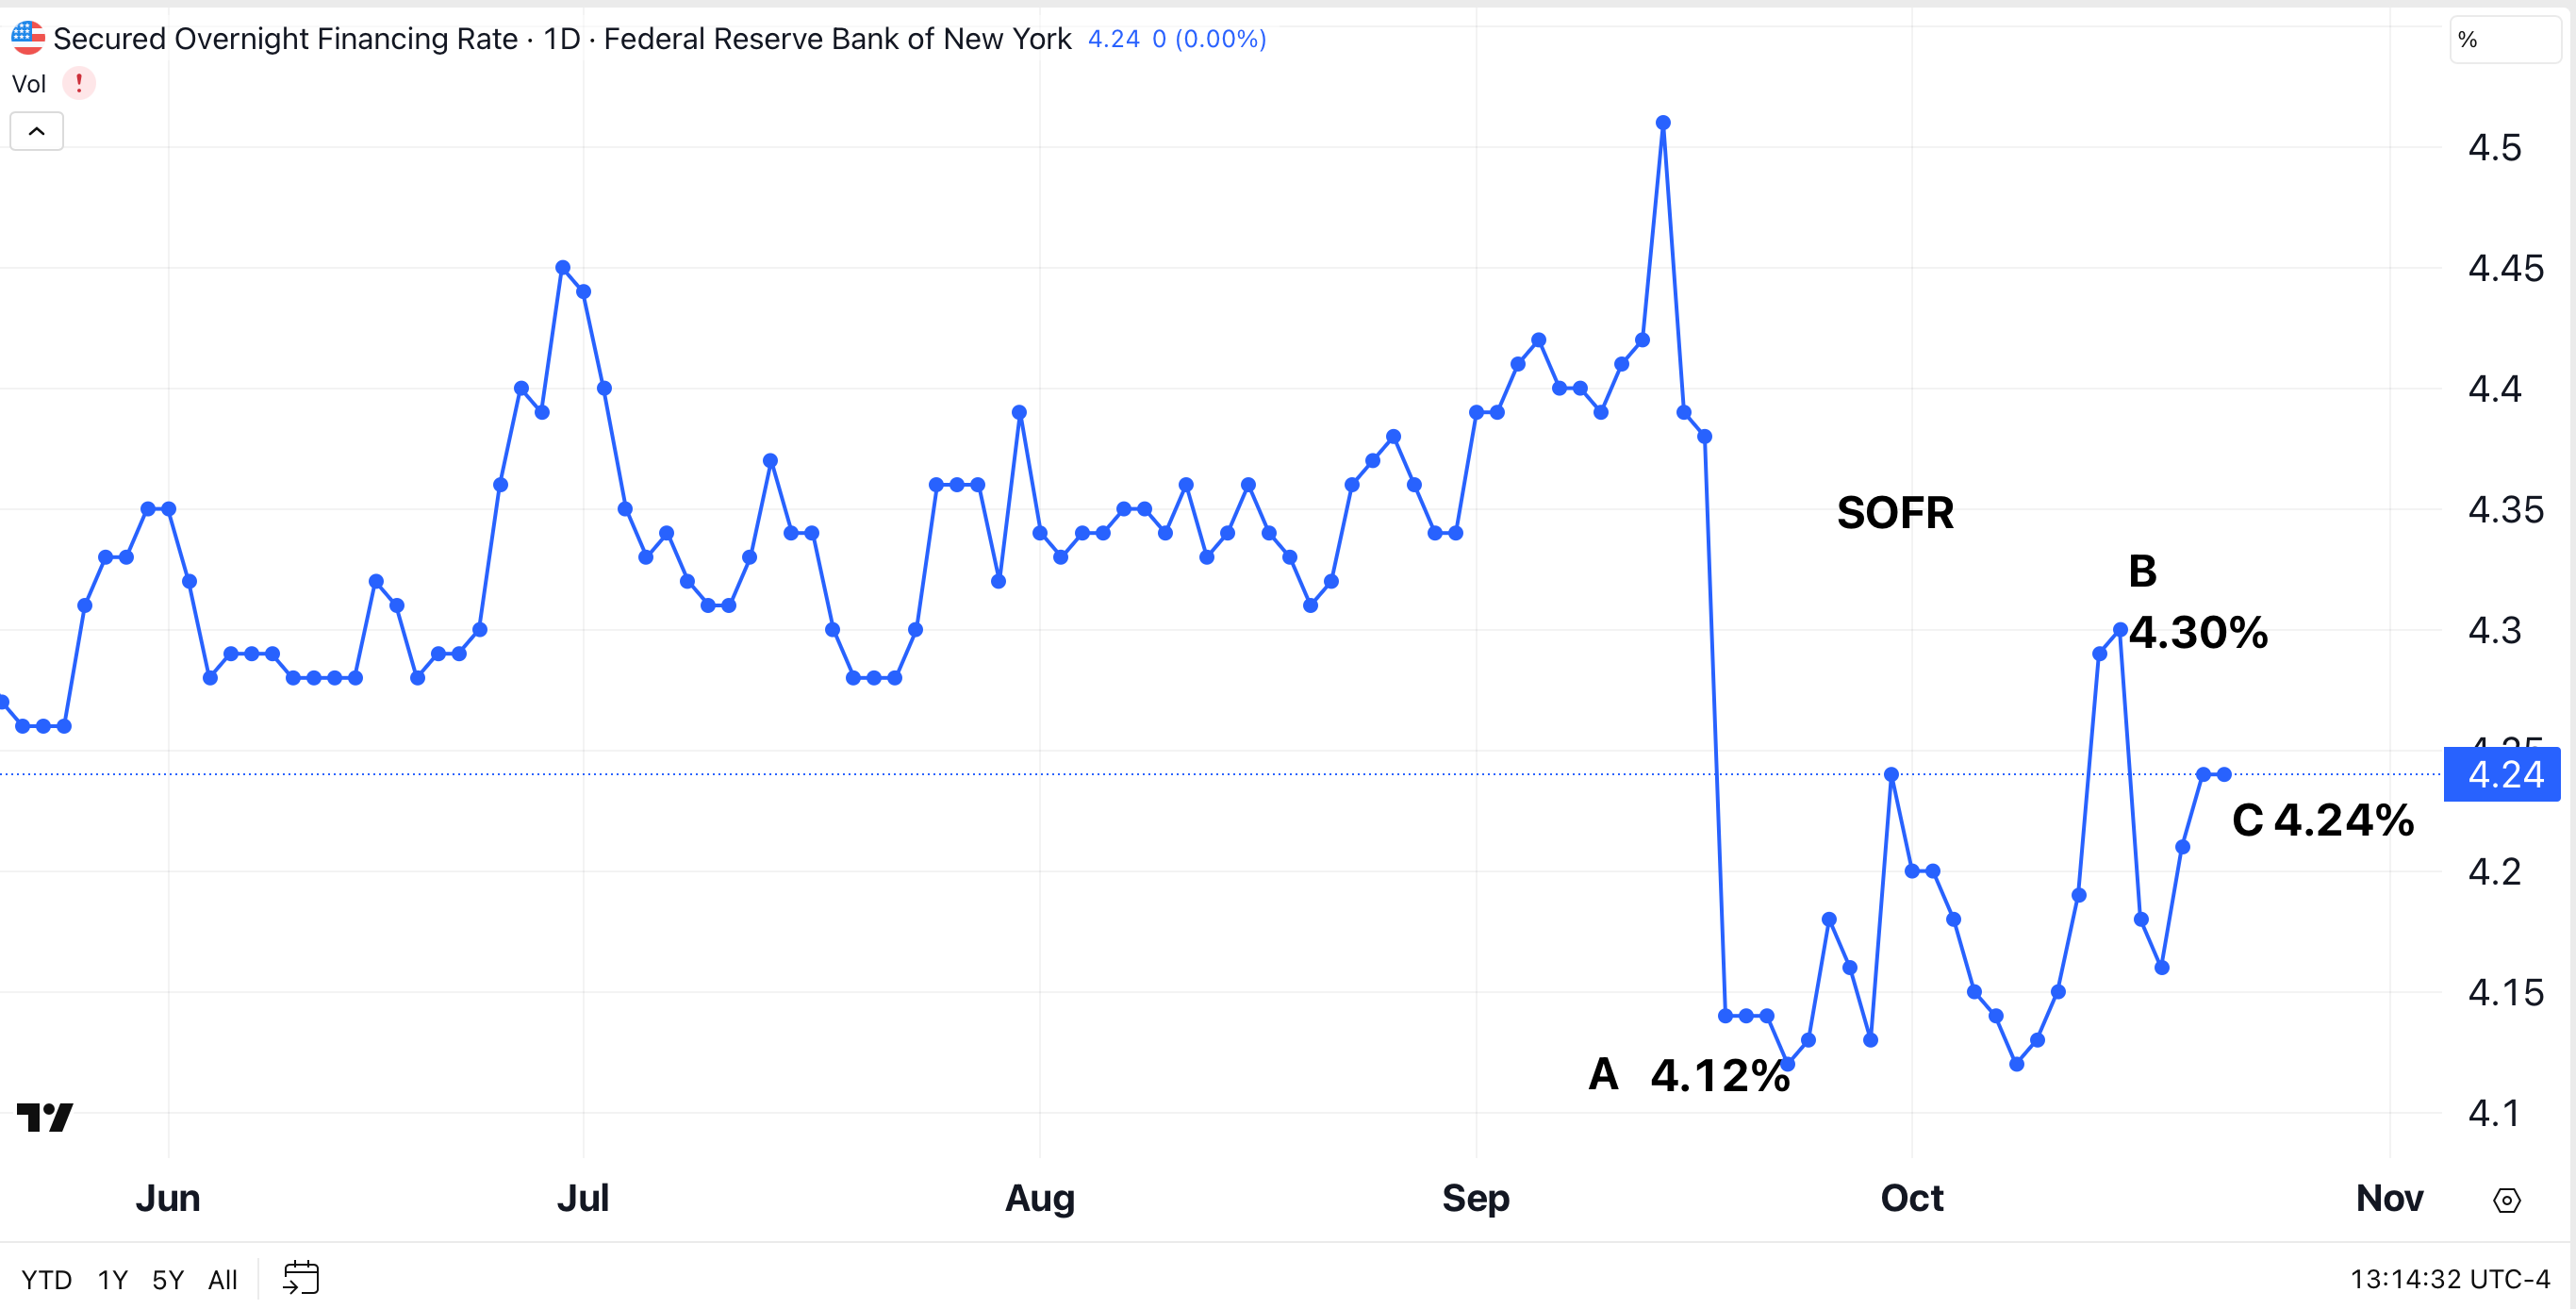
SOFR Settles Down
Due to increased volatility, we began watching the secured overnight financing rate (SOFR) closely, as explained here. When SOFR is rising sharply, it’s an indication that banks are becoming reluctant to provide short-term loans to other banks.
Fortunately, SOFR has receded. SOFR fell to 4.24% on Monday after bouncing around for about a week.
The regional bank sector has also shown signs of improvement. Since finding support (black dotted line) on October 16, the S&P Regional Banking ETF (KRE) , a bellwether for small U.S. regional banks, has bounced for a gain of about 6.5%. In the process, KRE climbed back above its 200-day moving average (red).
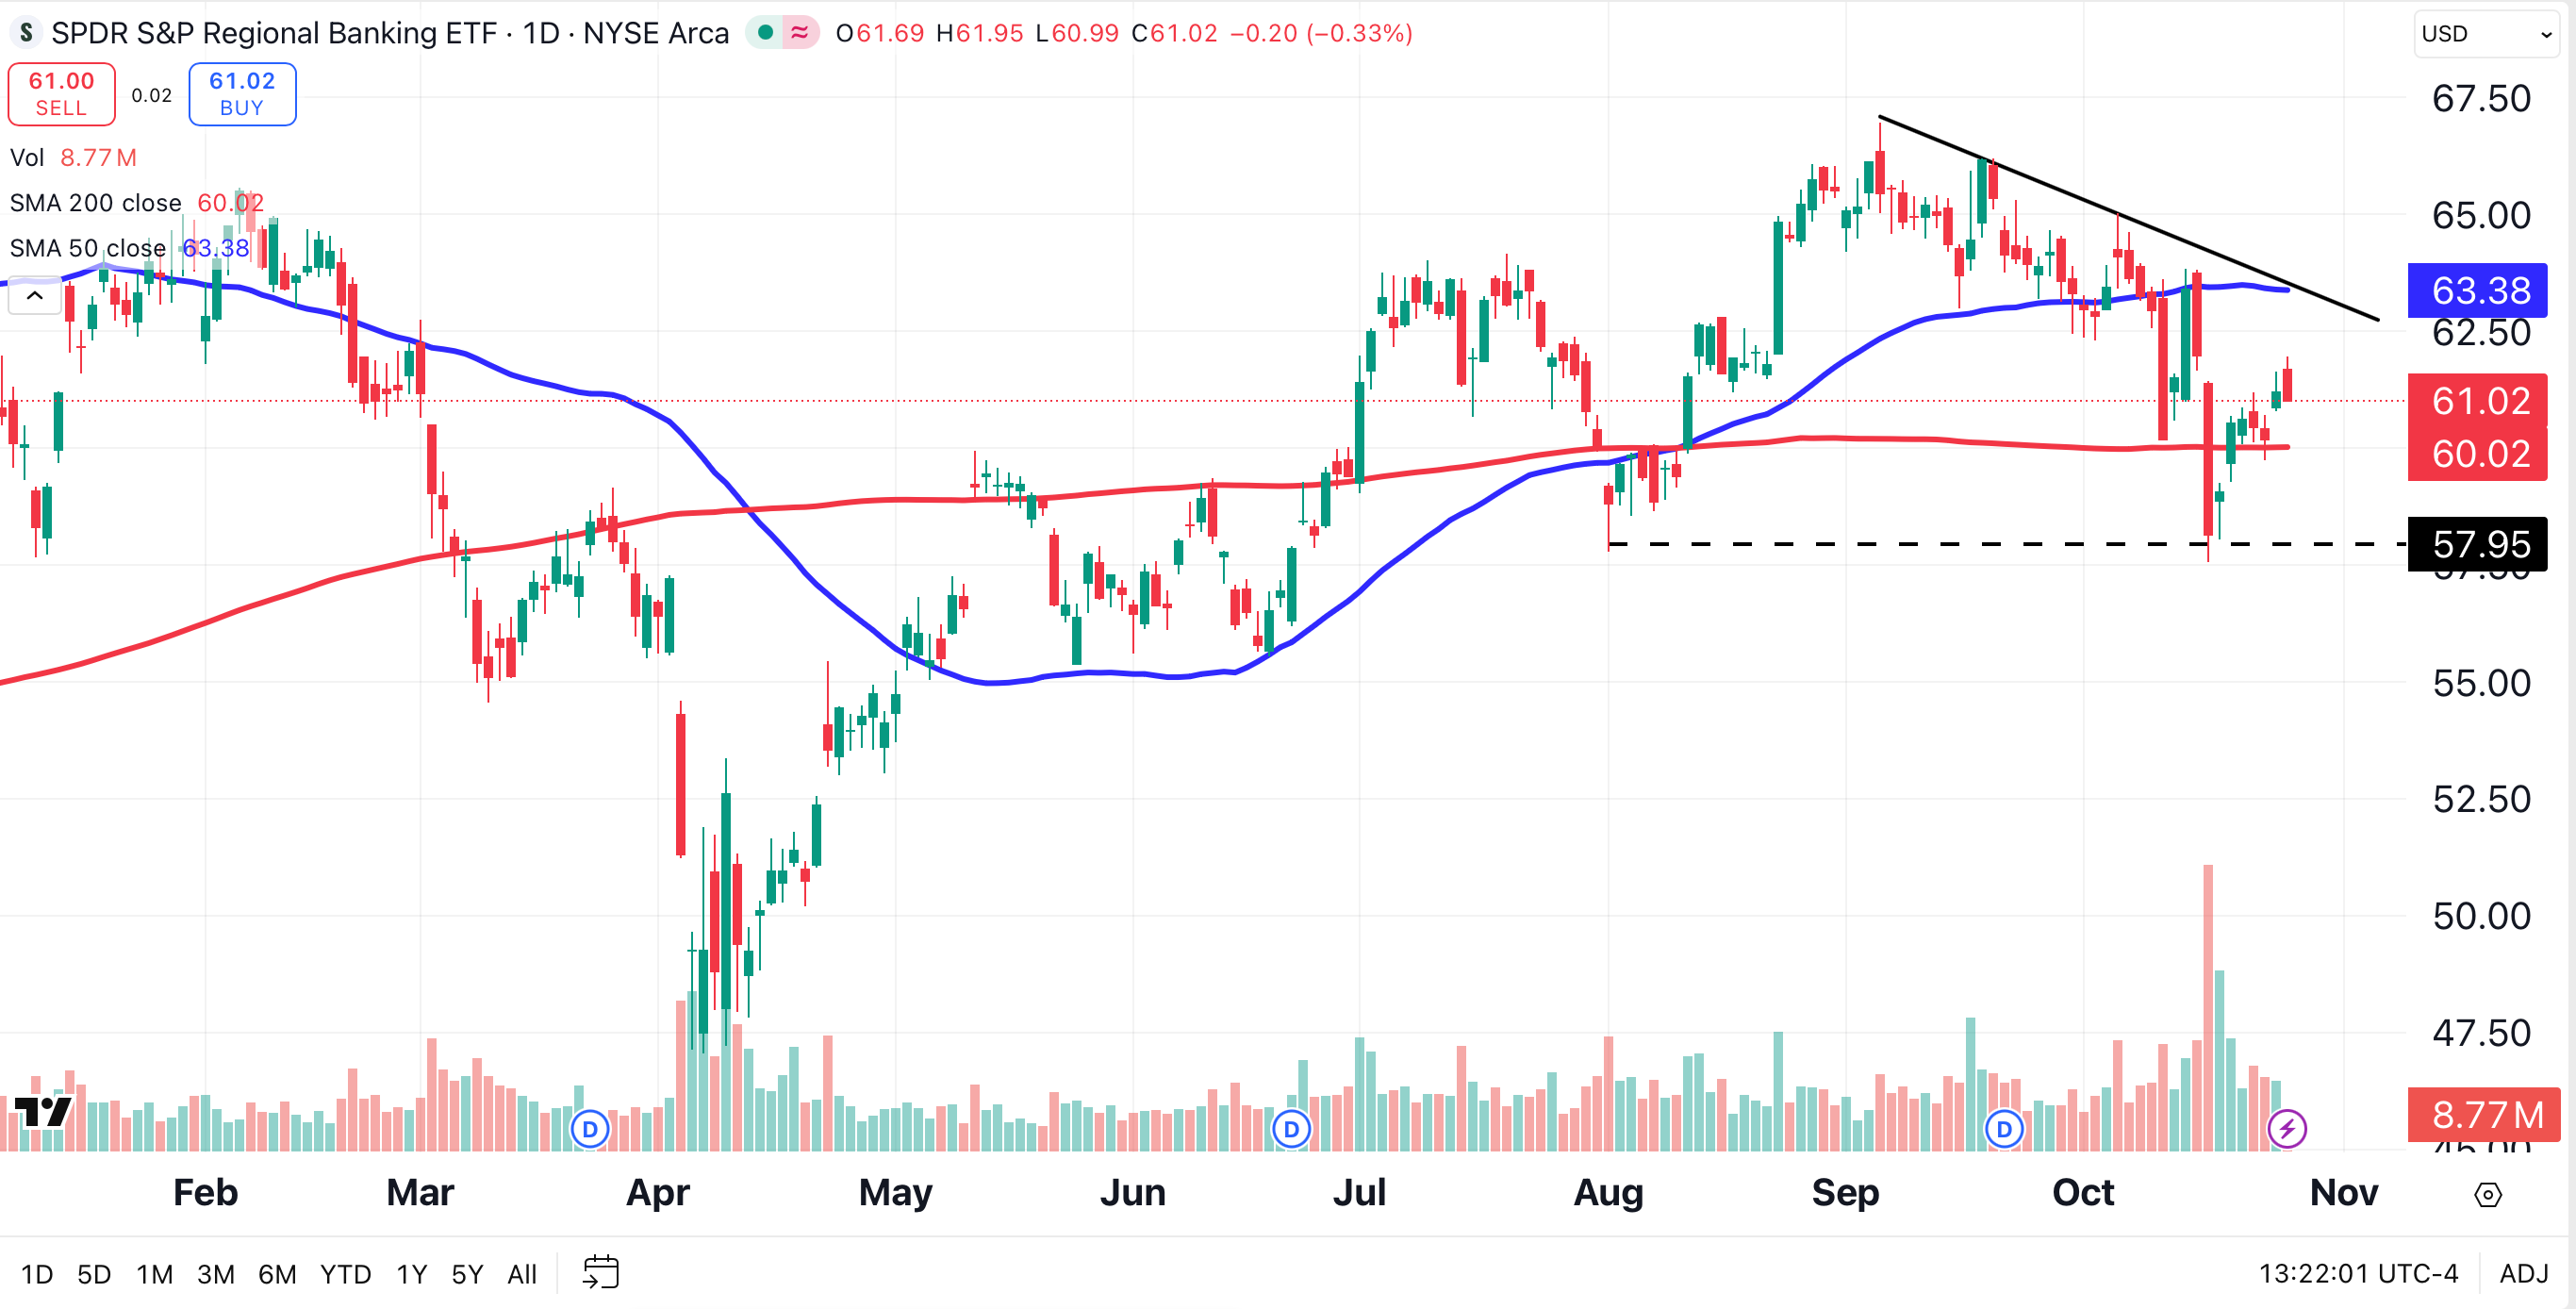
I’m not convinced that the banking sector is in the clear. Note the location of KRE’s 50-day moving average (blue), and how it coincides with a bearish descending trendline (solid black line). Based on the chart, $63.25 seems like a good place to sell the S&P Regional Banking ETF.
Notice that KRE’s bounce from support occurred on fading volume. As the price rises, the volume falls.
Zions Bancorp Looks Vulnerable
The chart of Zions Bancorp, which was clipped for a 13% loss on October 16, looks even worse. Comparing the following chart to KRE (above), ZION’s plunge was deeper, support was broken twice (black dotted lines), and the volume fade is even more dramatic (shaded yellow).
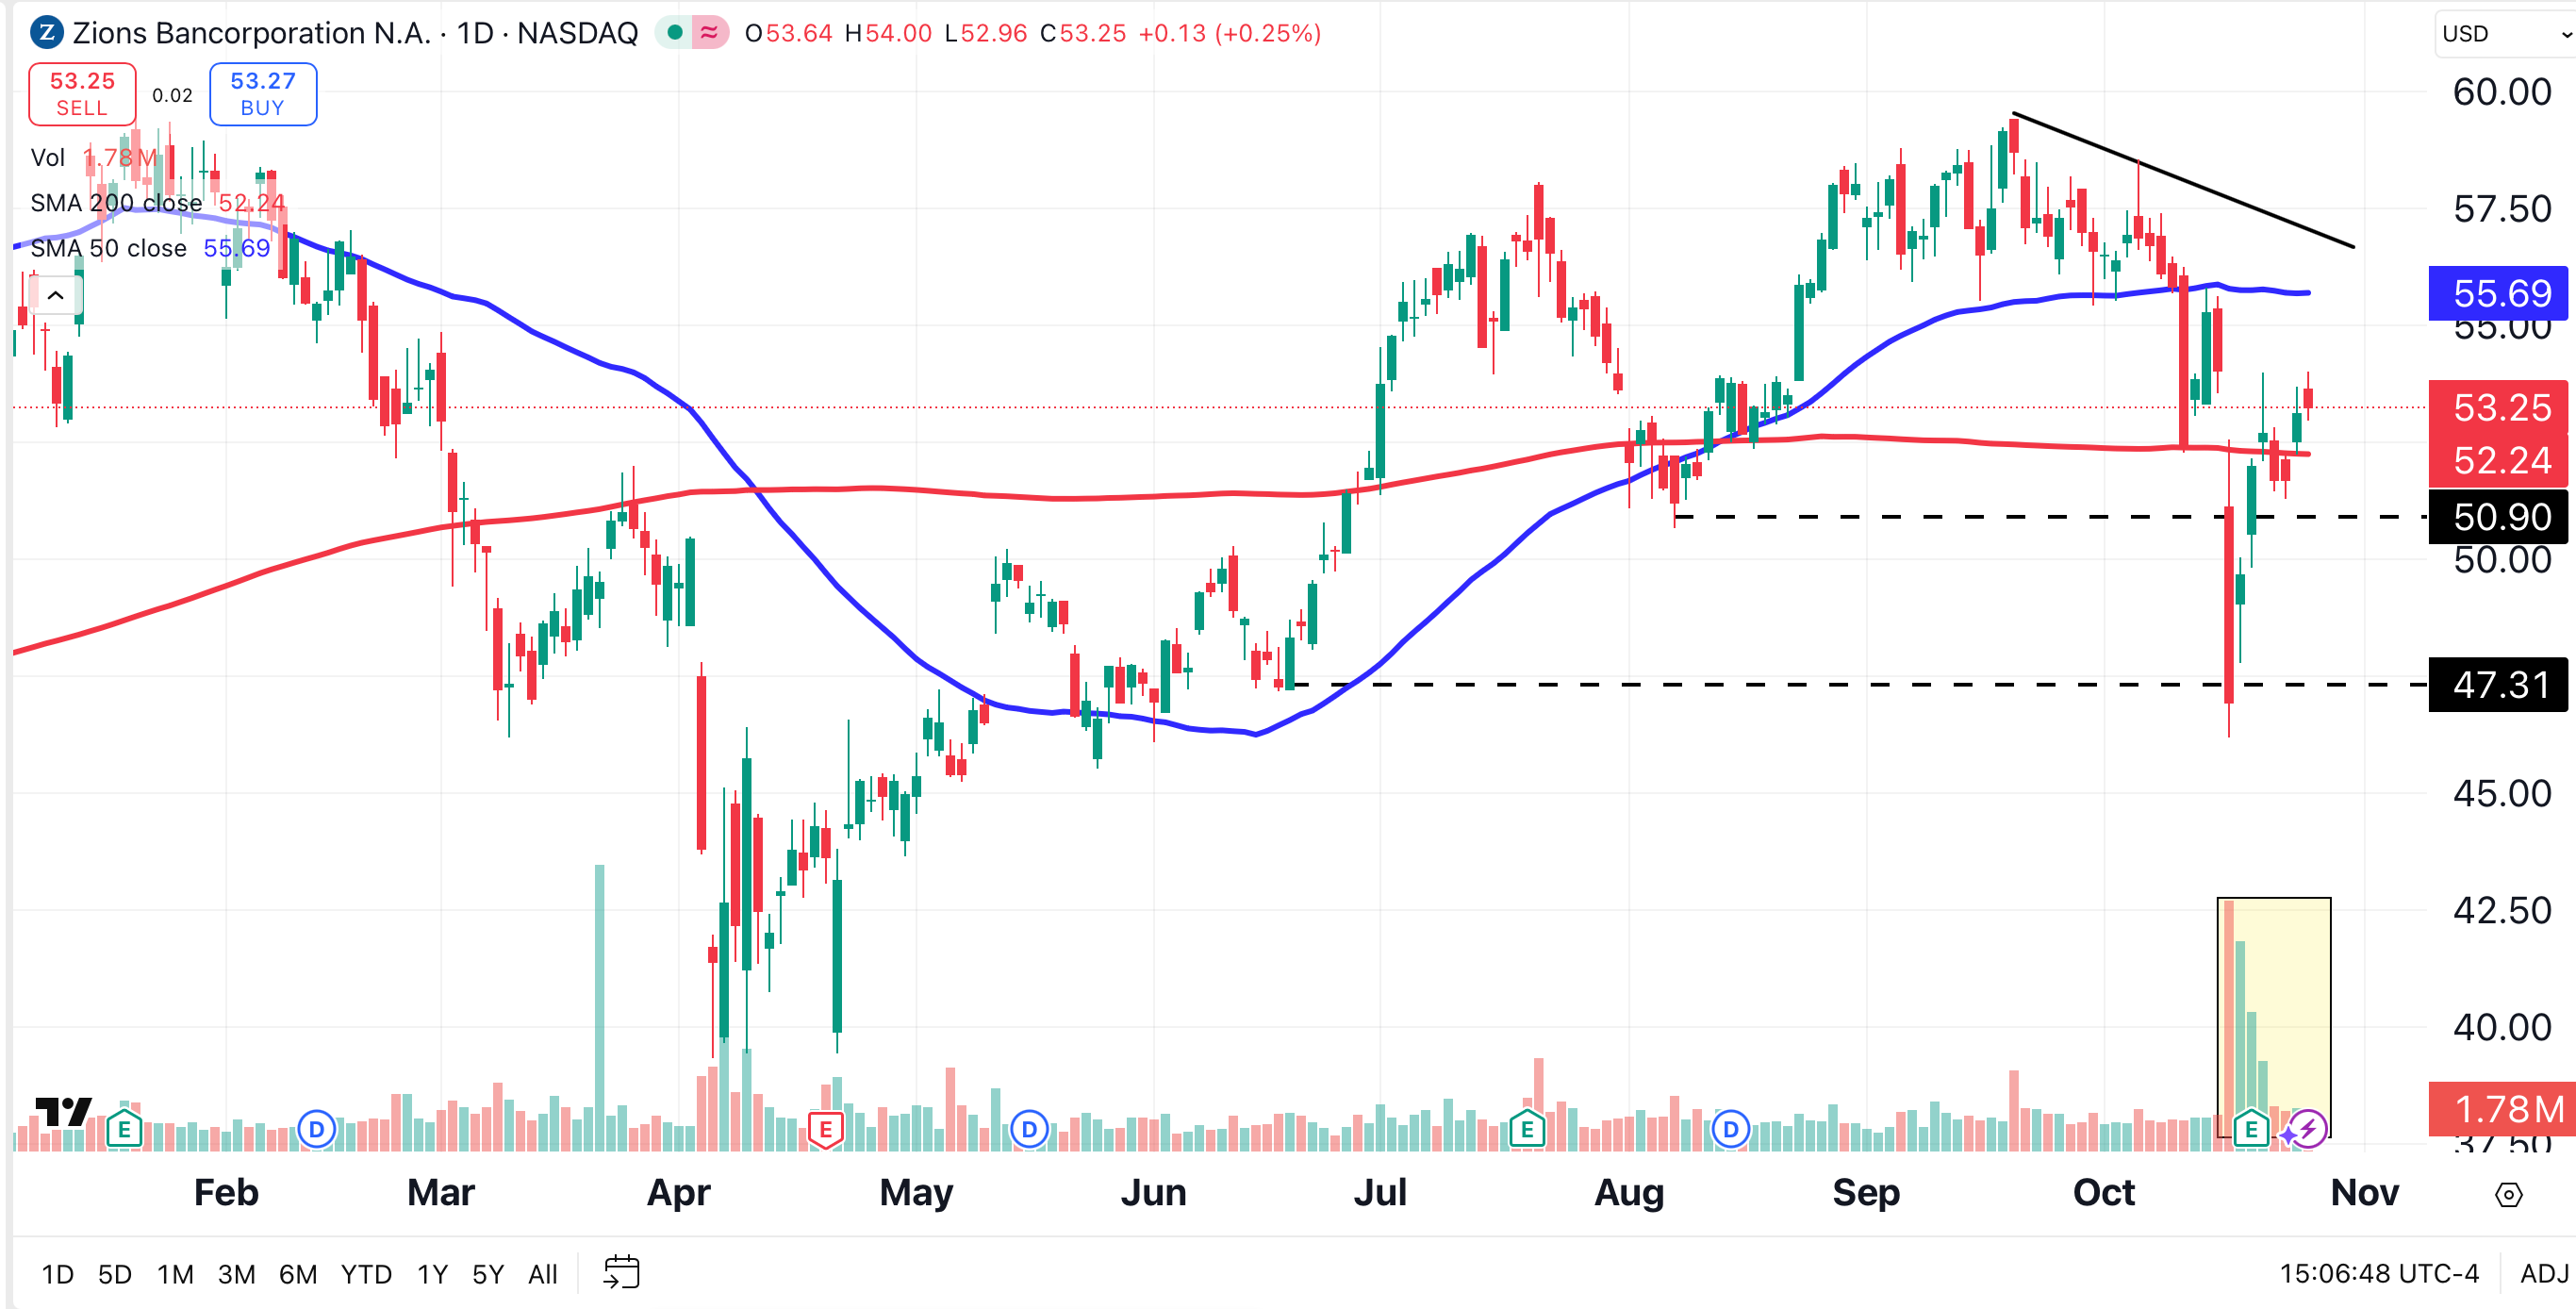
ZION has barely managed to climb above its 200-day moving average (red, $52.24). The stock’s 50-day MA (blue), at $55.69, lies below its bearish trend line (solid black line), which stands near $57. Both the 50-day MA and the trend line are obstacles that may prove difficult to surmount.
Here's My Game Plan
I’m taking a half-sized short position in Zions Bancorp. I’ll add the other half if and when the stock reaches its 50-day moving average, currently $55.68. If the price breaks above the bearish trendline ($57-ish), I’ll cover.
Generally, I won’t short stocks in a bull market. I hate the idea of fighting the overall trend.
But in this case, I feel that the potential reward outweighs the risk. Zions Bancorp is a weak stock within a weak sector, and its chart is indicating that a deeper decline is likely.
At the time of publication, Ponsi was short ZION.
