Breadth Turns Horrific With a Sign That Investors Have Had Enough
There are some troubling signs developing in the market, both tangible and intangible.
You've reached your free article limit
You've read 0 of 1 free Pro articles.
The Market
Well, if Monday's lackluster breadth didn’t do it, Tuesday's horrific breadth did it. The indicators turned. Oh, sure, you still need to squint at some of them to see the turn but it’s there.
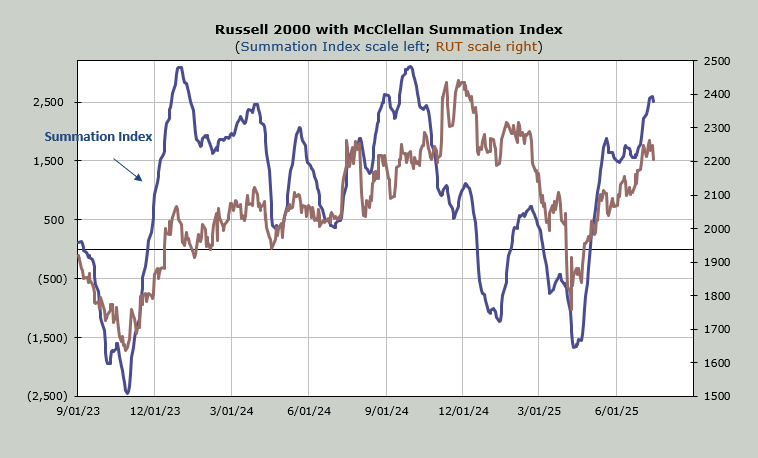
The McClellan Summation Index turned down and now needs a net differential of +1800 advancers minus decliners on the NYSE to halt the decline (more to turn it back up). The chart is below.
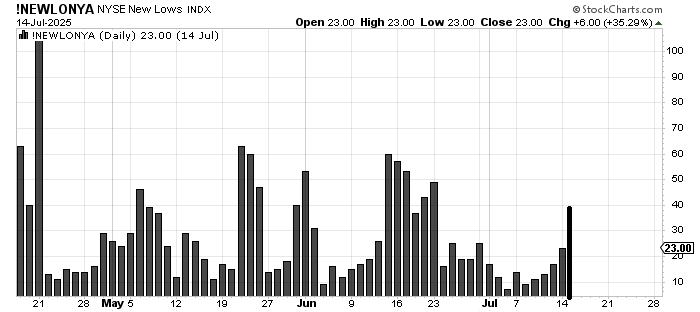
The Hi-Lo Indicator turned down. We’ve discussed the lack of new highs but now take a look at the rise in stocks making new lows. It has quadrupled in a week. Some may point to the rise in June not mattering and you would be correct, but I always ask: How many times can you get this action and the market gets saved?
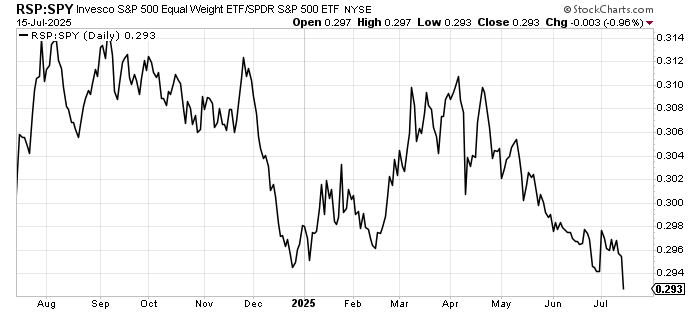
Then there is the equal-weight S&P. On a relative basis, meaning as we look at it compared to the S&P, it made a new low. I don’t love it when it’s heading down (the ratio) but as long as it stays in the range, we’re usually OK. But now it’s fallen out of the range.
Then there is something much less tangible. It’s that the down and out bottom-fishing stocks that had been working a month ago have stopped working and are seeing continued selling. That is often a sign that investors have had "enough."
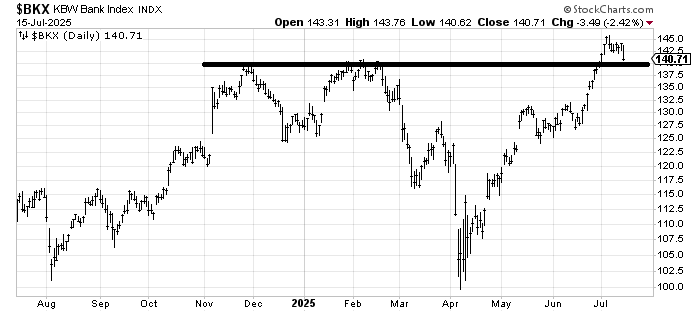
The Index Movers held the market up on Tuesday but I ask you to watch the banks. Their earnings got sold and the Bank Index finds itself just shy of support, or what ought to be support because we broke out from there. A failure to hold that 140-ish area on the Bank Index will tell us a lot.
Everyone knows about tech. All the hot money is in tech. But if it becomes just tech and no banks, it means the breadth has gotten really narrow.
Finally, bonds did not break but they act terrible. I expect them to be chattered about more in the coming days.
New Ideas
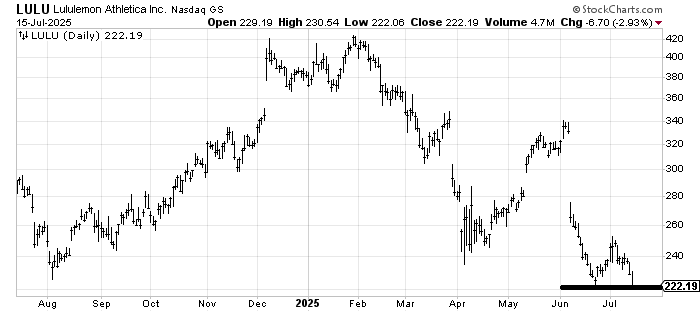
In a better market, Lululemon LULU would have held in that 230 area and bounced but now it has slid all the way back to the prior low. I still believe that spike lows tend to hold the first trip down so, yes, there ought to be a bounce but a good market would not have let it get this far.
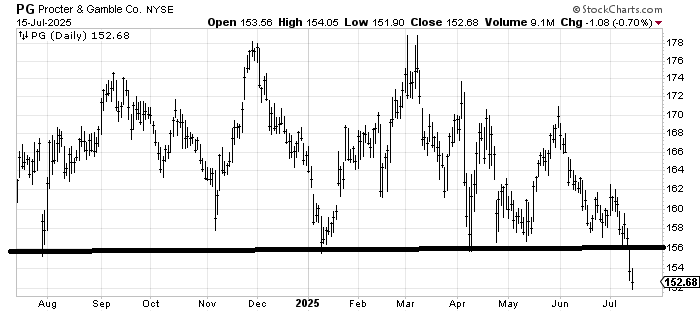
Another example of bottom-fishing gone bad is Proctor and Gamble PG, as it had a nice rally to 162 and then it died and made a lower low. Again, in a good market, that does not happen. I can’t even defend the chart now although it is oversold.
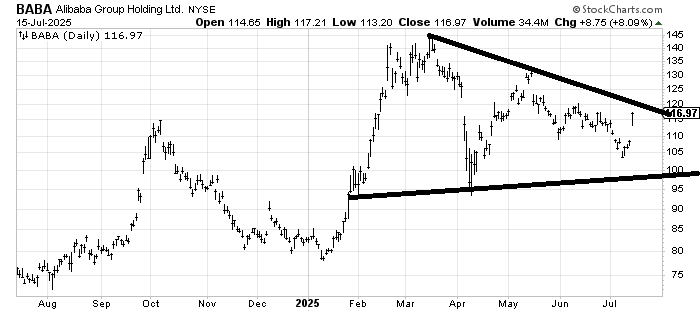
I will say that bottom fishing in Alibaba BABA did work out. But one out of three is not a great ratio. Resistance is at 120.
Today’s Indicator
The McClellan Summation Index is discussed in full above.
Q&A/Reader’s Feedback
Helene welcomes your questions about Top Stocks and her charting strategy and techniques. Please send an email directly to Helene with your questions. However, please remember that TheStreet.com Top Stocks is not intended to provide personalized investment advice. Email Helene here.
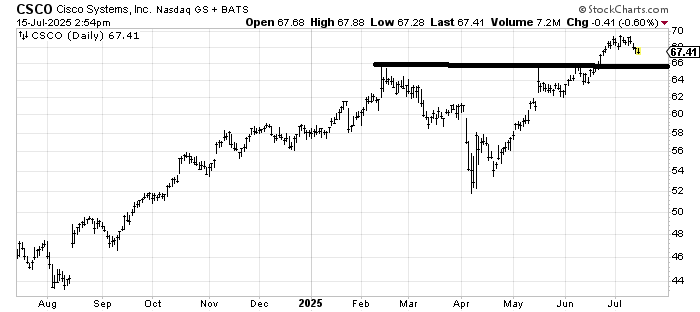
Cisco CSCO looks to me as if it is headed toward that line around 66. Considering it has been weak since the quarter began I expect it will get there. It had better hold once it does.
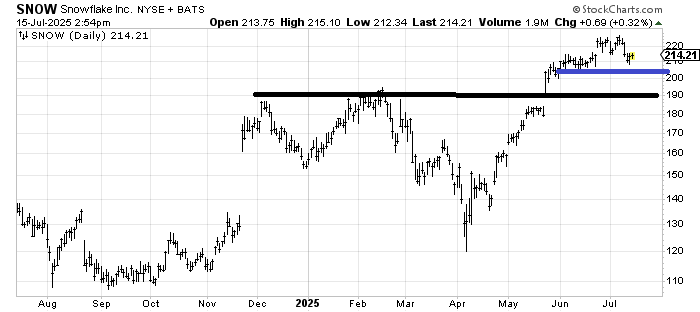
Snowflake SNOW is one of those software names that came down hard last week but has since stabilized and got a little oversold. If this rally can’t get over 220 in a hurry then I think that blue line comes into play. Either way, that blue line is the stop.
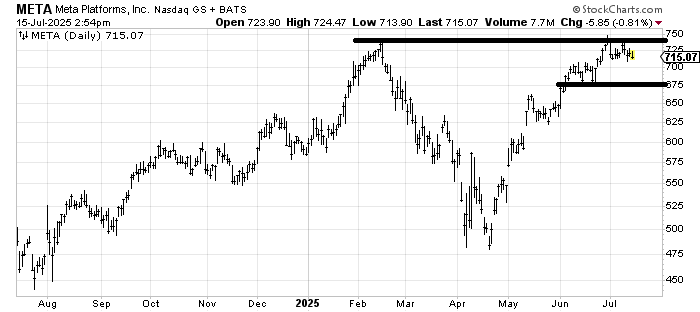
Meta META has a habit of looking as if it is going to roll over as it gets near earnings and then it runs the shorts in and gaps up. I would be concerned before it has failed to make a higher high. I don’t have a specific level that this turns negative but right now 675 is support.
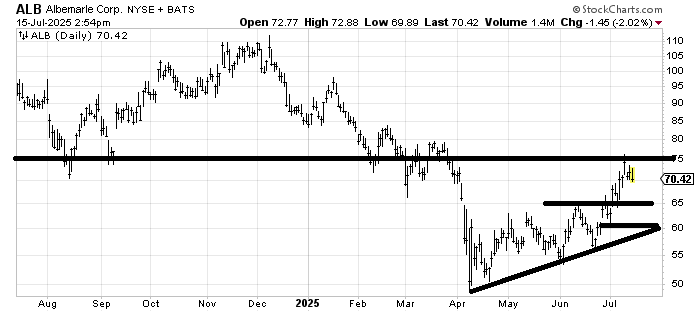
Albemarle ALB has enjoyed a rally in the last few weeks leading me to think they have really rallied the crap now. That having been said, it got to resistance and now has support back in the 60 to 65 area. I would not be surprised if it come back down there over the next month or so.
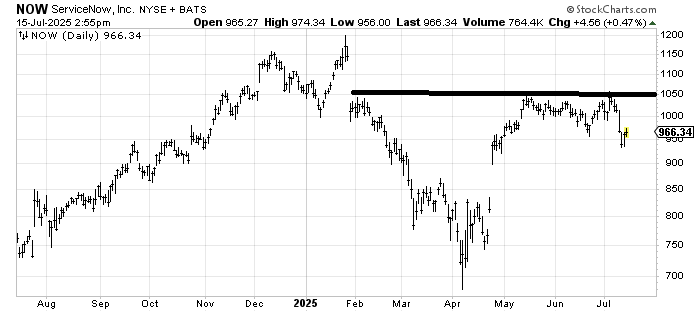
I thought ServiceNow NOW would fill that gap from February and try as it might, it did not. And now it’s made a minor lower low. It’s oversold enough to bounce but I’m leaning toward the best thing I can say is that it is in a trading range now (850 to 1050). It’s wide, but the stock is already down 10% from its high.
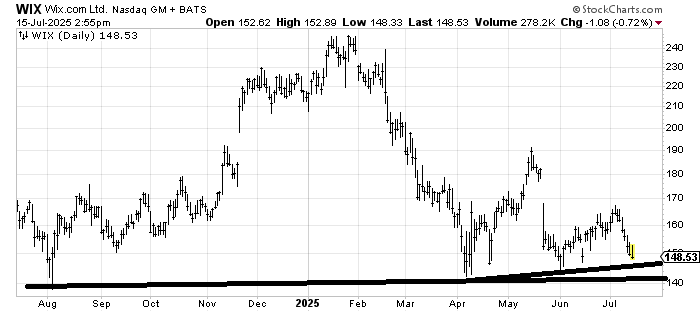
If Wix.com WIX falls into the 140-ish area and does it gradually rather than on a gap, I suspect it tried to hold on that first trip down, mostly because it is already down over 10% this month so it would be quite oversold if it gets down there. A gap under that 140 area and I’d stay away.
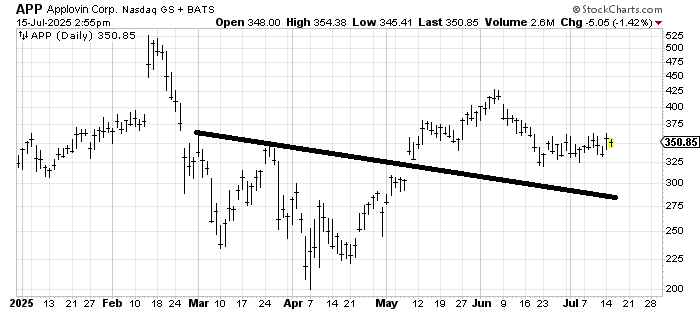
When we last looked at Applovin APP back in May I said it measured into that 450 area. It got to 425 before dying on us. I don’t think I would change my mind unless the stock cracks under 325.
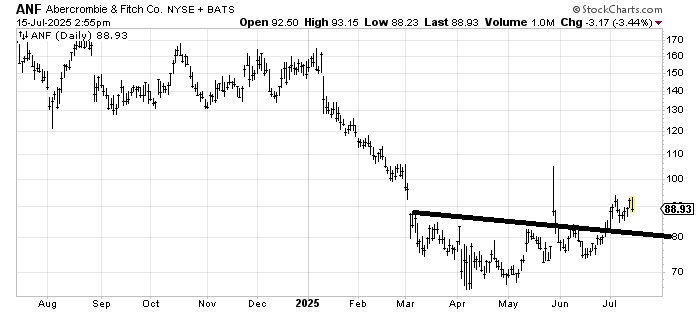
Abercrombie and Fitch ANF is a chart I would like to look at again in the 80-ish area. If it can hold down there and the market is back to an oversold condition I think I might be interested in buying it. Ping me again if it gets there.
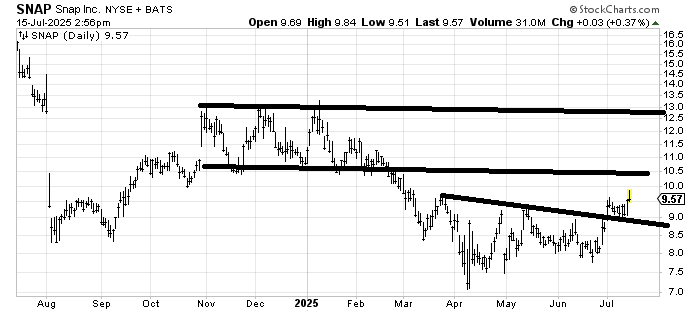
Snap SNAP is trying to bottom but I feel as though we say that every quarter and then it pops and drops. There is just too much resistance overhead for me to get excited over this chart. I guess if it pops into that 10.50 to 11 area on earnings I’d be a seller.
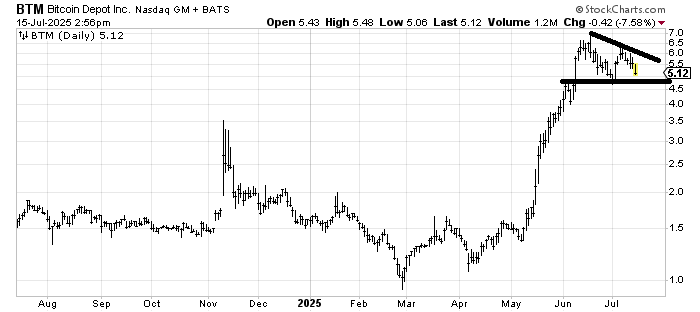
Bitcoin Depot (BTM) looks like a failure to me but unless/until it breaks 4.50, it’s not confirmed.
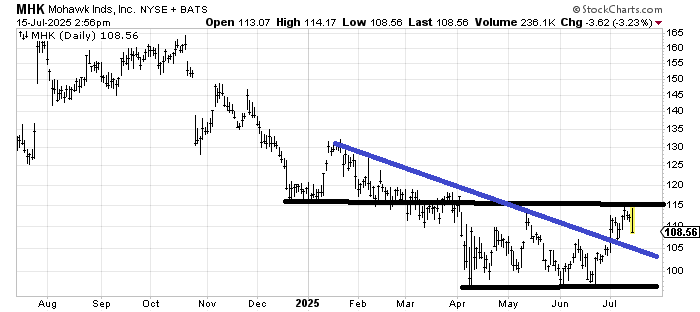
Mohawk MHK is another stock that has not participated in this rally and looks trapped in a range between the lows around 95 and 115 to 120. The stock hasn’t made a higher high since October 2024. If it can bounce off the blue line on this trip down it gets more interesting.