Blue Owl Tries to Bottom While the Market Grinds On
The asset manager catches a bid. The rest of the market is just frustrating.
You've reached your free article limit
You've read 0 of 1 free Pro articles.
The Market
It is clear the market just wants to frustrate me. It is clear that any foray into that 6800 area just teases me. And so we end up with a big fat nothingburger.
The only thing that was new today was that the AAII bulls fell five points to 34.5%. The Bears fell one point to 36.7% so for the first time since late November, this cohort has more bears than bulls (barely). At least that means sentiment is shifting from the giddiness we saw a few weeks ago.
I can report that the Nasdaq volume was the lowest of the year, which surprised me. Lately, Friday’s volume has been quite low, so let’s see what Friday brings us.
Thus far, it feels like that oversold condition in Nasdaq is being used up by just going sideways. Is it too much to ask for a break of that well-watched level?!
A few other items to note: the McClellan Summation Index is still rising, but it now needs a net differential of -200 advancers minus decliners to halt the rise. More than that, and it rolls over. So, after all these weeks with breadth so good, there is no cushion for a down day.
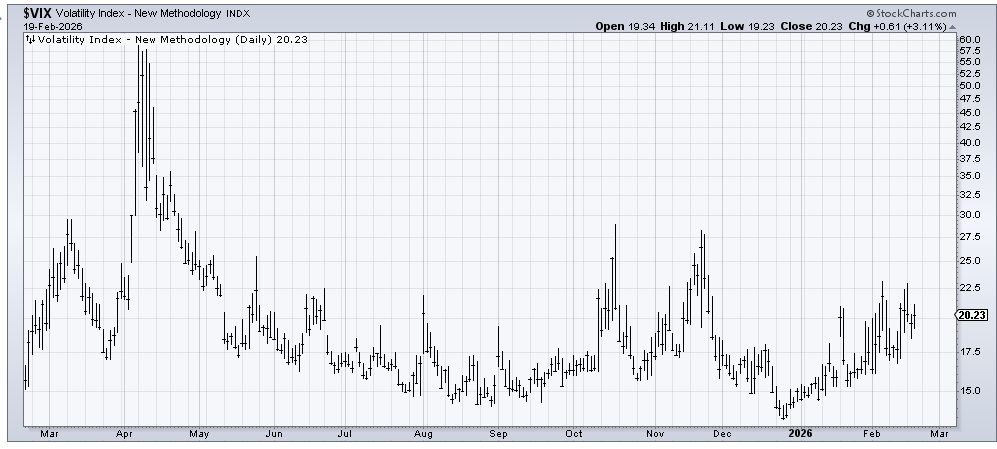
And while it feels as though the market has gone to sleep this week, the VIX is actually up from 15 at the start of the year to the current 20. I still don’t view any of the moves in the month of February as jumpy in the VIX. But as you can see a break of 6800 in the S&P would surely get this jumpy since it sits right on the precipice of doing so.
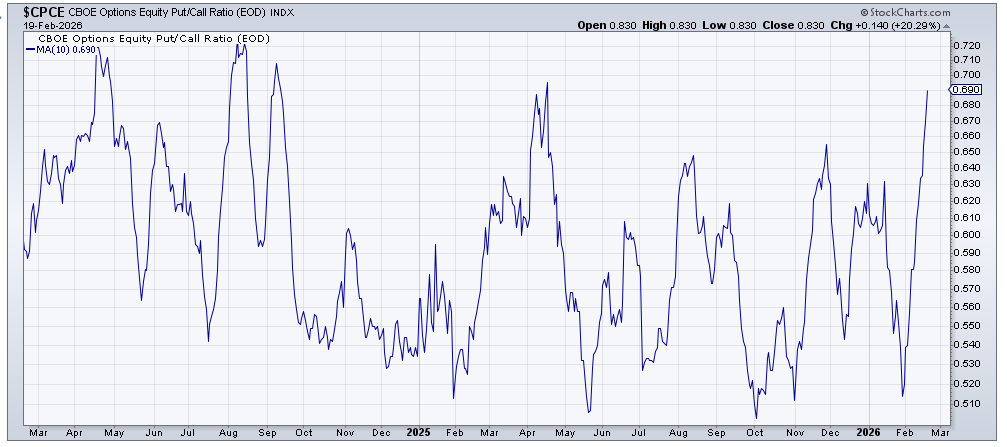
Finally, down below you will see the ten-day moving average of the equity put/call ratio has joined the total put/call ratio in making a higher high (than November and is now closing in on the Tariff high from a year ago. Do you see why a break of 6800 would be so helpful? Sentiment would get hysterical in a hurry.
New Ideas
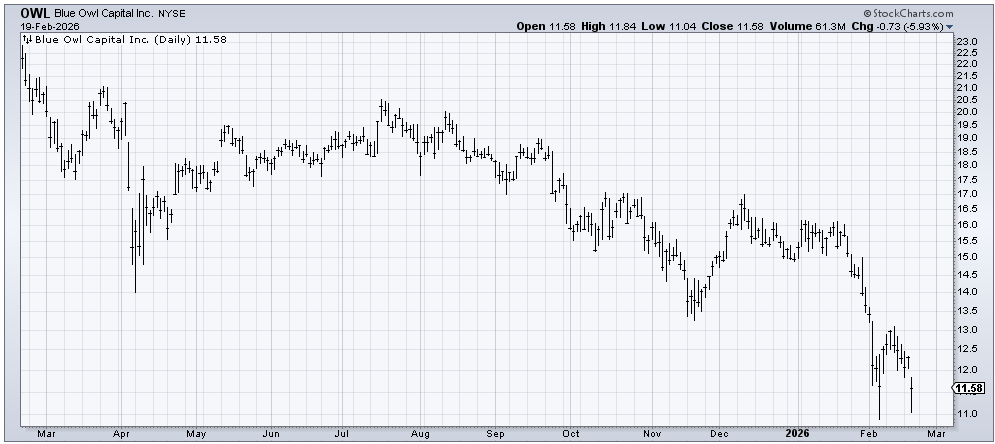
We have discussed the asset manager stocks before, as a sign that something was amiss. Something is still probably amiss there. But I do want to keep an eye on Blue Owl (OWL) , which had bad news today and did not make a lower low. Not yet, at least. The same way I still have my eye on 51 on the XLF chart, I am watching these asset managers for signs the selling is finally done.
Today’s Indicator
The equity put/call ratio is discussed above.
Q&A/Reader’s Feedback
Helene welcomes your questions about Top Stocks and her charting strategy and techniques. Please send an email directly to Helene with your questions. However, please remember that TheStreet.com Top Stocks is not intended to provide personalized investment advice. Email Helene here.
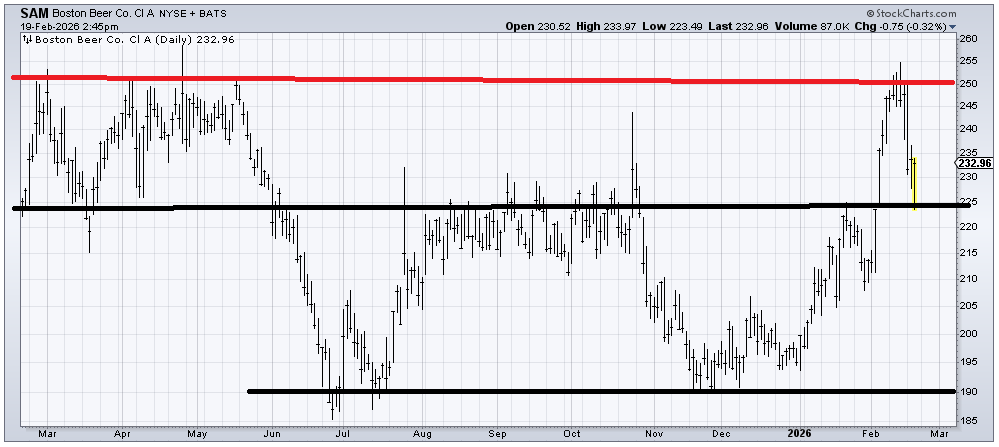
The natural instinct is to draw in this black line on the chart of Boston Beer (SAM) and say, okay bouncing off support. I think it does bounce off support. But I think the bounce is likely to fail. That move up to 255 last week, I think, is more likely than not to cap the upside on any rally (red line). I’ll call it a trading range for now because the stock has a history of spiking up and having little follow-through.
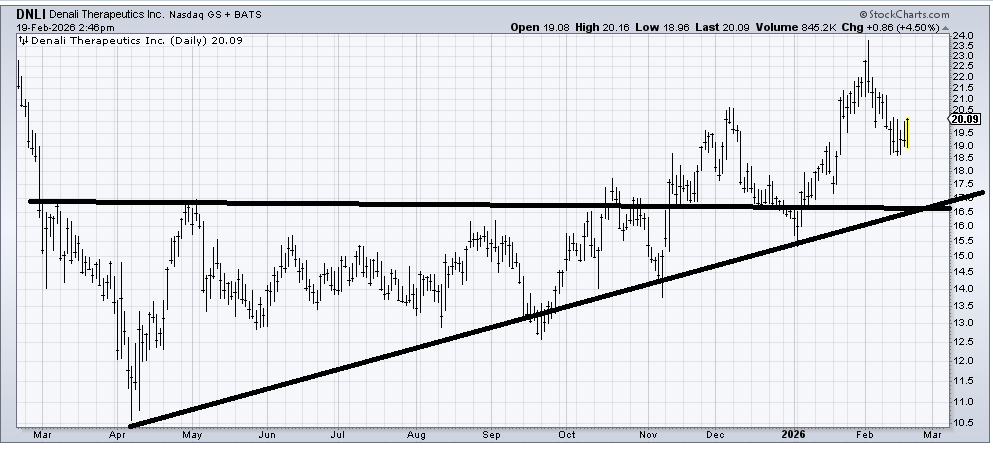
Denali Therapeutics (DNLI) is a nice chart that looks okay into this pullback. A stop seems quite far away, though (under 16), so that is not helpful. But if it can rally now (it should), but cannot get up and over that spike high at 23.50, I would get concerned.
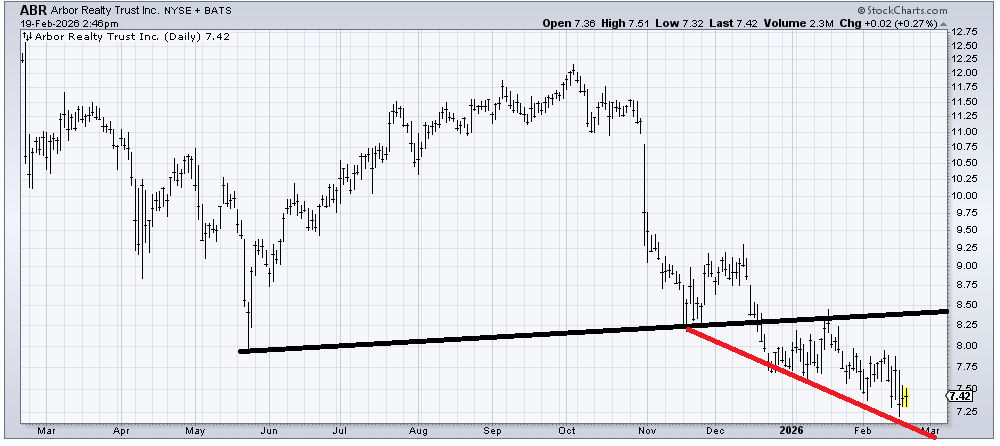
I don’t see much in the chart of Arbor Realty Trust (ABR) to get excited about. It’s a stock in a downtrend. The only good news is that it bounced off that red line. And it keeps bouncing off it. It would need to form a base to get me thinking it has stopped going down and is ready to do more. I have a measured target in the 5.50 area.