Bitcoin Traders See a Green Light at $75,000
This is a trader’s market, not a believer’s market.
You've reached your free article limit
You've read 0 of 1 free Pro articles.
 Bitcoin Reversal and Rising Bond Yields Pressure the Market
Bitcoin bulls still haven’t flipped the script. The downtrend that started last fall is intact, and the latest rejection above $75,000 didn’t help their case. That does not mean it is over, but it does mean buyers still have something to prove.
Step back for a second.
For me, a trend shift in BTC is not complicated. I want three things: Price above the eight-day and 21-day EMAs. The 8-day trading above the 21-day. Then I want to see buyers actually show up as price pushes through the 50-day SMA. Not just a quick move through it. I want real demand.
And once price is above the 50-day, it should not give it all back on a subsequent dip.
We saw that setup in late December and into January. All three boxes checked. On the chart, it looked right. In reality, it failed. Momentum never followed. Dip buyers never showed up in size. Once those signals rolled back over in late January, BTC did not drift lower. It dropped. Fast. That is what happens when technicals trigger, but participation does not follow.
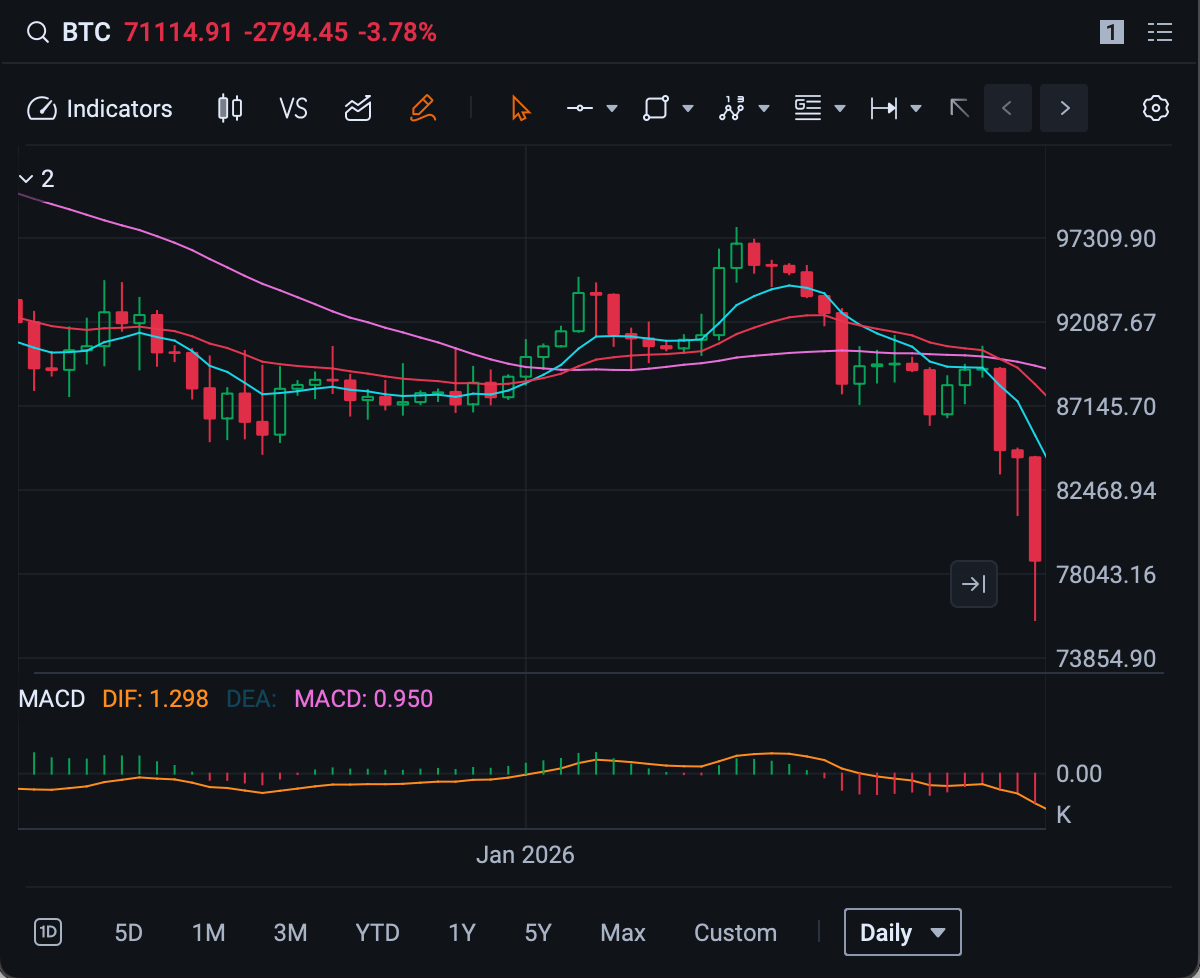
Now fast forward.
The move that started on March 9 checked the same three boxes again. Structurally, it is constructive. But here we are, already seeing hesitation after a rejection above $75,000. Price is still holding the key levels for now, but that rejection matters. It tells you supply is still sitting up there.
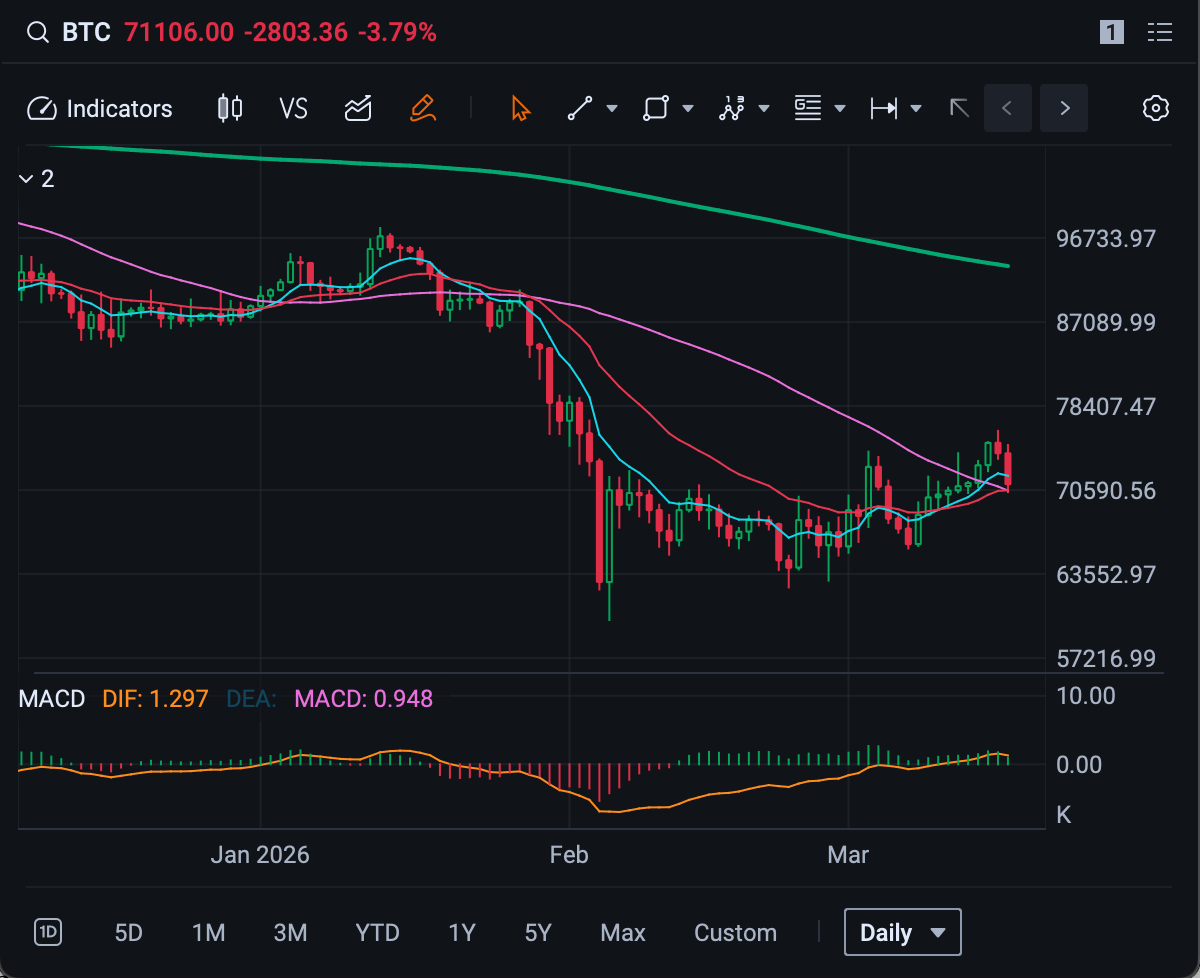
Here is the trade:
If you need confirmation, you wait. There is no reason to get aggressive until BTC is back above $75,000 and holding it.
If you are a trader, there is a different approach. You can lean long against $69,000 to $70,000. But this is a tactical trade, not a place to make a stand. If price starts living below the 21-day EMA and the 50-day SMA (currently around $70,500), the setup breaks. When it breaks, $62,500 comes into play quickly.
One more thing, and this is the big one:
That $74,000 to $75,000 zone is not random. On a weekly chart, it has been a decision point for many, many months. Above it, shorts are exposed. Below it, rallies keep failing.
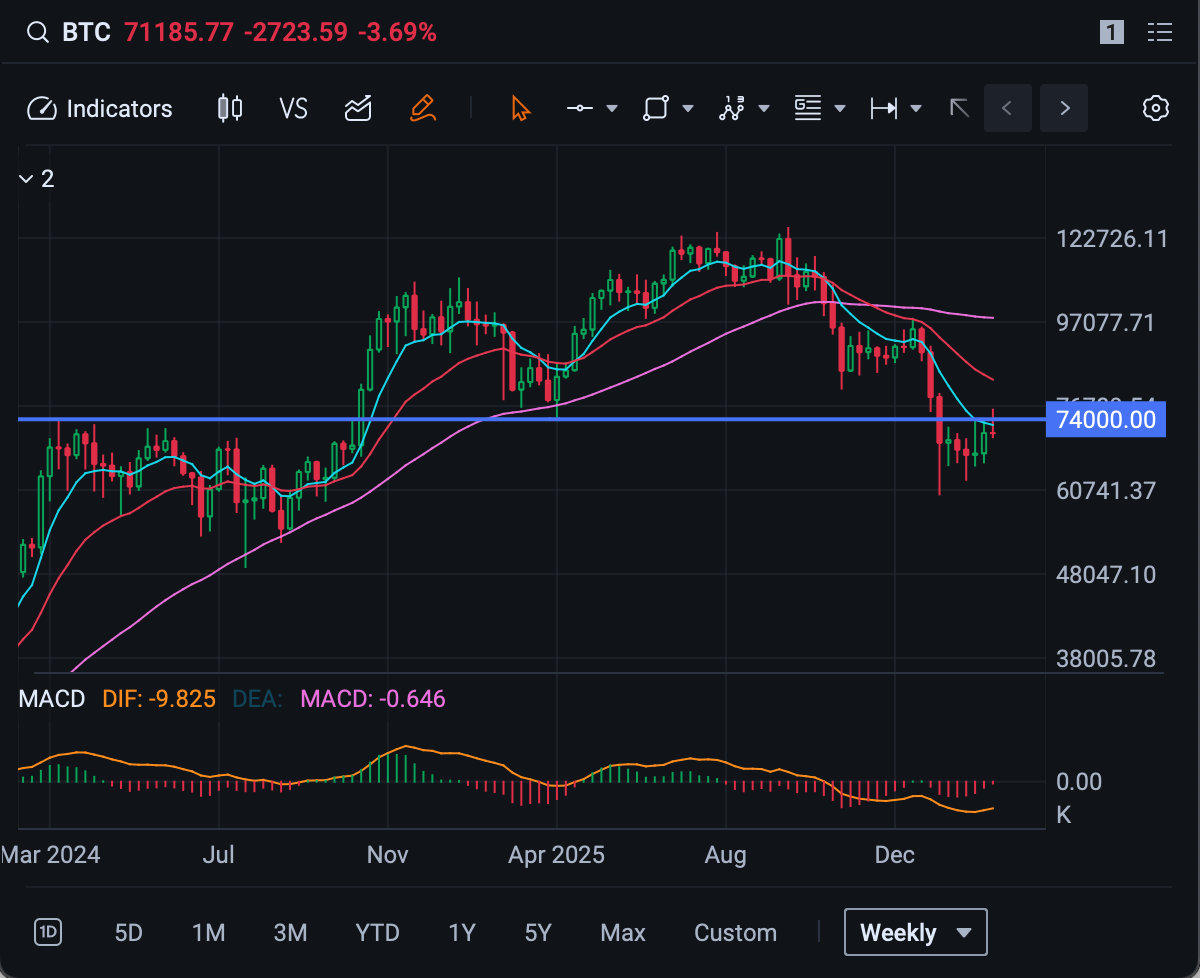
If BTC gets above that area and holds, you do not want to be stubbornly short. That is where squeezes start.
And if you are a swing trader, that is your green light. Not before.
Related: Fed Chair Jerome Powell Reveals Intent to Stay While Detailing Rate Cut Decision
At the time of publication, Byrne was long IBIT.
