Bitcoin Flirts With a Key Technical Line: Anatomy of a Trade
Bitcoin is pure emotion — and that’s exactly why this setup matters.
You've reached your free article limit
You've read 0 of 1 free Pro articles.

There was some hesitation to start the day but buyers are back to work and building on the streak of strong market action. It isn't quite as strong with breadth slightly negative, but the Roundhill Magnificent Seven ETF (MAGS) is leading the charge again with a gain of 1.5%.
Calling a Top Is a Fool's Errand
There are a lot of market players focused on calling a market top. My view is that we are due for a pullback but I don't expect it to be deep or to last for long.
I don't think it's worth trying to catch a little downside. If you are focused on trying to call a market top, look for an intraday reversal and a weak close.
Don't fight the strength. Wait for a sign of weakness before you make your move.
The Setup
The overanxious bears are helping to keep the positive action going and I am using my time to look for new opportunities. One of them is Bitcoin, or more precisely the iShares Bitcoin Trust ETF (IBIT) .
I have no interest in holding Bitcoin as a long-term investment. The proponents for cryptocurrencies have their narrative that are of no interest to me.
Bitcoin has no earnings, no balance sheet, and no intrinsic value in any traditional sense. What drives the price is supply and demand, and demand is driven almost entirely by emotions, which makes it an interesting asset class to trade.
Why Technical Analysis Is the Only Framework
When an asset is pure emotion, the only rational framework is technical analysis. Most people misunderstand what that means. Technical analysis is not a science. There are no rules that work a high percentage of the time. If it could be quantified, the most sophisticated algorithms would have arbitraged it away long ago.
A chart is a graphic depiction of shifting emotions. What happened in the past shapes the emotions that occur in the future.
When a large number of traders bought at a particular price, that level becomes significant. It is the line between profits and losses for everyone who bought there. That shared experience creates support and resistance in ways that have nothing to do with fundamentals and everything to do with human psychology.
What the Chart Is Saying
Bitcoin sold off sharply starting in late January and hit a low on February 5. Since then it has churned in a trading range, with three attempts to break higher that were each turned back. Tuesday's breakout failed to hold. The question now is how quickly support develops.
The 50-day simple moving average is sitting right at current levels. That is the key line. If it holds, the chart pattern remains constructive and the setup stays intact. If it breaks, the trade is off.
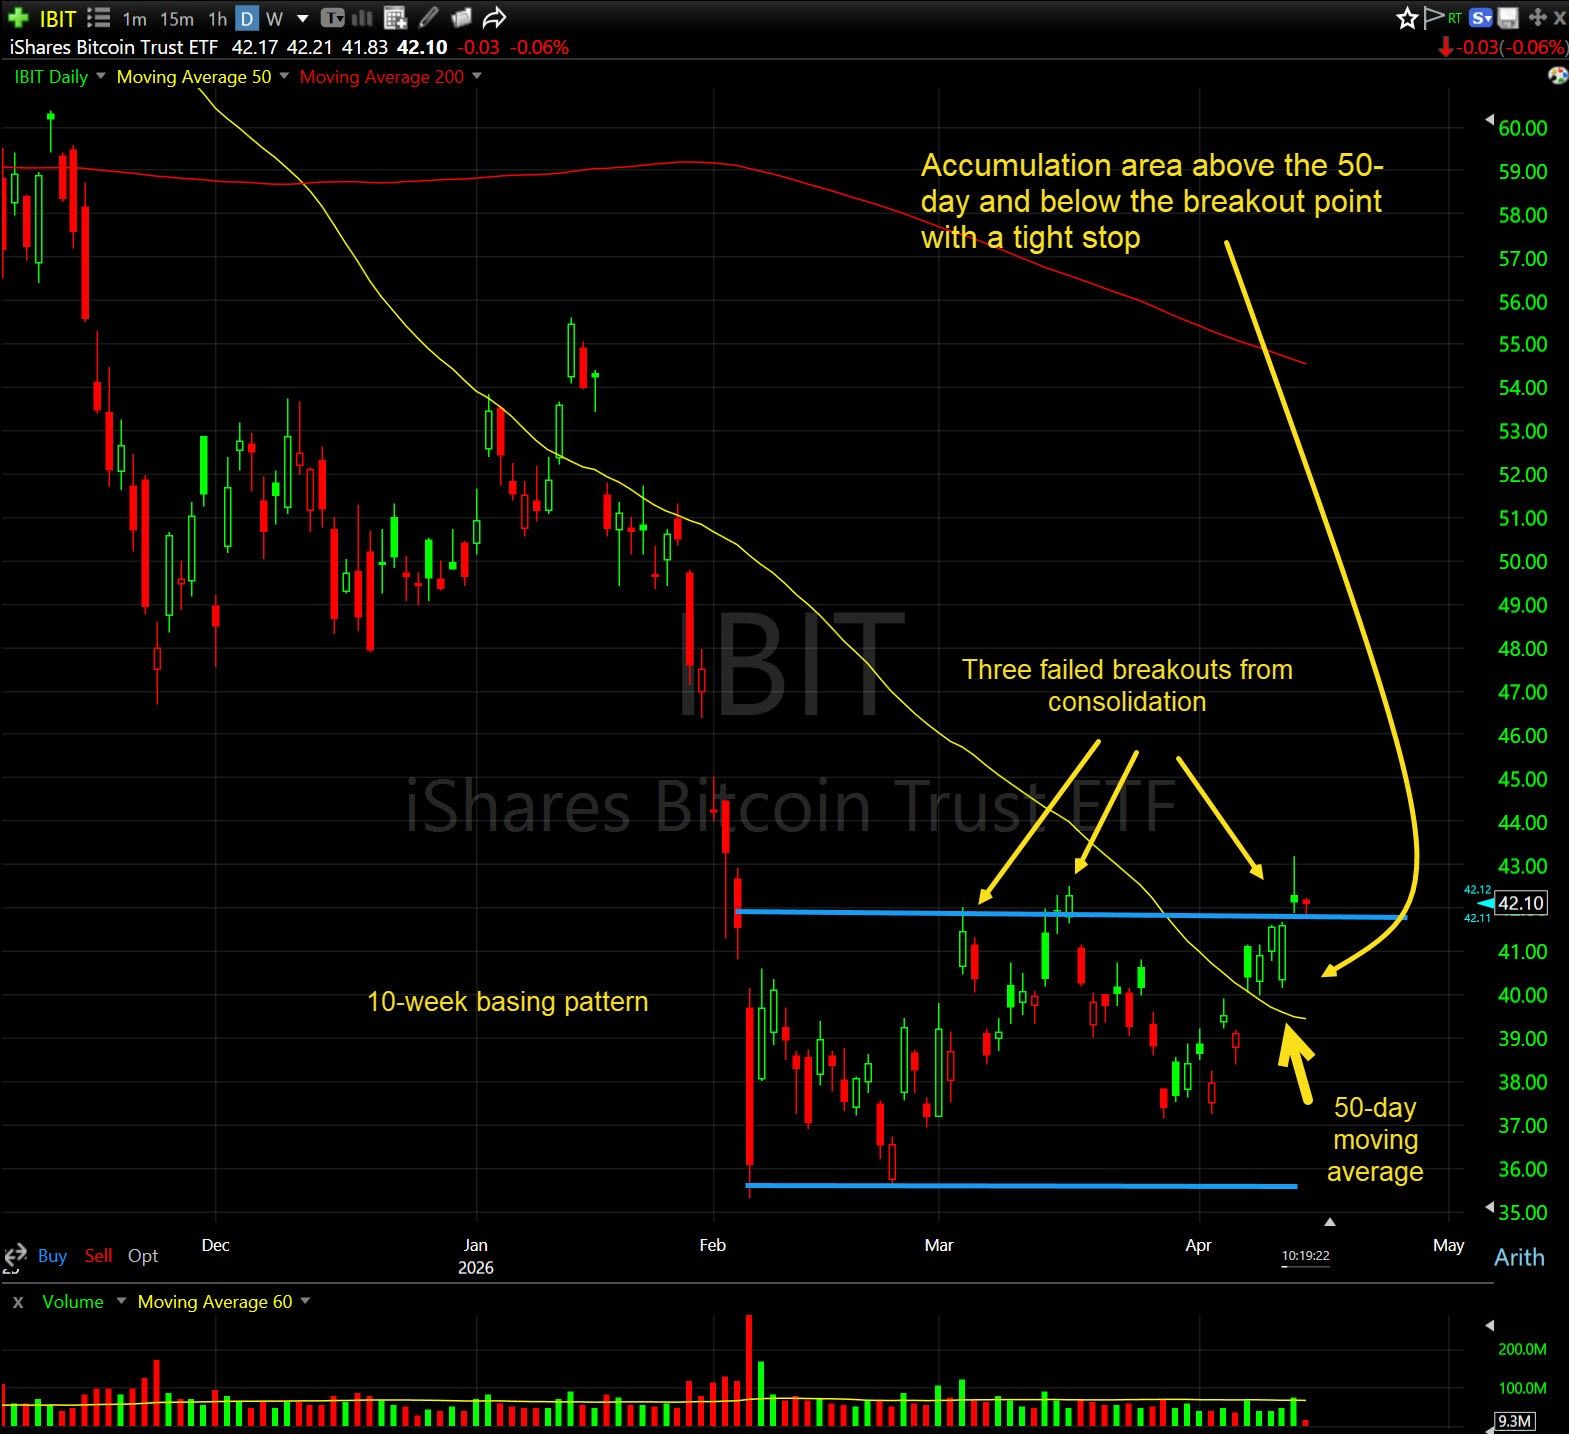
My Game Plan
My game plan is to establish an initial position here and look for additional entry points as the pattern develops. I will set a firm stop below the 50-day and build it a little as it develops.
The goal is to add some on the breakout and then be more aggressive if strong momentum develops. The asset is volatile and the emotions that drive it can shift fast. This isn't a big trade for me but it is an interesting technical setup, and the history of Bitcoin is sizable rallies once it starts to run.
Related: I'm Playing Small Ball (and Hanging With Disney) Until Coast Is Clear
At the time of publication, Rev Shark was long IBIT.
