Bearish Bets: 3 Miserable Charts During a Market Uptrend
These stocks are standouts — but not in a bullish way.
You've reached your free article limit
You've read 0 of 1 free Pro articles.
Let's check three stocks that appear technically bearish and look ready to short.
While we will not weigh in with fundamental analysis on these issues, we will pop the hood for a look at the charts.
Let's dig in.
HSBC May Just Be at the Start of a Larger Decline
Foreign banks have been pretty strong of late, performing much better than their U.S. counterparts. HSBC Holdings (HSBC) is one of those names, with a long string of higher highs, higher lows.
But recently the stock peaked and pulled down sharply on heavy turnover. That smacks of big institutional selling, but we so far only have early signs of it. Some serious downside action could be in front of us with some follow-through.
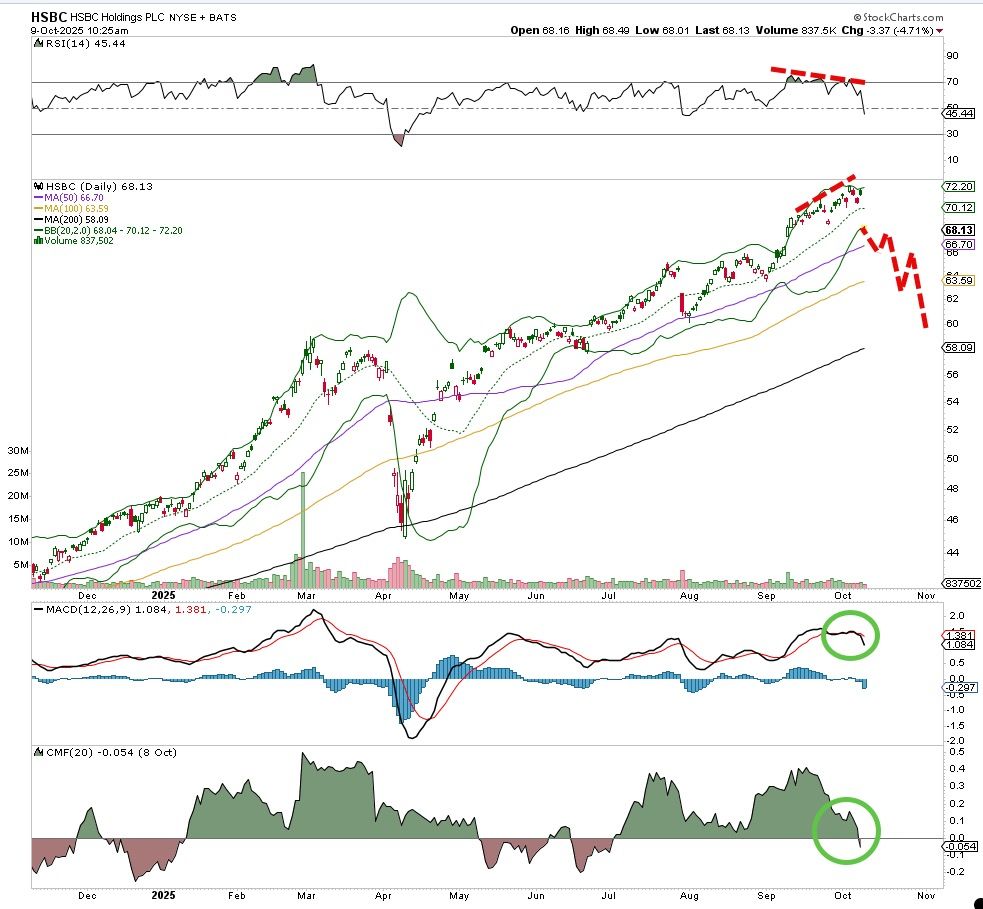
Indicators are weak, money flow just turned bearish and moving average convergence/divergence (MACD) confirmed a sell signal. No longer overbought on the relative strength index (RSI), this stock might make a run to the 200-day moving average, which sits around $58.
Let's target that spot, and put in a stop at $73 in case HSBC decides to turn back up.
AZZ Breaks Down and Looks to Probe Lower Levels
This AZZ (AZZ) has been troubled since breaking support a few weeks back. Now a series of lower highs, lower lows in place tells us the downtrend is ruling the chart.
Money flow is now bearish, and look at the volume bars too, which are strong when the stock is moving lower. MACD has been on a sell signal for some time, and the RSI is equally weak.
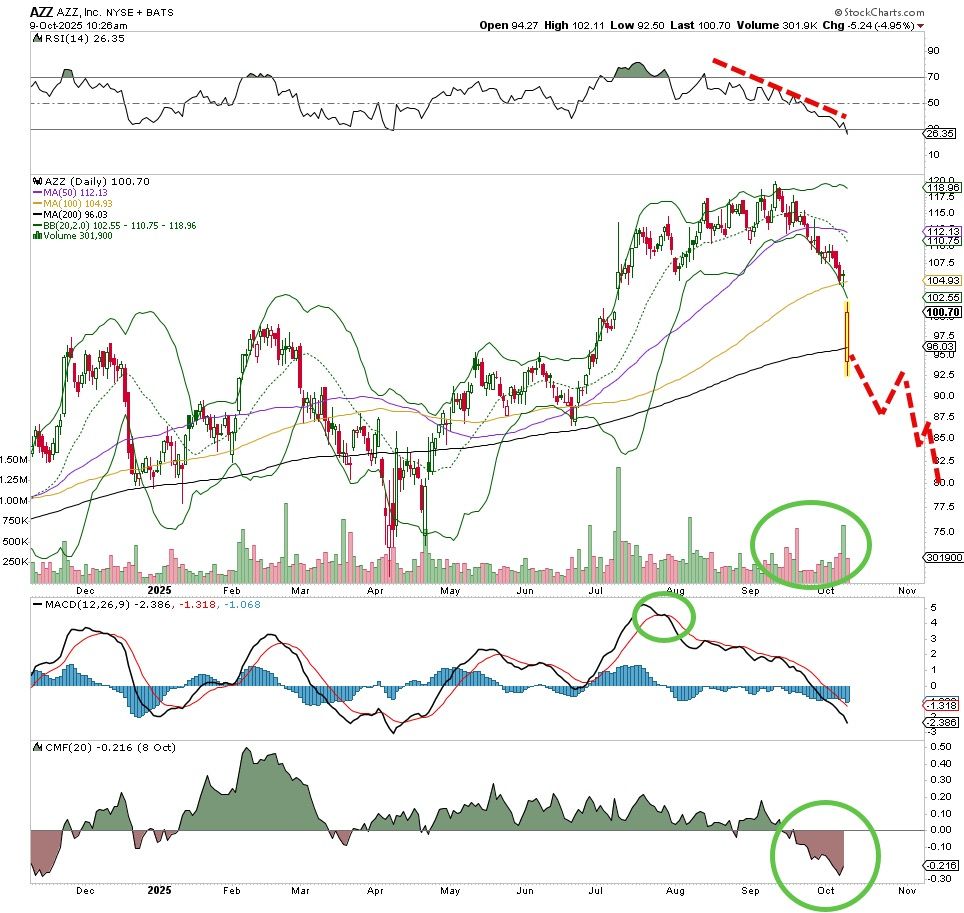
Breaking that 200-day moving average this past week and bouncing was not a shocker, but shorting here on this break looks to be good timing.
Let's target the $80 level. It might take some time to get there, so put in a stop at $110 just in case it decides to float up.
A 'Harrow'-ing Chart?
A clean break lower for Harrow (HROW) a few days back where the uptrend line was penetrated on higher volume. That spells trouble for the bulls in this stock, which has now established a downtrend pattern with higher volume trends. Money flow is weak and erratic, and the MACD now confirmed on a sell signal.
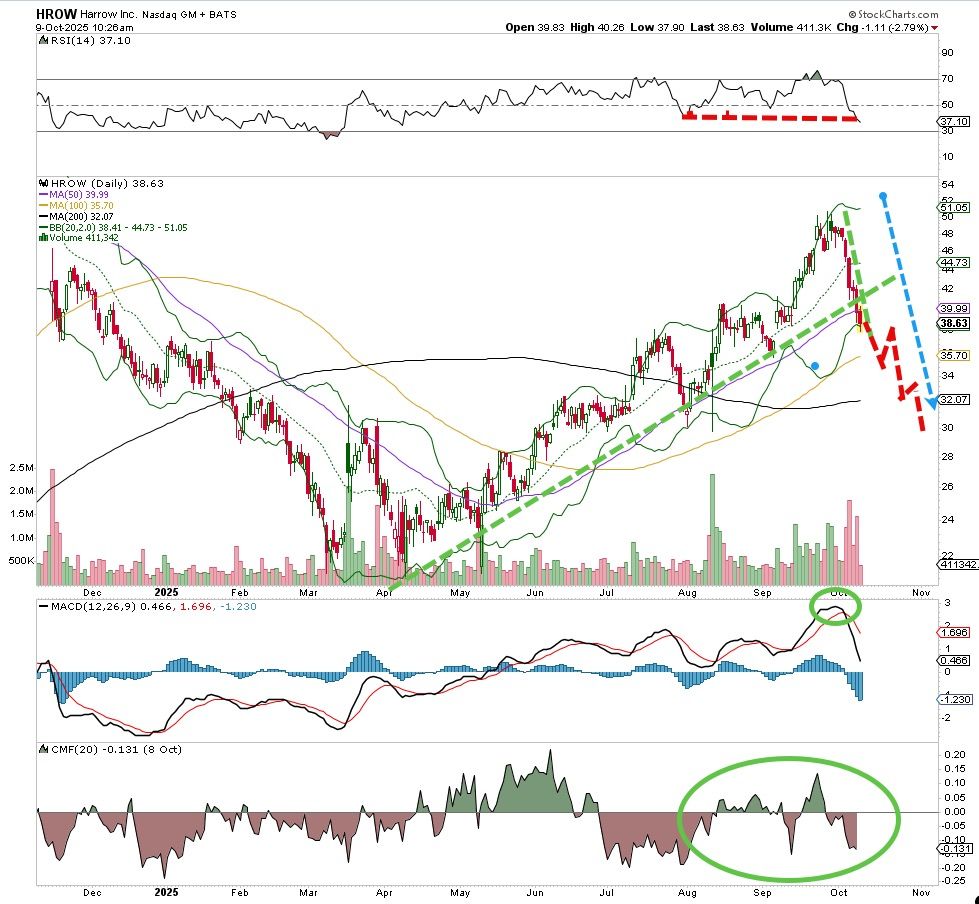
We could see the 200-da moving average come into play for a bounce, but I doubt that will be of any significance. Let's target that spot, which comes in at the $32 area, and put in a stop at $41 just in case. This chart is extremely bearish.
