Bear Markets Wear You Out and This One Is Exhausting
Let's look for signs that the market could rally.
You've reached your free article limit
You've read 0 of 1 free Pro articles.
The Market
It’s difficult to be a ray of sunshine in this market. Most days it feels downright impossible. Especially because I think after an oversold rally, we will come back down again.
But what signs do I see that we can actually rally? Especially after today’s action.
First of all, between yesterday and today, we probably shook out both longs and shorts with all the gyrations. Bear markets wear you out, and this one has been exhausting.
But the VIX is still jumpy. The put/call ratio now clocked in its fourth straight day of readings over 1.15. That means the ten-day moving average is now at 1.05. Considering the decline, it ought to be higher, but it’s heading there. The ISE call/put ratio remains a problem, though, as it refuses to sink under 1.0
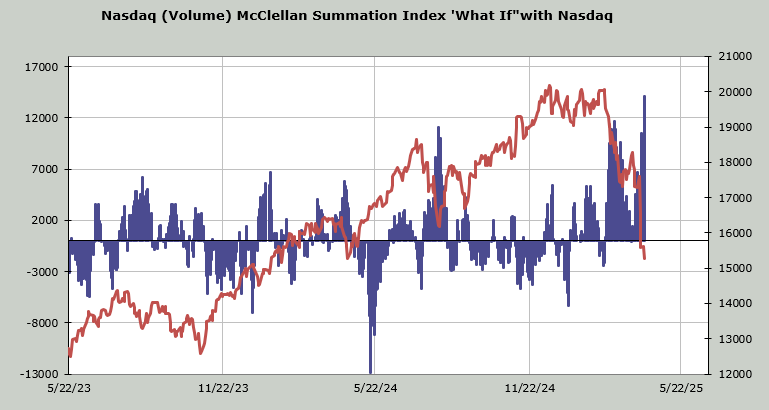
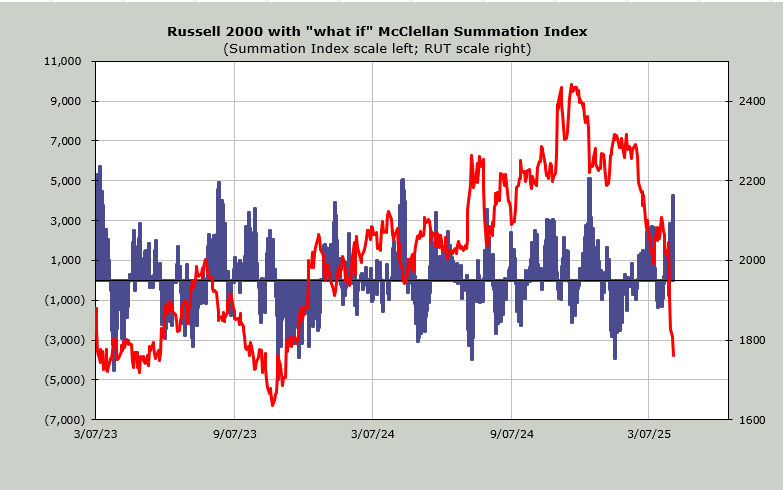
We’re still short-term oversold. Nasdaq is very much oversold. Just look at what it will take to turn the McClellan Summation Index from the current down to up (using volume). That is +14.2 billion shares. Nasdaq has been trading roughly 10,000 shares over the last few days, so this chart means we’d need to see 90% of the volume on the upside for at least 2 or 3 straight days just to get the indicator to stop going down. That is oversold.
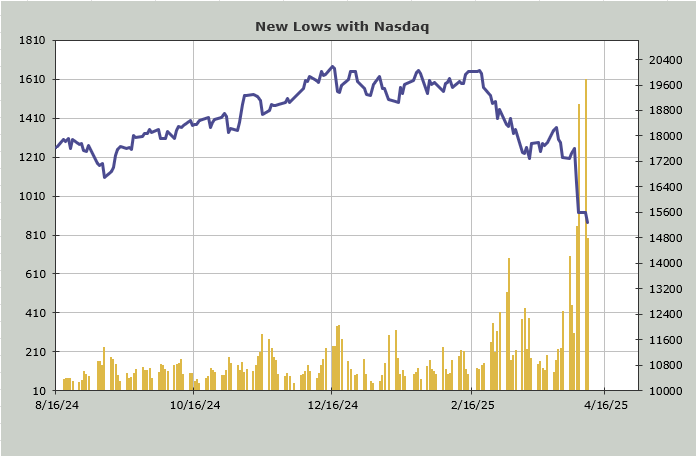
Both Nasdaq and the S&P made new closing lows today, and there were fewer stocks making new lows by a wide margin. That might change tomorrow on a big down opening, but it’s the first we’ve seen on a down day.
Nasdaq’s new lows on Monday were 1611, and today they were 790. The NYSE had 1162 new lows on Monday vs. Tuesday at 585.
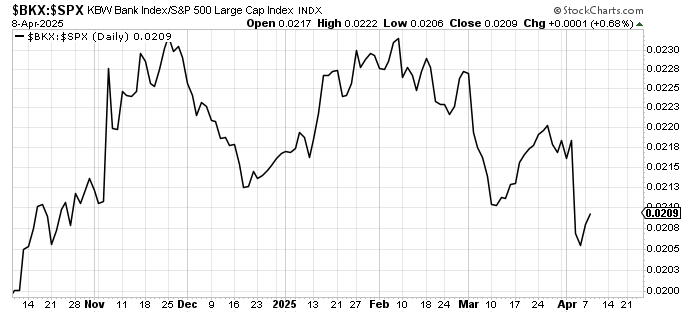
Here’s something else I am watching: the banks outperformed the S&P today. They report earnings at the end of the week, so I don’t want to trade them in advance, but it’s typically a good sign for a bounce when they outperform. Notice they did so off the mid-March oversold condition.
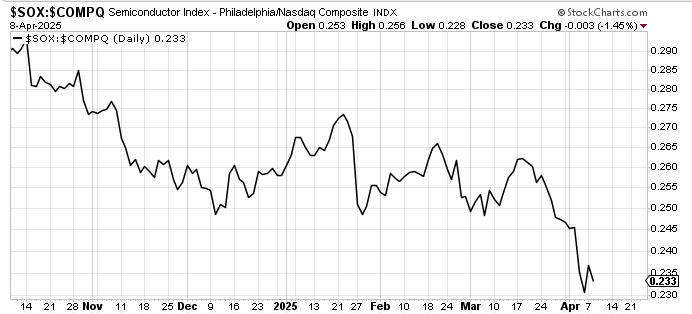
Then, there is the SOX relative to Nasdaq. It ticked down today but did not make a lower low. This is quite tenuous but worth watching to see if the semis can outperform.
It’s a treacherous market but we really should bounce before the week is out. Just remember, it’s a trading market. Don’t fall in love.
New Ideas
Once again, I will repeat that I would only look to trade the indexes.
Today’s Indicator
The McClellan Summation Index (for the NYSE) is still heading down. It now needs a net differential of +4300 advancers minus decliners on the NYSE to halt the slide. That’s finally getting oversold. +5000 has been what worked in the last few years.
Q&A/Reader’s Feedback
Helene welcomes your questions about Top Stocks and her charting strategy and techniques. Please send an email directly to Helene with your questions. However, please remember that TheStreet.com Top Stocks is not intended to provide personalized investment advice. Email Helene here.
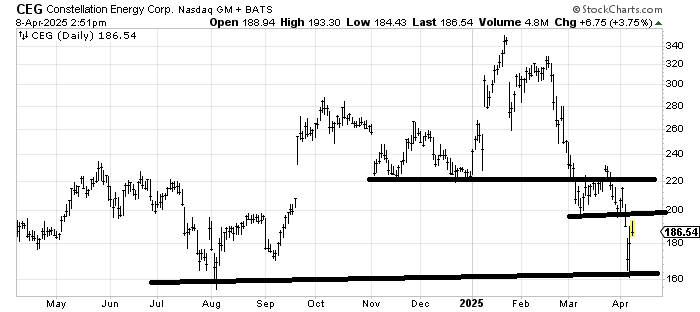
Constellation Energy CEG broke down but tagged support. That top it broke down from measures to around 100. I don’t know if it will get there, but I can tell you that if the stock gets into that 200-220 area, I’d be happy to sell some there. A break of 160-ish would, in fact, put that 100 target in play over a longer-term basis.
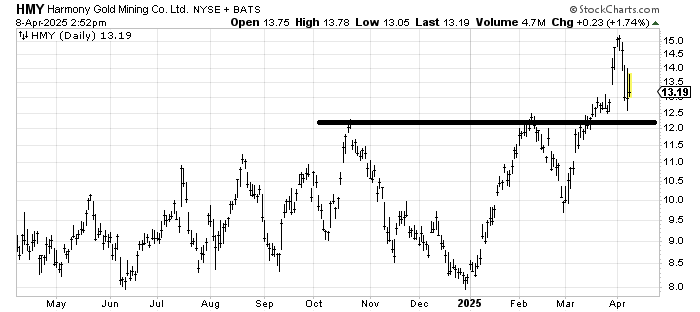
Harmony Gold HMY measures to 16-ish. So, my question is if that move just over 15 was enough. I’d give it some leeway, but if it breaks under 12, I would not hang around.
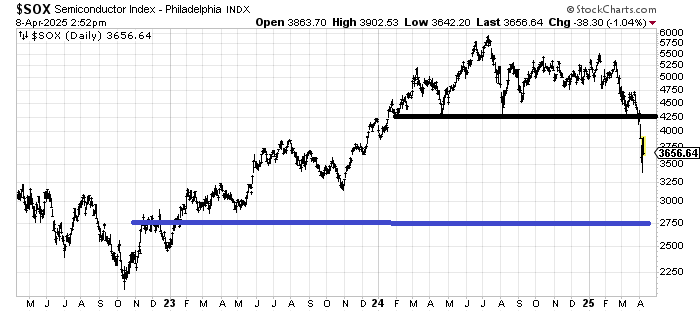
The question is what the downside target would be for the SOX, the Semiconductor Index. The sideways move it broke down from in early March measured to 3300, which is where it bounced from. It ought to bounce up toward 4000-ish now. A break of that 3300 area would then measure into the 2750 area but there are layers of support all the way down.