Bad Breadth, Yet the People Are Getting Giddy
As the market becomes short-term overbought, let's take a look at some important charts.
You've reached your free article limit
You've read 0 of 1 free Pro articles.
The Market
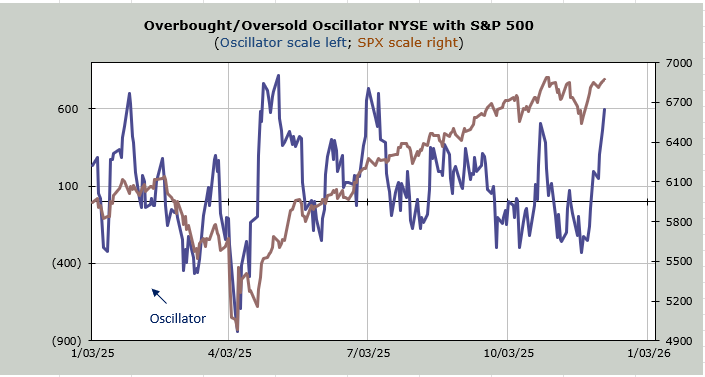
We have reached a short-term overbought reading in my work. We witnessed some of it on Friday when the 493 could no longer sustain the rally. But you know what? Breadth was actually red four of the five trading days last week. That means despite that one big up day, breadth was actually a tad negative on the week.
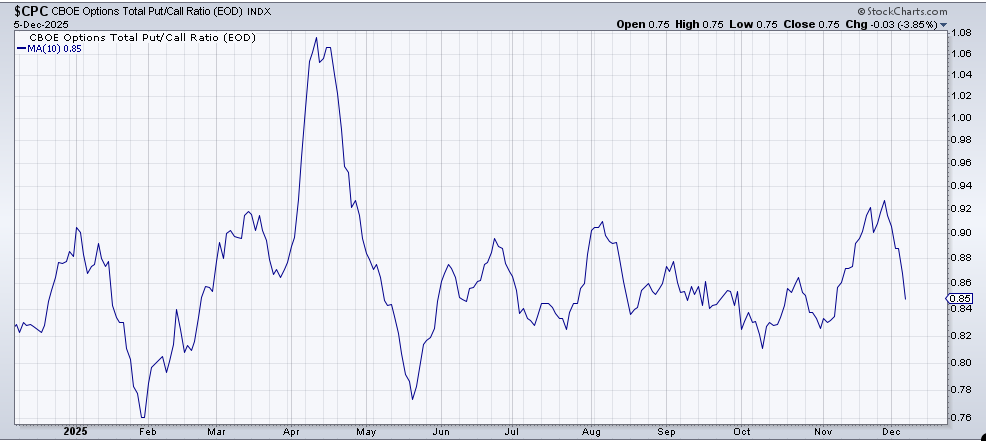
I’ll call it flat. But so was the S&P mostly flat, having gained a mere twenty points on the week. I would have thought that would hold folks back from getting too giddy, but alas, the equity put/call ratio on Friday sunk to .43, which tells me folks are a little bit giddy.
The ten-day moving average of the total put/call ratio did fall to .85, which means it has fallen quite a bit but is not extreme. I believe it is enough to get a pullback, though.
One reason I don’t think folks are ‘all in’ giddy though is that the Transports are now up ten straight days (!!!) and no one is fussing. If folks were breathless over the market, we’d see quite a bit of fussing over this move. I still like them, but want a pullback.
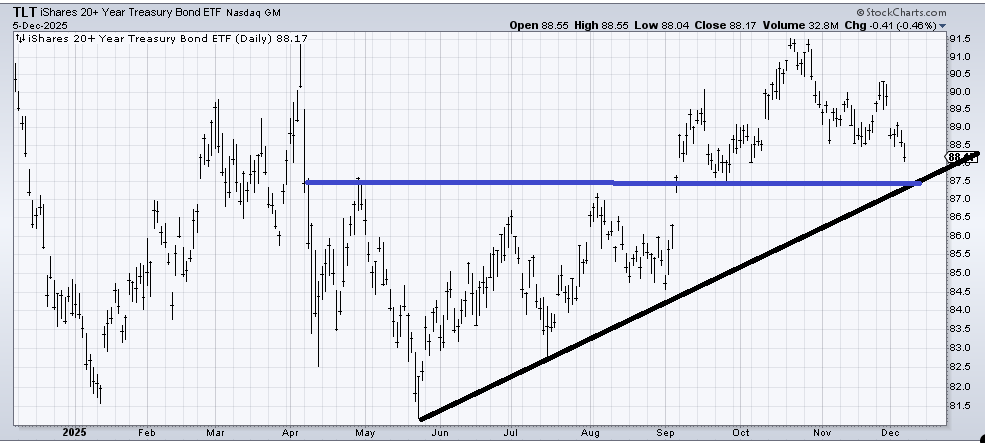
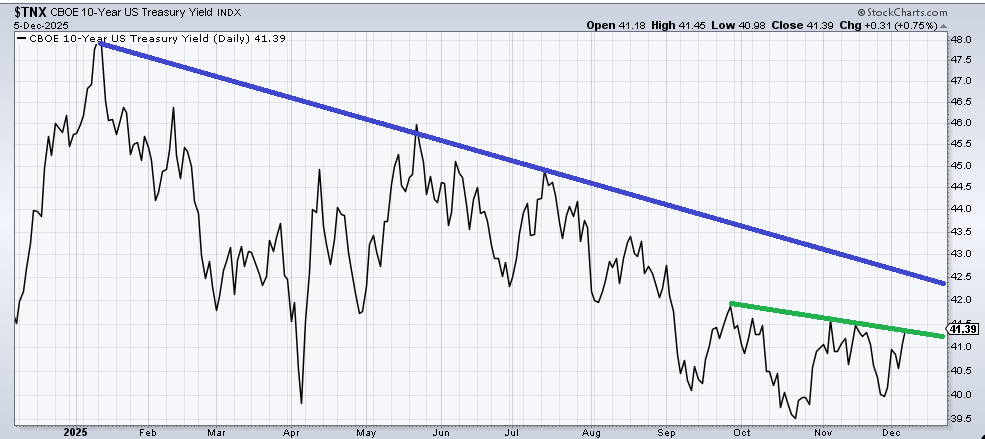
Perhaps they are not breathless over the Transports because they are finally focusing on the move in bonds. It seems even the non-chart folks can see the head and shoulders pattern in the bonds (a top in TLT, a bottom in rates) that I drew in a few weeks ago.
It is easier to measure the pattern on the yield chart than it is on (TLT) . TLT has decent support around 87.50 as the uptrend line comes in there, as well as a support line (blue).
On the yield chart, it seems a bit cleaner to me. Crossing the green line completes the head and shoulders pattern (call it 4.15%-ish). But you see that blue line that comes in around 4.25%? That resistance has stopped every push-up in rates all year, so to me that is more important.
There is one other point I’d like to make: that head and shoulders bottom measures to 4.35% These are not big moves. Not yet.
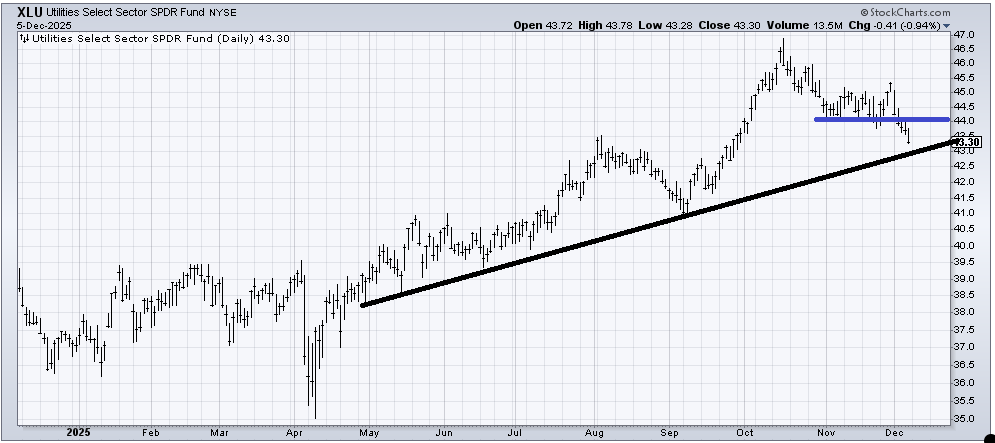
Which brings me to the Utes. I thought the 44 level would hold on (XLU) , and I was wrong. That move down last week did not even take a breather at 44. I now think 43 should hold (black line), but if they can blow through 44 so readily, this seems to be the area to watch.
New Ideas
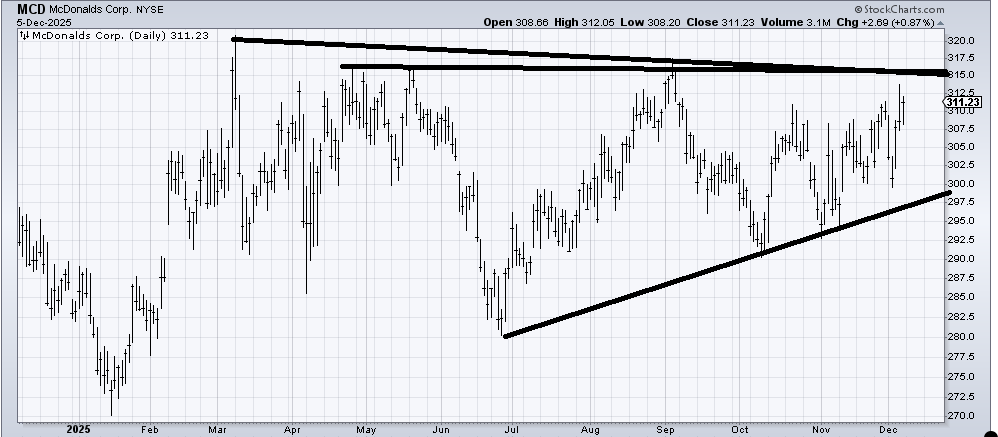
Having gone nowhere all year but being one of the few restaurant stocks that didn’t really break down in last summer’s disaster for restaurant stocks, I find myself warming up to McDonald’s (MCD) . On a short-term basis, it’s a coin toss, but get it up and over that 315 area, and this starts to look like a breakout from a multi-month sideways.
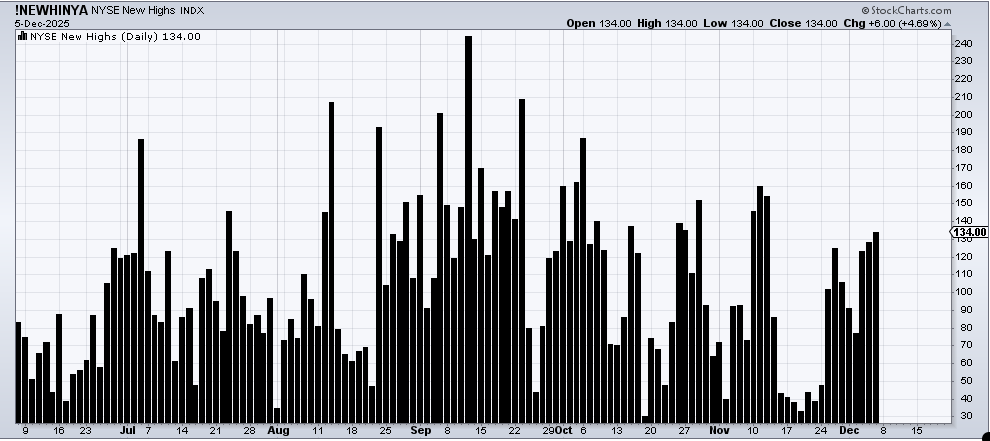
Today’s Indicator
The new highs continue to lag. But new lows are not expanding either.
Q&A/Reader’s Feedback
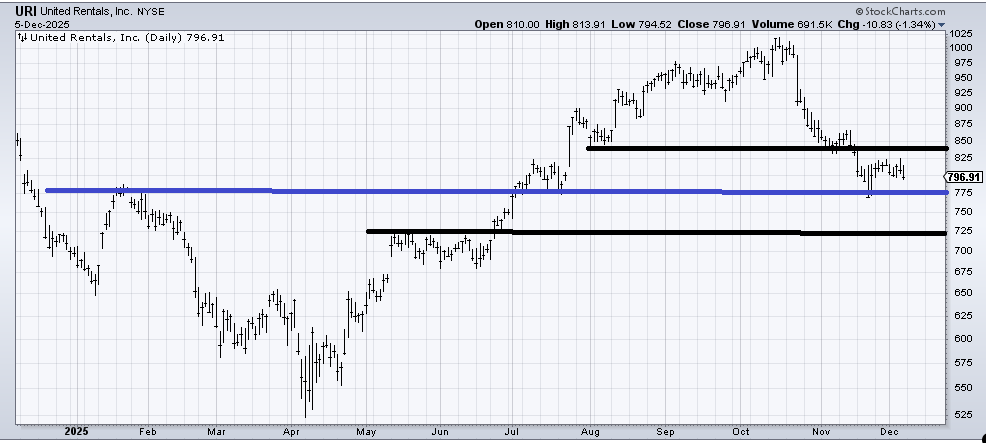
United Rentals (URI) is not a pretty chart, having broken down nearly two months ago and has barely rallied since. I suspect that this trip down toward that 775 area leads to another bounce. If I am wrong, then 700-725 would be the next support (and a measured target). But right now, that 850 resistance looms large. I would love to see a whack into that lower range (700-725) to have the chart meet its target and clean out any weak holders. That would give me confidence this stock could enjoy a nice rally in the new year.
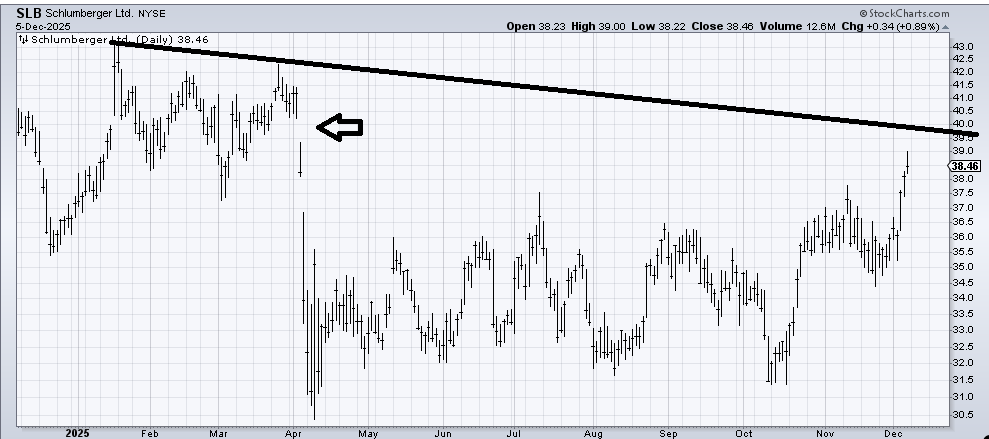
I was asked for a target on Schlumberger (SLB) , which I believe I first recommended months ago, and has taken so long to move. There is a first target in that 39.50-40 area due to the gap and the downtrend line. I don’t have a longer-term target yet.
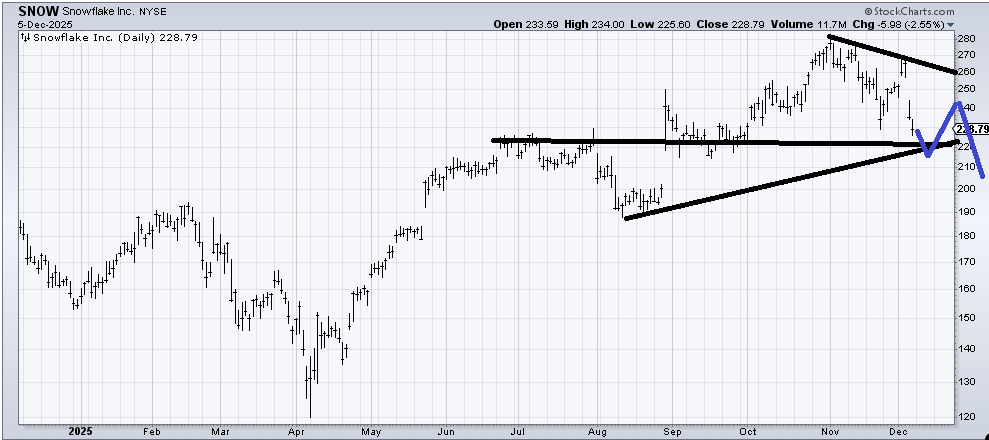
Snowflake (SNOW) has several problems. First of all, that gap up last week followed by the gap down, leaves an island overhead (bearish), but also, here is yet another of last year’s winners that is now trading the same place it was last summer. There is enough support in that 215-220 area to give a bounce, but lately, trying to catch a falling knife in these stocks that have gapped down has not been the right move. I would think the pattern I drew in blue might develop now.
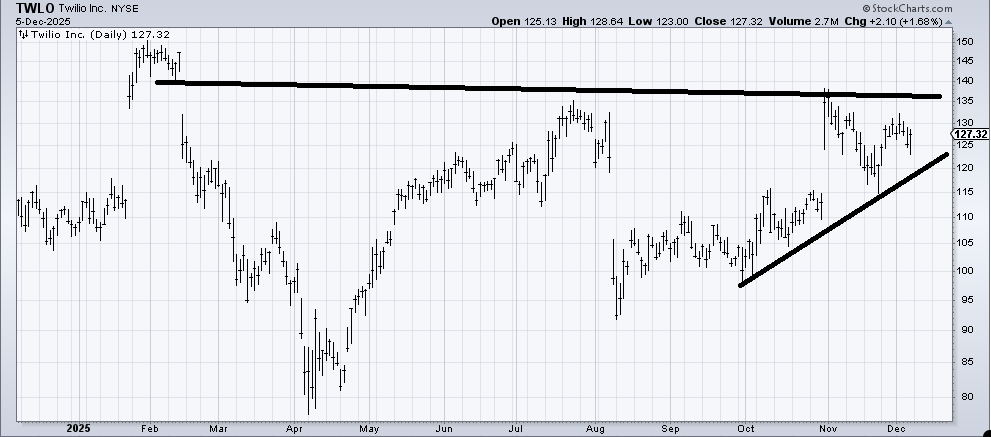
Twilio (TWLO) is an interesting chart. As long as it stays over that uptrend line, I’d lean toward seeing it get to (at least) 135 resistance, mostly because it filled that gap down below (at 115) after having left the action between August and October as an island (bullish).