As We Near Overbought Levels, Will a Pause Refresh Buying Interest?
After nine straight up days, the market is ready for a down day or two.
You've reached your free article limit
You've read 0 of 1 free Pro articles.
 Traders
The Market
For the last several months, we have had a market that gets short-term oversold when the intermediate term is not oversold. And we have a market that gets short-term overbought when the intermediate term is not overbought. I think that’s why we have spent so much time back and forth in the major indexes.
Nasdaq has now rallied for nine straight days, and by now you should know my rule: the longer the rally goes without a down day, the worse it is. So, you should hope we see a down day or two.
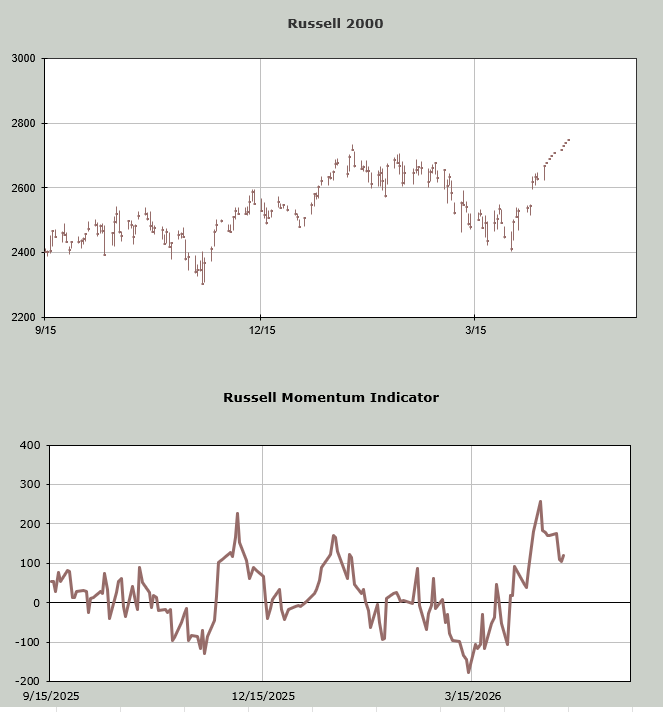
My own Overbought/Oversold Oscillator gets overbought Tuesday or Wednesday. When it comes to the Russell Momentum Indicator, I plug in higher closes for the Russell over the next week, and you can see the indicator heads south.
I do not take this as a negative but rather as a reason for a pause. And keep in mind, the same applies to overboughts as oversolds: the exact day is not written in stone, it’s a general time frame.
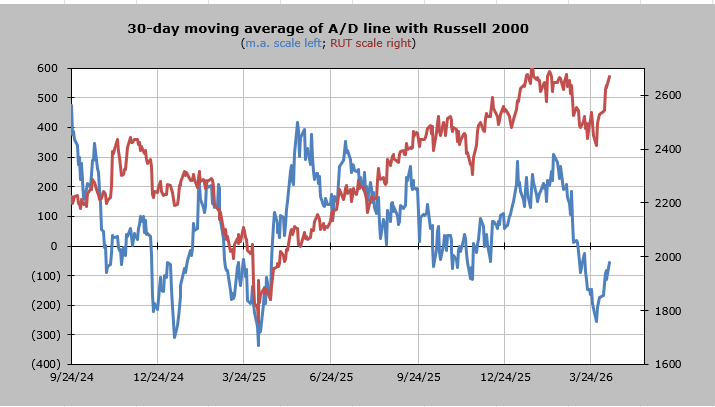
Notice on the chart that the indicator got oversold on or about March 15th which is when the Russell started that whole sideways pattern of forming a small bottom. I would expect the short term to lose some momentum this week.
Then there is sentiment, which is finally turning. Last week, I noted that I saw it anecdotally, but today I have data for you. The last three trading days have seen the total put/call ratio under .90. There is nothing extreme, and the ten-day moving average is still pretty high (bullish), but the slow conversion is happening.
Then there is the ISEE call/put ratio. As you know, it has been consistently low. Today, the equity-only portion jumped up to 2.78. This is the highest reading since mid-January, so I take that as folks dove in with both feet today. That’s a big change. But again, the moving averages are just now turning, so it’s not bearish, just noteworthy that there is a change.
And then there is software. I mean, what’s a day without a note on software?! It rallied (as it should have), and I just love how folks were so bearish on Friday (recall my comment yesterday how the replies to my tweet on the high volume in IGV was around 9 to 1 negative), and now everyone is saying the bottom is in!
For the time being, I just think software is coming off Discouragement and was in desperate need of a rally. At some point, it will diverge from the Sentiment Cycle chart I keep showing, only because analogies always fall apart at some point. We’ll monitor the action and sentiment there. Volume was pretty high in many stocks, so my guess was it was a decent round of short covering.
New Ideas
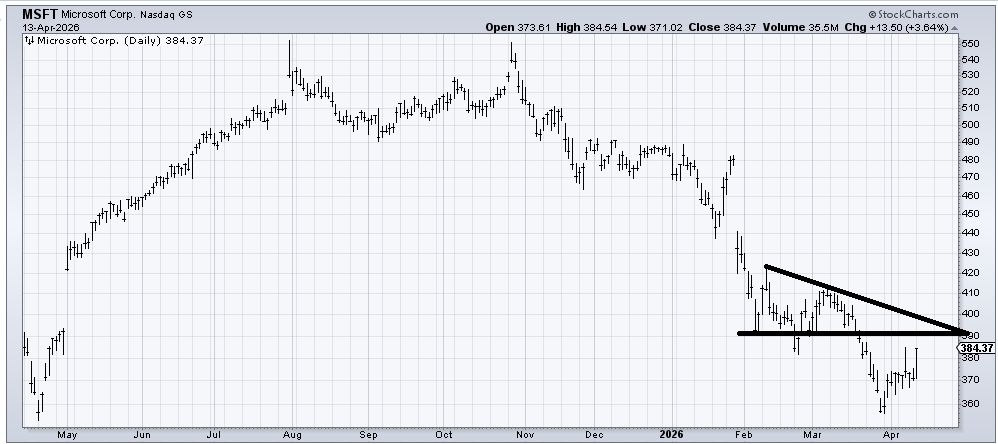
I’ve had a few questions on where I think Microsoft (MSFT) is going. My initial recommendation was down around 360, and my initial target was that resistance in the 390-400 area. It might turn into a much better bottom than just a trade, but if you are trading it, that’s the first spot. As I explained last week, I liked that it has been outperforming IGV.
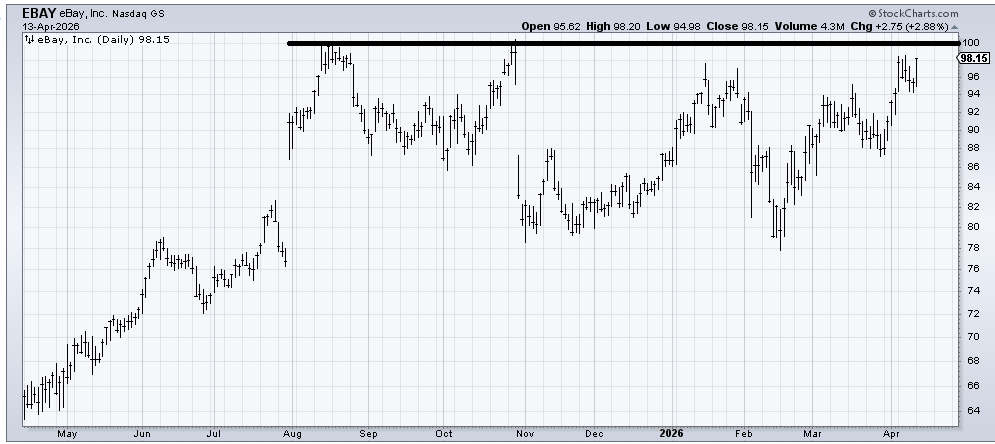
With the market getting short-term overbought, it’s hard to get too excited over a chart like eBay (EBAY) , but I feel the need to highlight it because I have so few retailers that look like this. If it breaks out over 100, we could see some excitement.
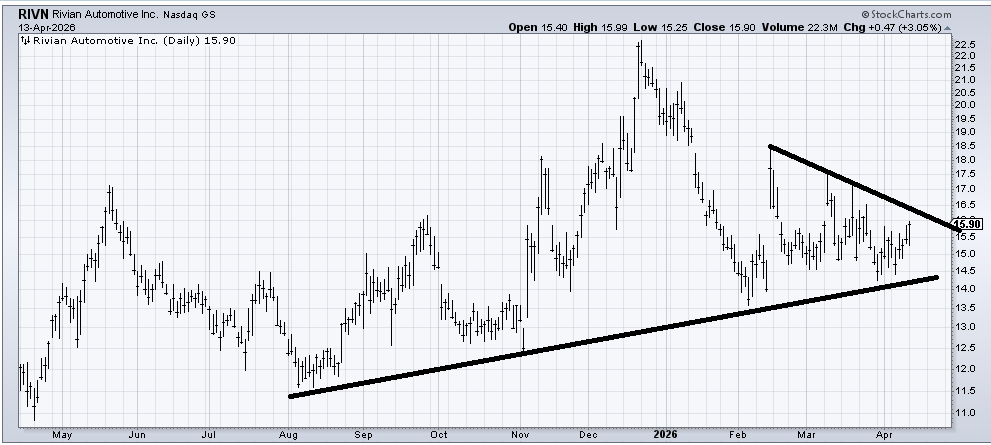
This is also a good time to remind you that Rivian (RIVN) , which I highlighted late last year as a big base stock for 2026, had that nice run and came back to the base. It’s still basing.
Today’s Indicator
The 30-day moving average of the advance/decline line is oversold. I wish it had gotten oversold two weeks ago.
Q&A/Reader’s Feedback
Helene welcomes your questions about Top Stocks and her charting strategy and techniques. Please send an email directly to Helene with your questions. However, please remember that TheStreet.com Top Stocks is not intended to provide personalized investment advice. Email Helene here.
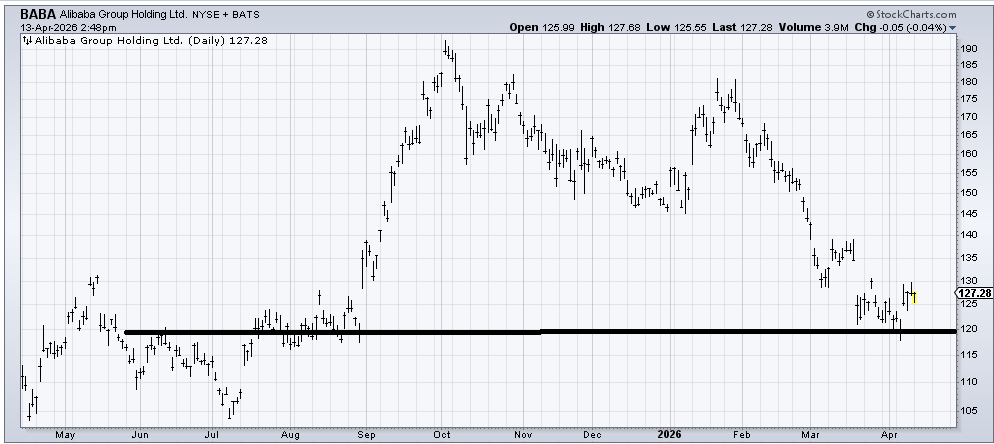
Three separate people asked about different Chinese tech stocks, so I will just address them together. I should preface this by noting that I have thought Alibaba (BABA) has been trying to make a bottom for a while, and I have been wrong.
(BABA) has come all the way down to support. It can’t seem to rally well, but like so many charts, it has spent the last several weeks just churning around down here. So, I think it should play catch-up. If it cracks under 120, I am wrong.
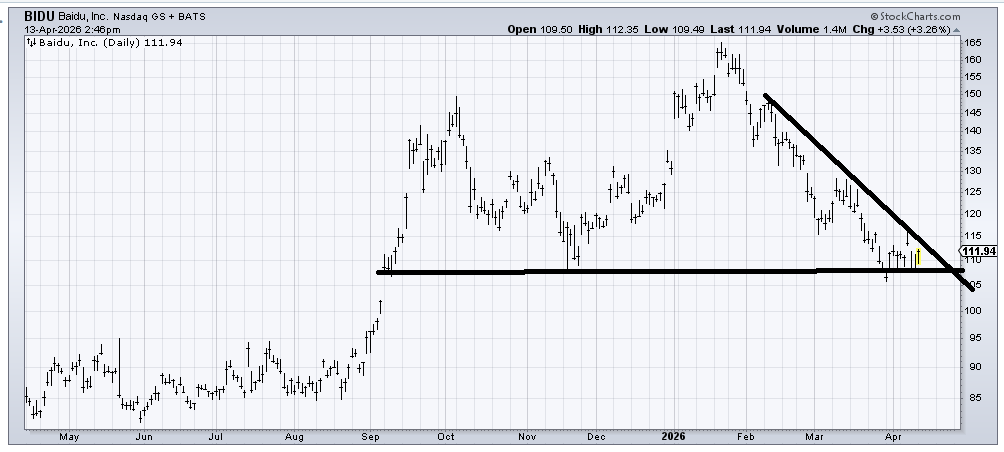
Baidu ( (BIDU) ) has some good support down here as well, but it hasn’t participated in the rally at all. It is possible that it breaks that support line and fills that gap around 103, but it feels like it is trying to bottom to me. It is at least worth a trade. And if it can cross that downtrend line, it might get folks excited.
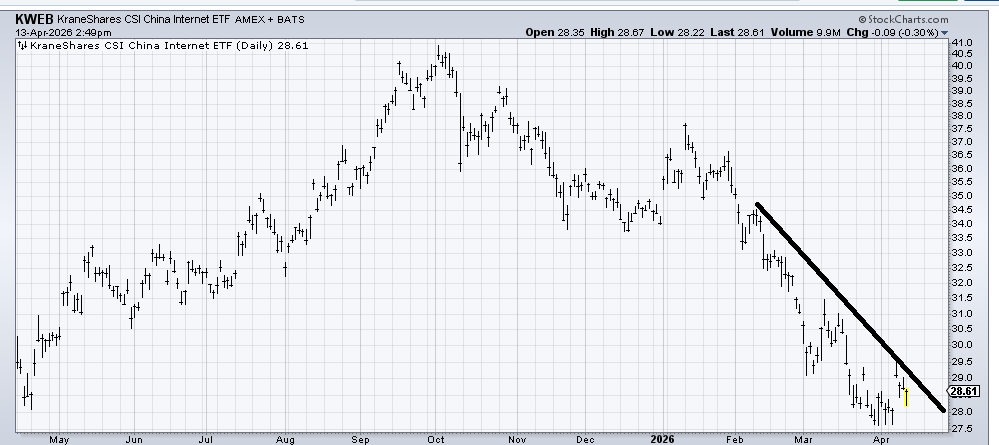
(KWEB) , an ETF to be long Chinese Internet stocks, is also down and out. The top it broke down from (at 34) measures to 28, so now I am hopeful it can cross that downtrend line, but if it cannot do so in the next two weeks, then I am wrong.
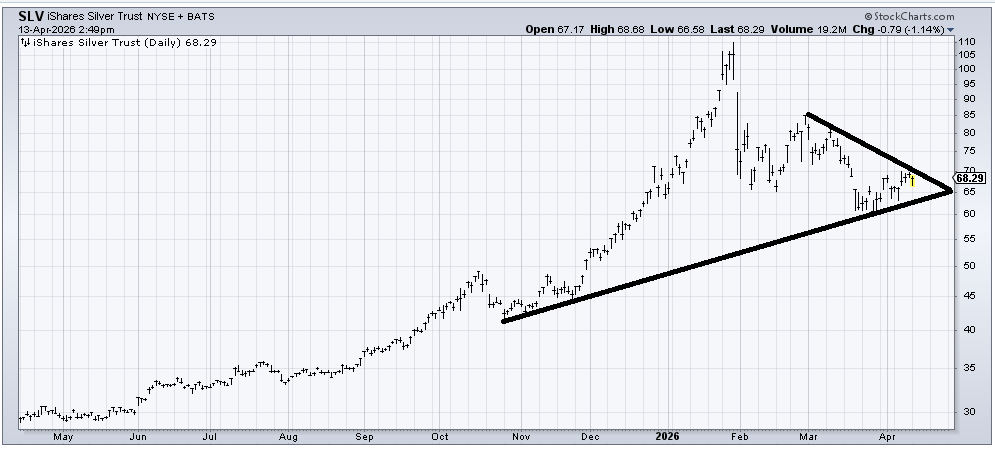
I have said I think (SLV) was a bubble that burst back in January. If it can cross that 70 area, maybe it has a little rally to resistance around 73-75, but generally speaking, it feels more like dead money to me.
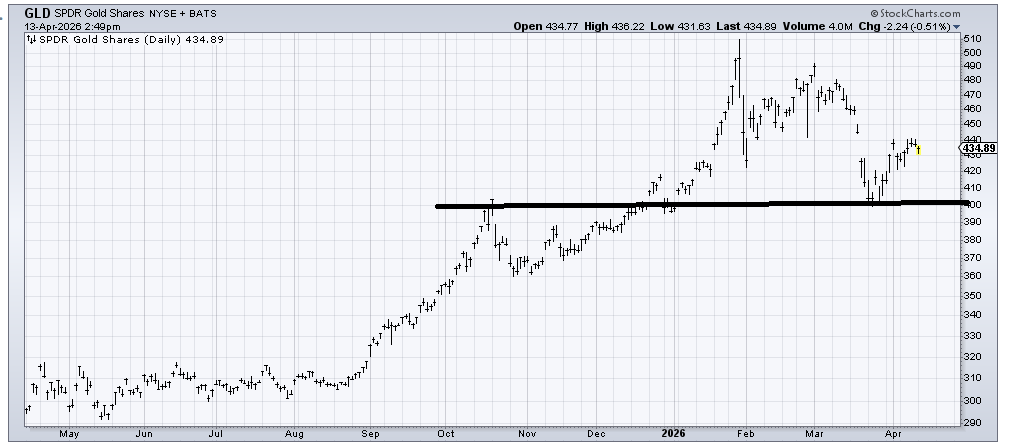
When (GLD) got down to 400, I said I thought it was oversold (also because the DSI got to 15), but it hasn’t done much in a couple of weeks. I would love to see it pull back into that 400-410 area to flesh out the chart and make it feel better. In fact, I would love it to just go back and forth for a few months to build some sort of pattern.
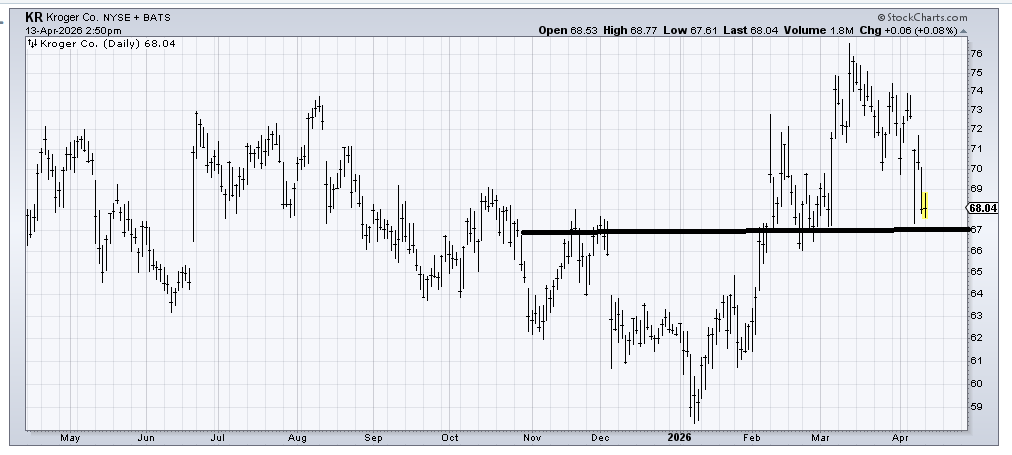
Kroger (KR) gave up a new high too easily in my view. There is support at 67, but a break of 67 would be bearish.
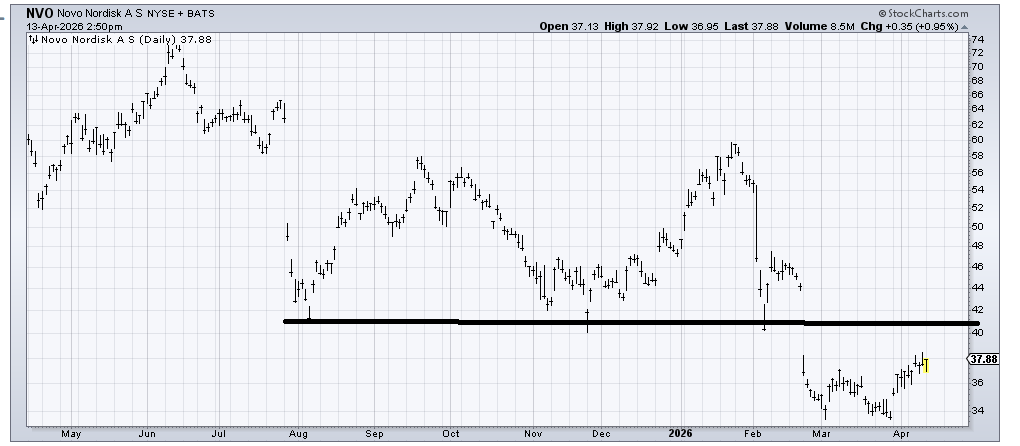
Novo Nordisk (NVO) should try and fill that gap in the 40-42 area.
Related: Will Meta Really Take Google's Digital Ad Crown at the $240 Billion Mark?
