As Volatility Reigns, the Russell 2000 Emerges With Best Technicals
For U.S. companies listed on the Russell 2000, there’s no place like home.
You've reached your free article limit
You've read 0 of 1 free Pro articles.
 Charting the Russell 2000: Bears Are Still In Charge
Feeling exhausted by market volatility? Seasick from intraday swings?
Maybe things aren’t as bad as they seem. Most indexes are actually trading in a range.
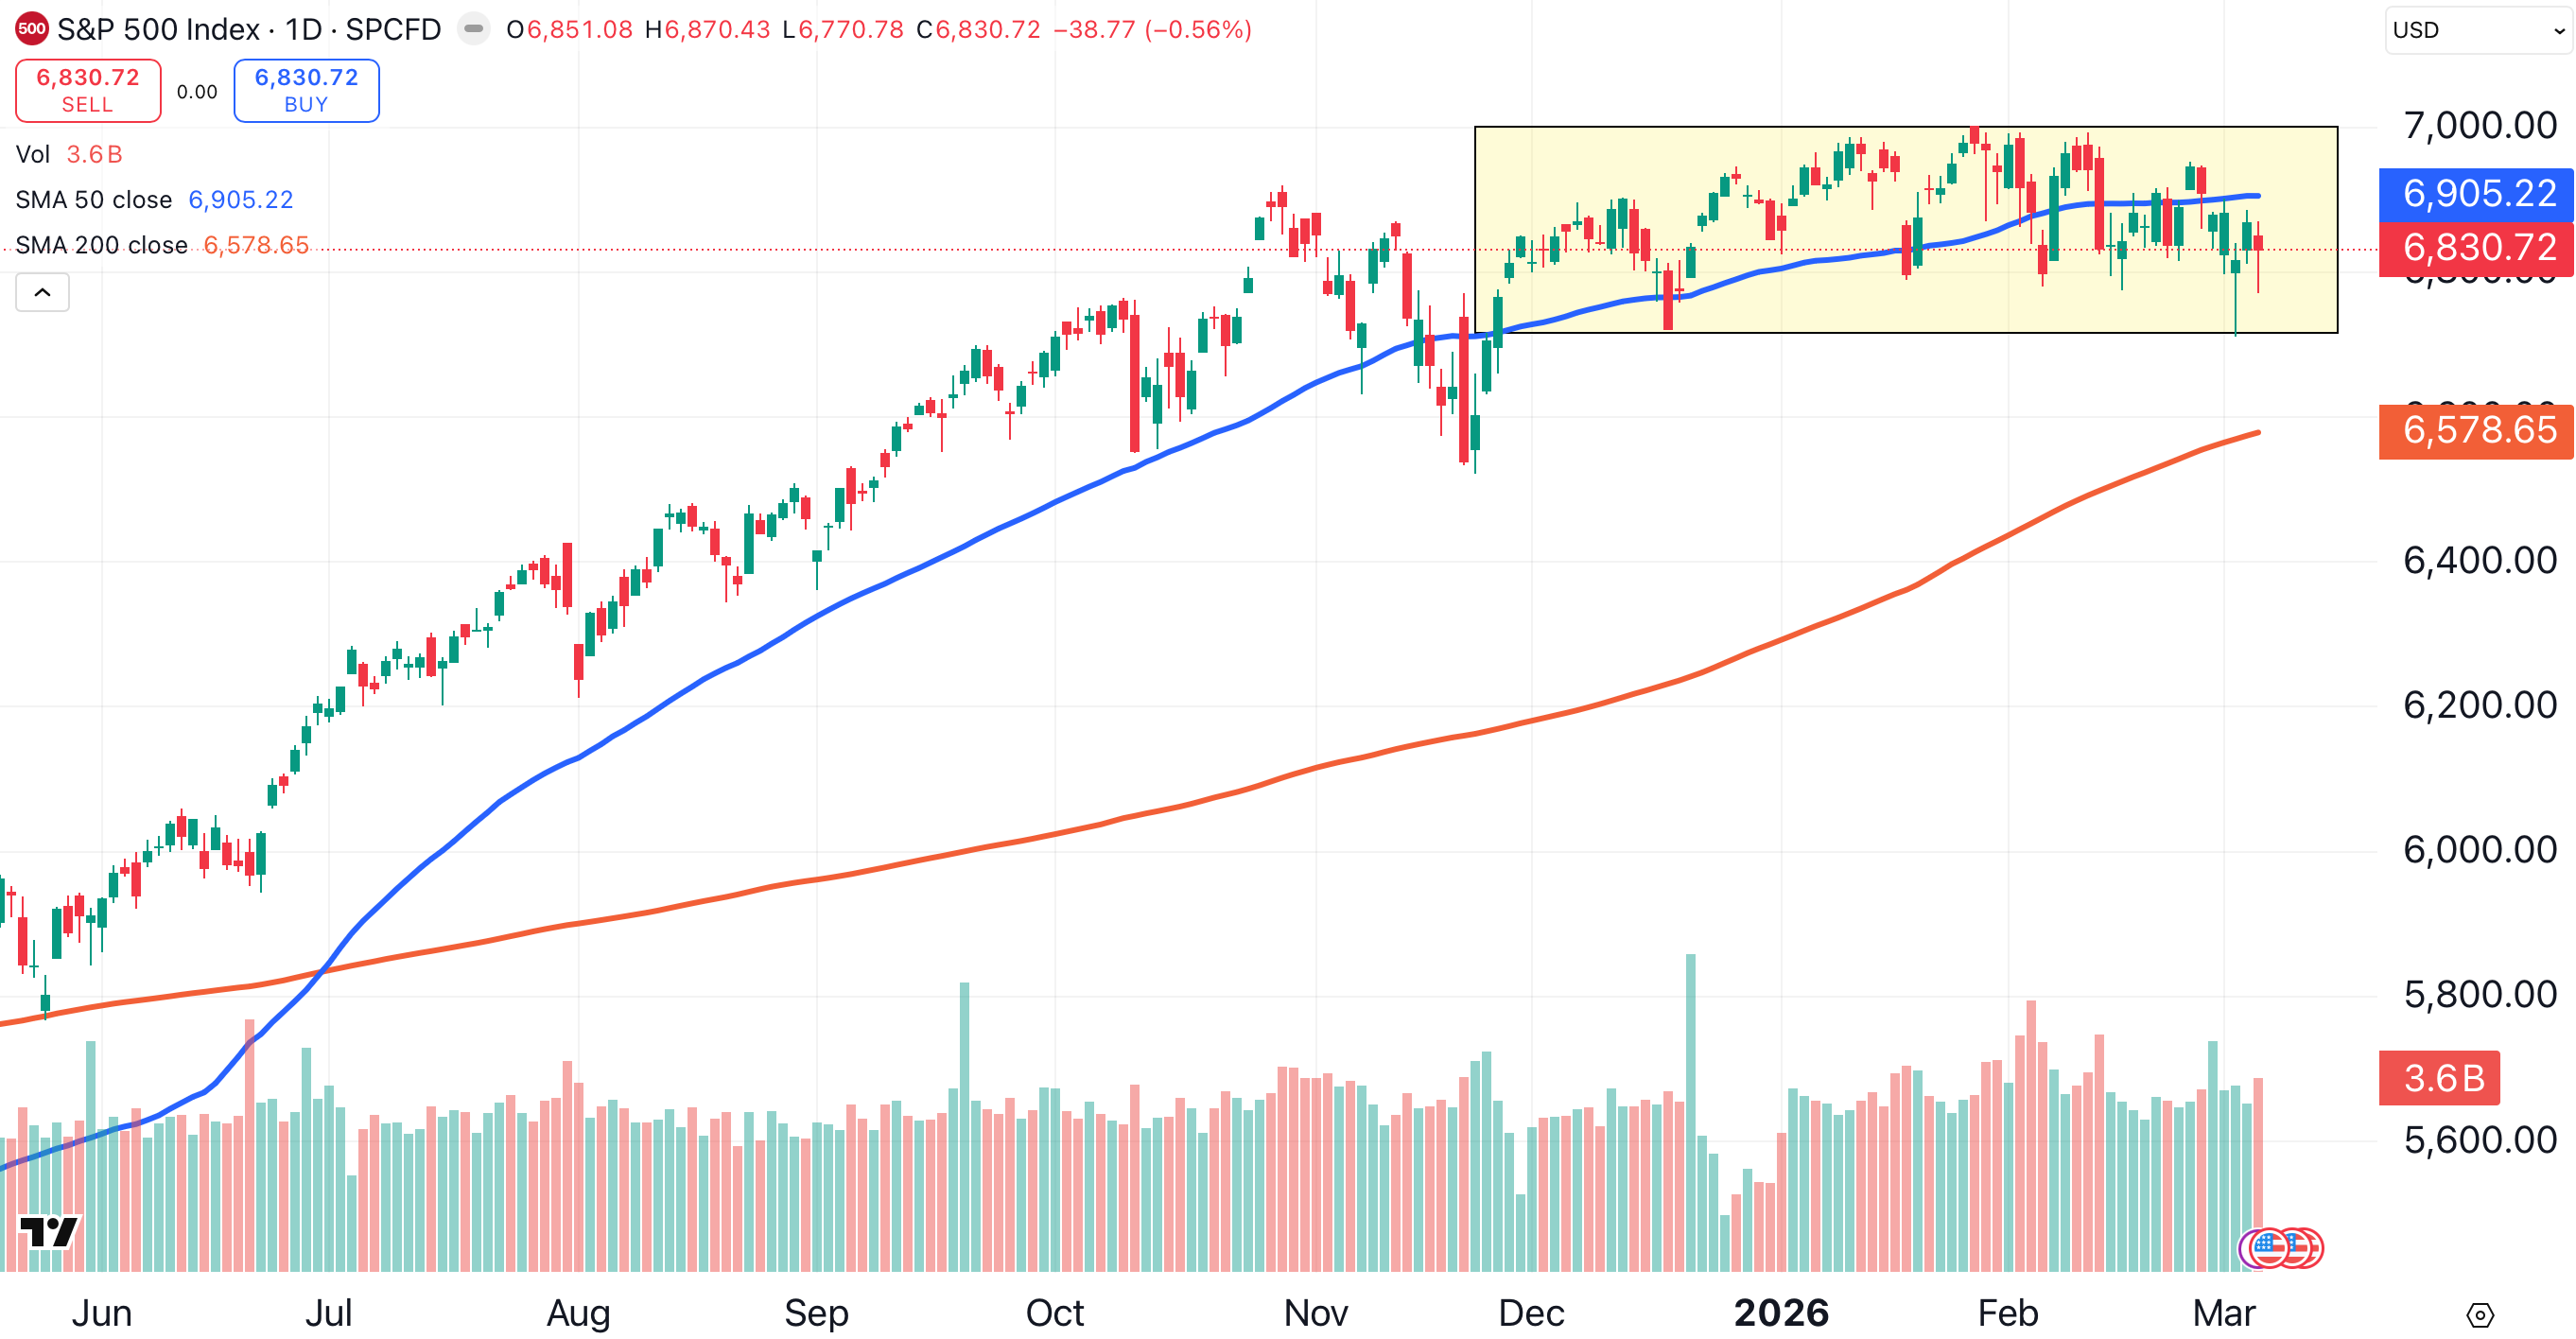
For the S&P 500, that 300-point range extends from approximately 6,700 to 7,000. We’ve been stuck in that range since Thanksgiving (shaded yellow).
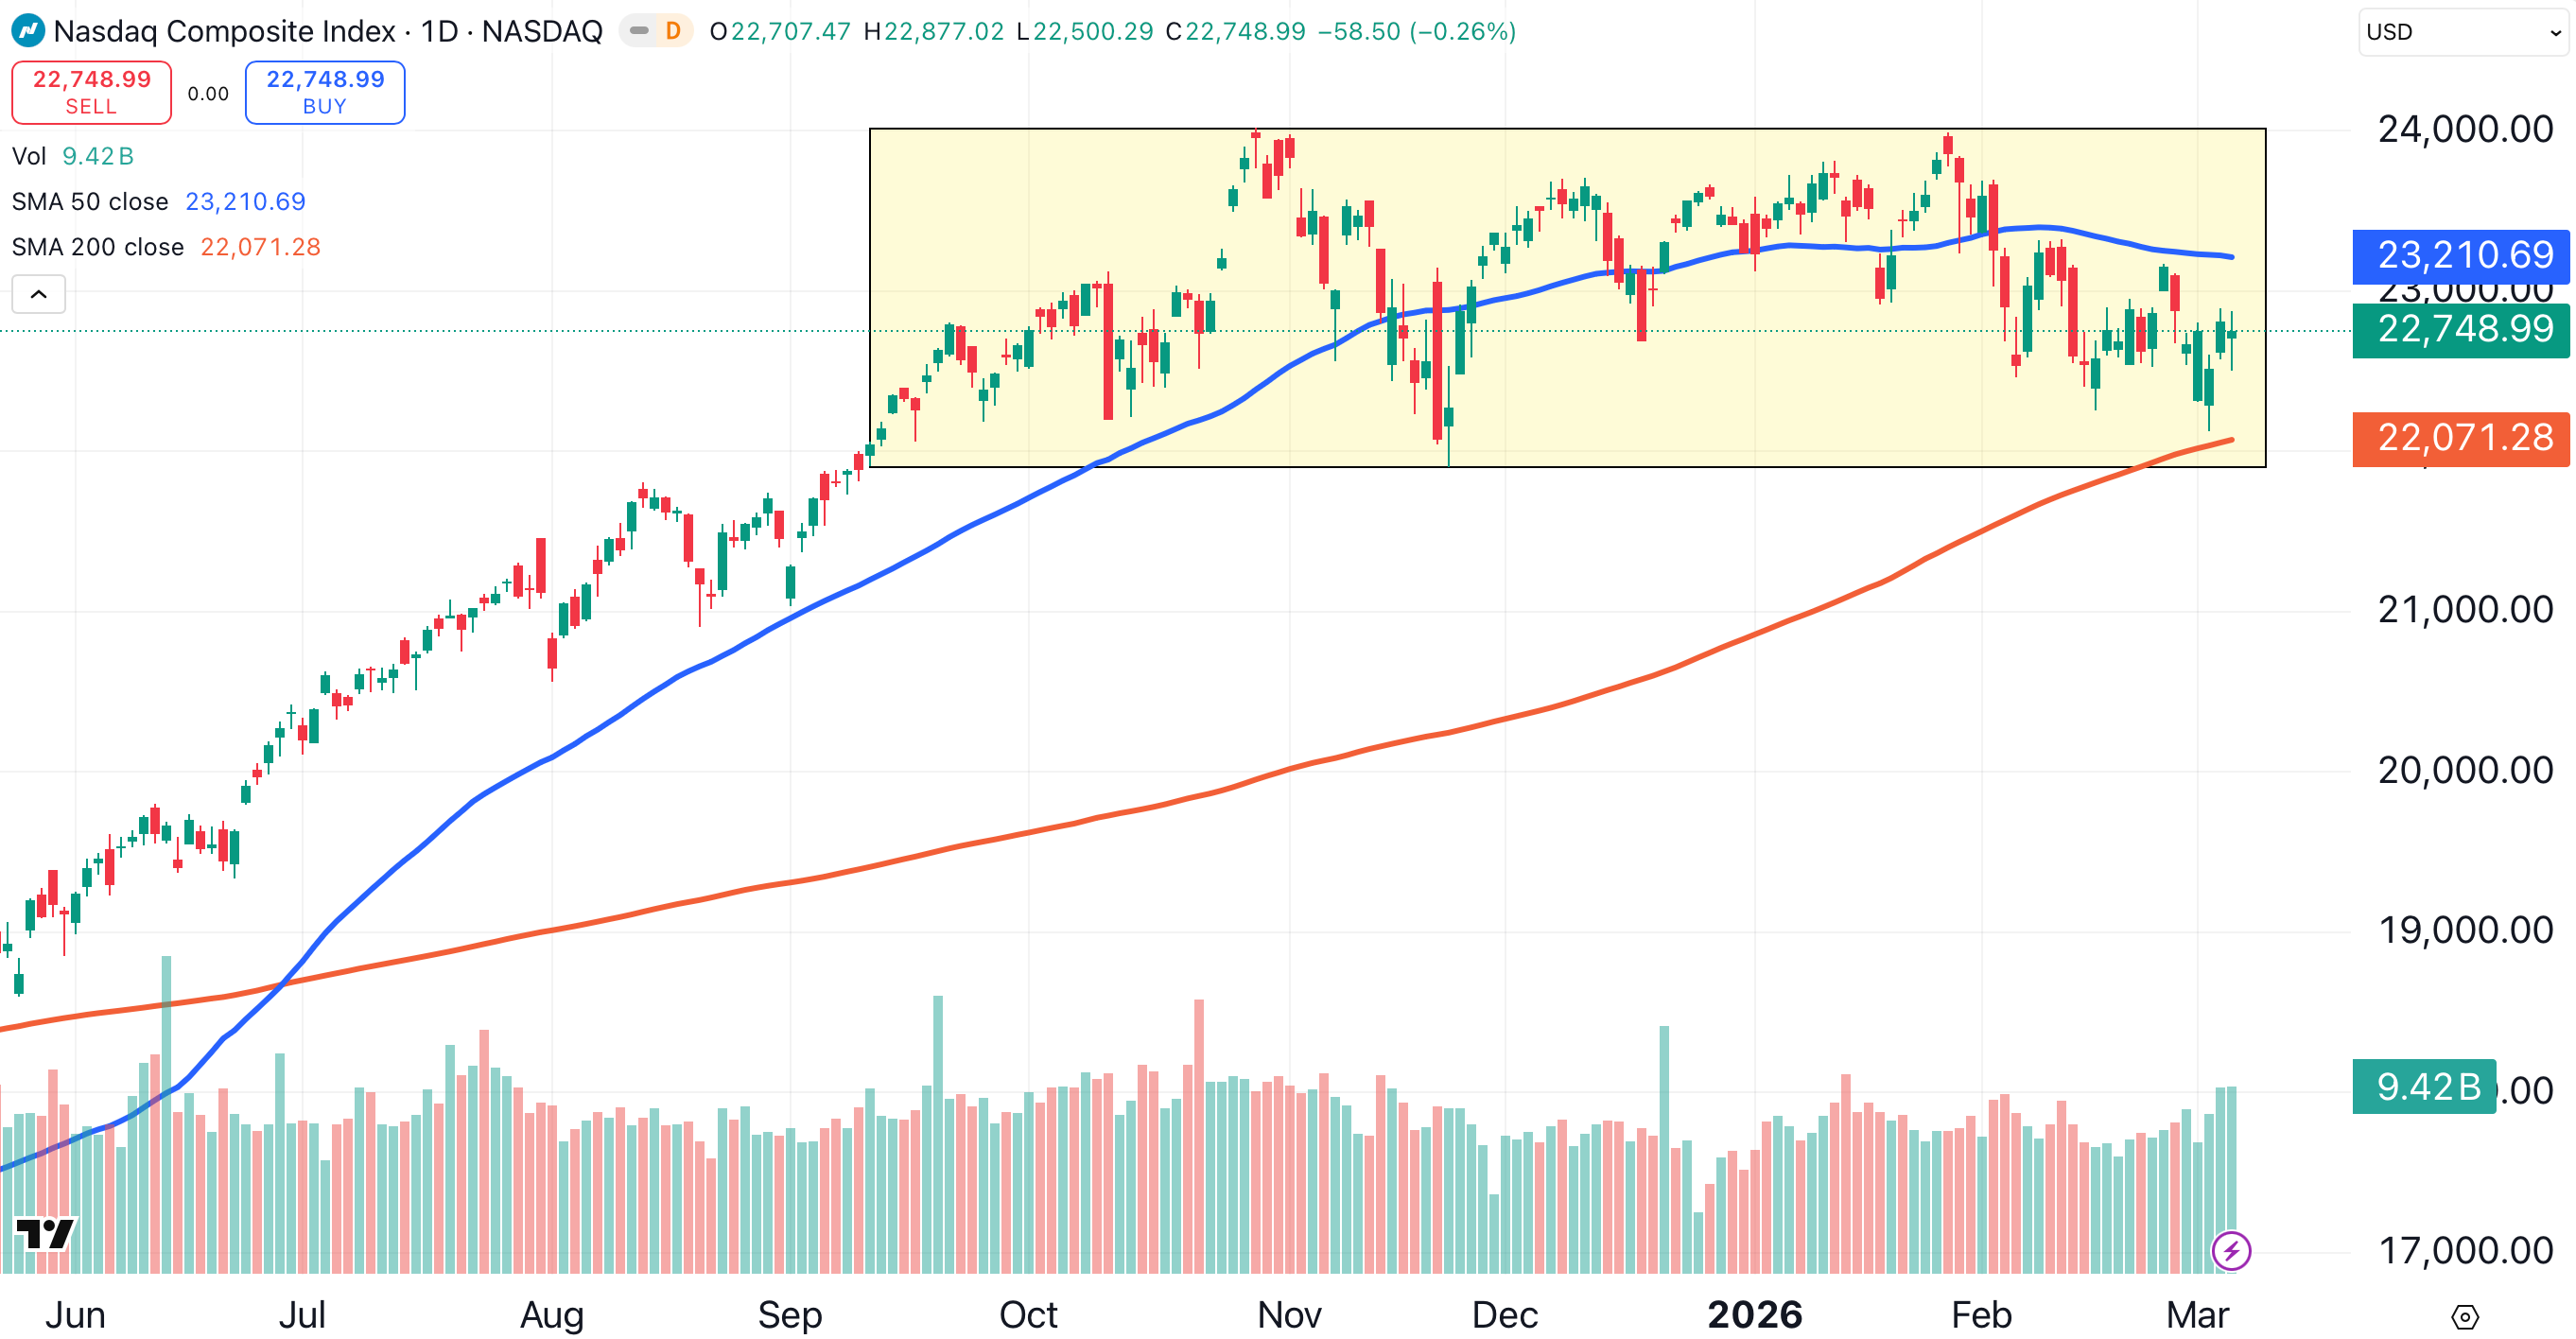
The tech-heavy Nasdaq Composite index has been trapped in a range between approximately 21,900 and 24,000 since Labor Day 2025 (shaded yellow).
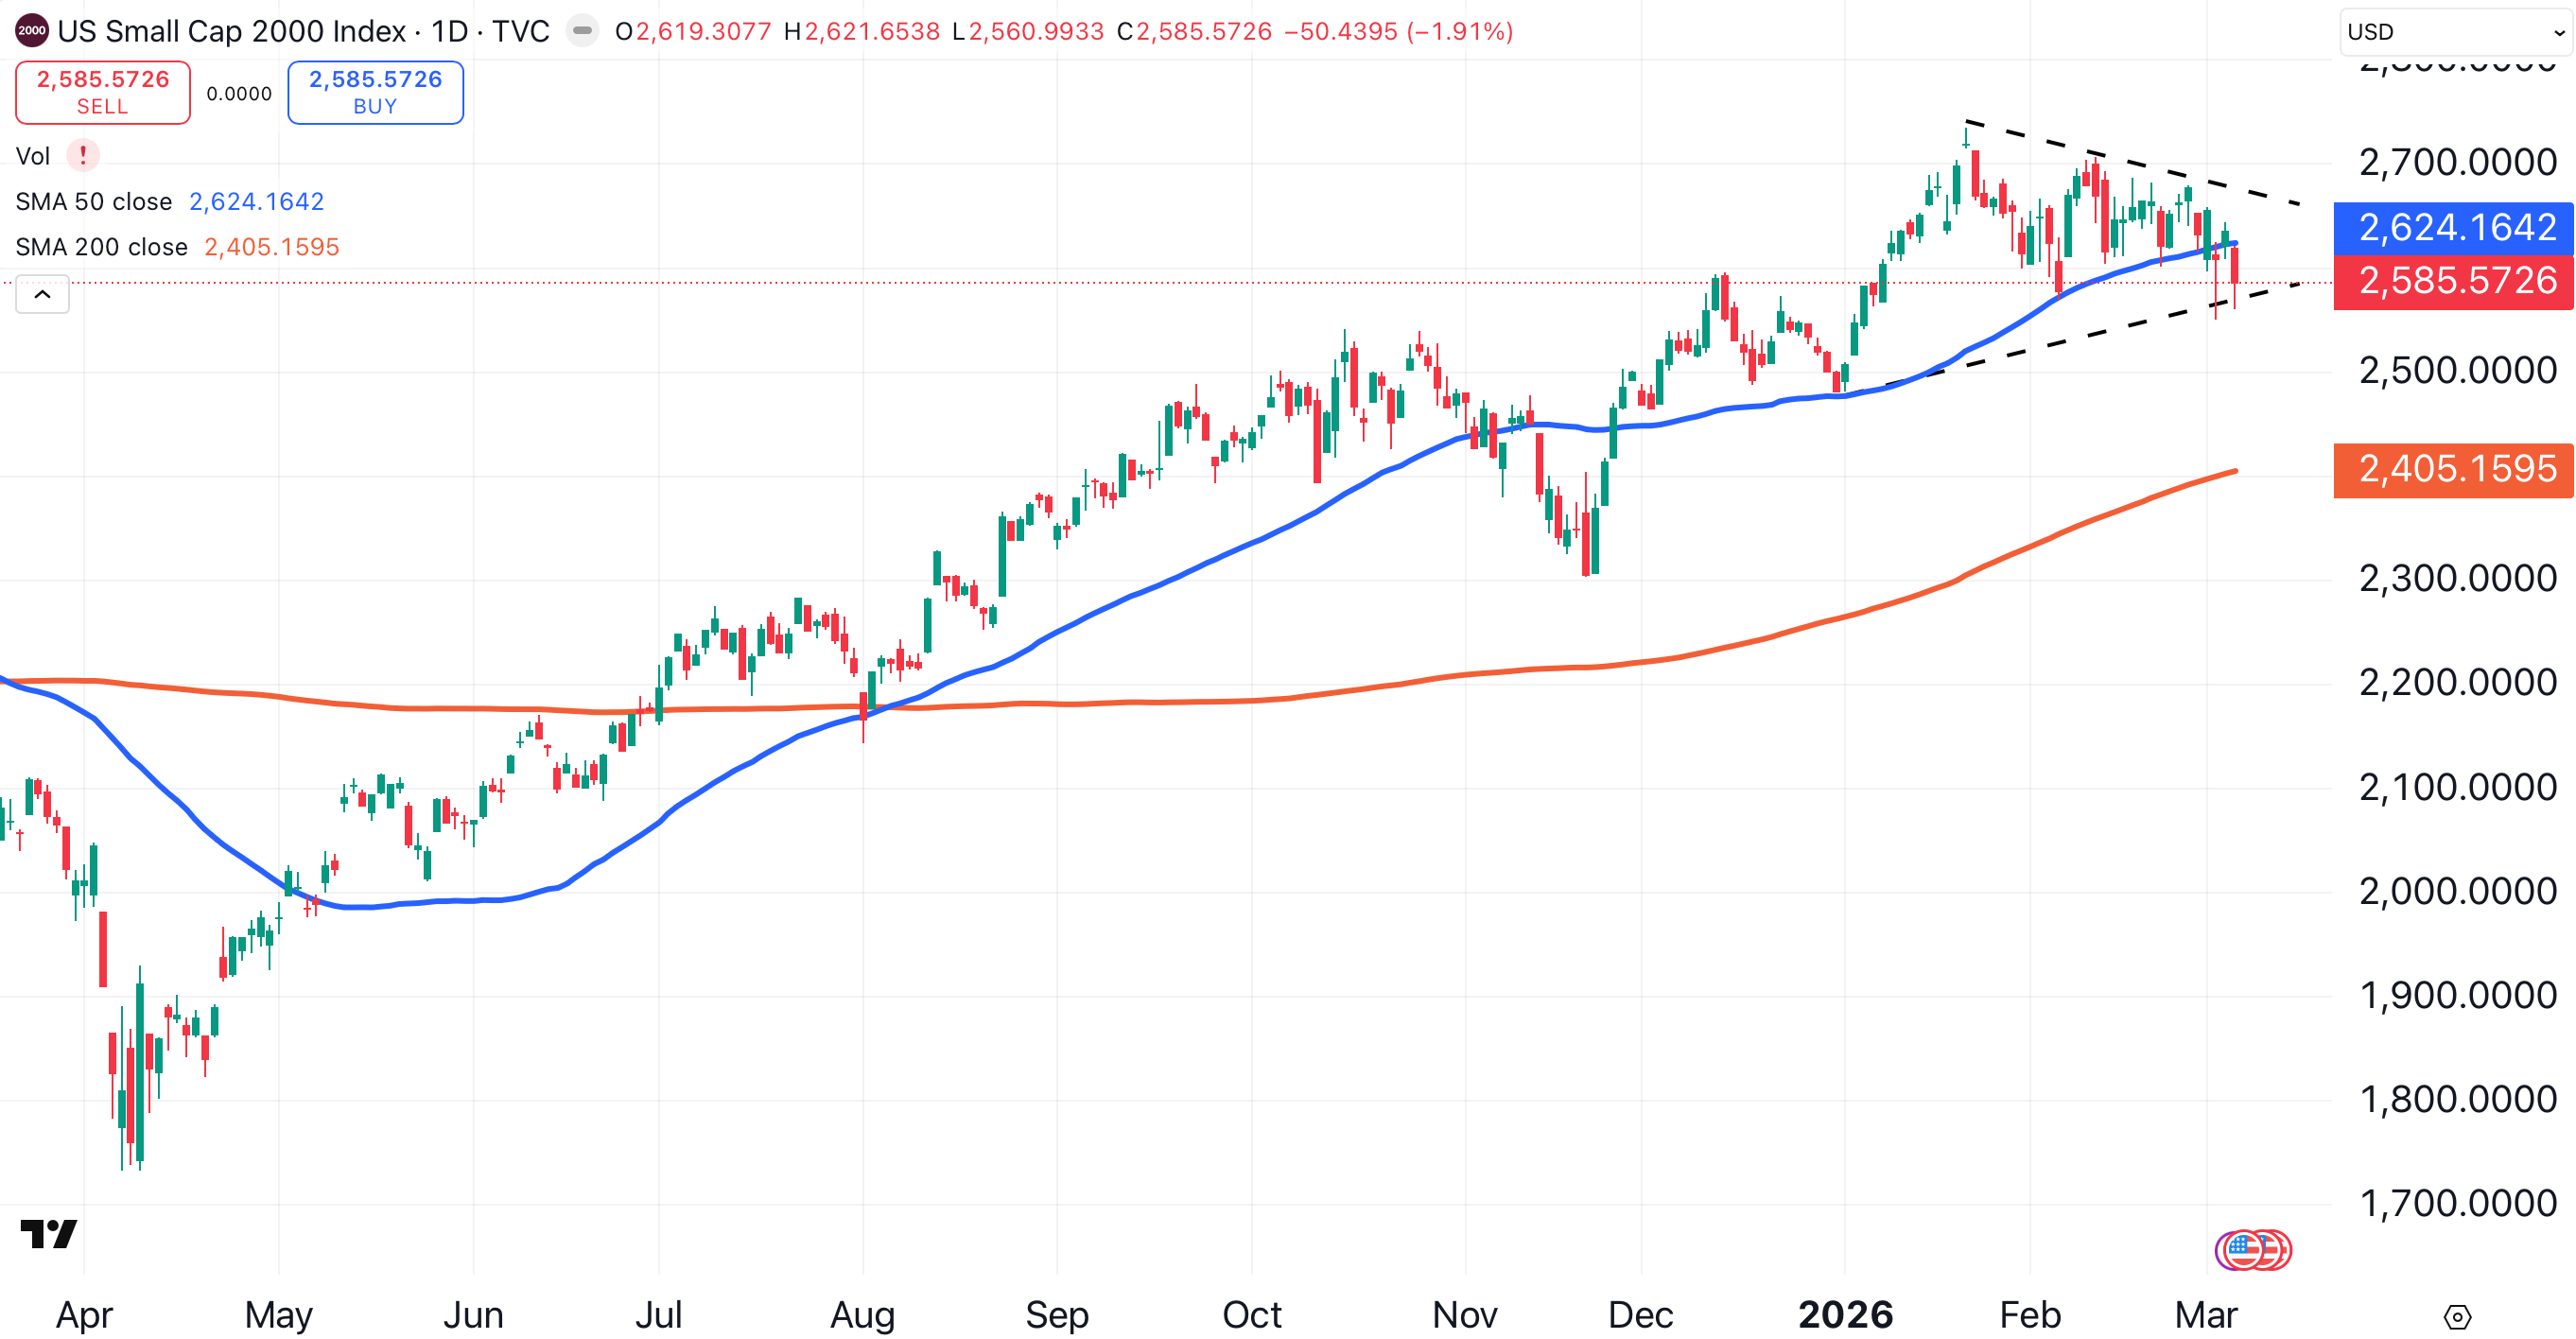
A shorter, tighter consolidation is visible in the Russell 2000, The small-cap index has formed a symmetrical triangle pattern (black dotted lines).
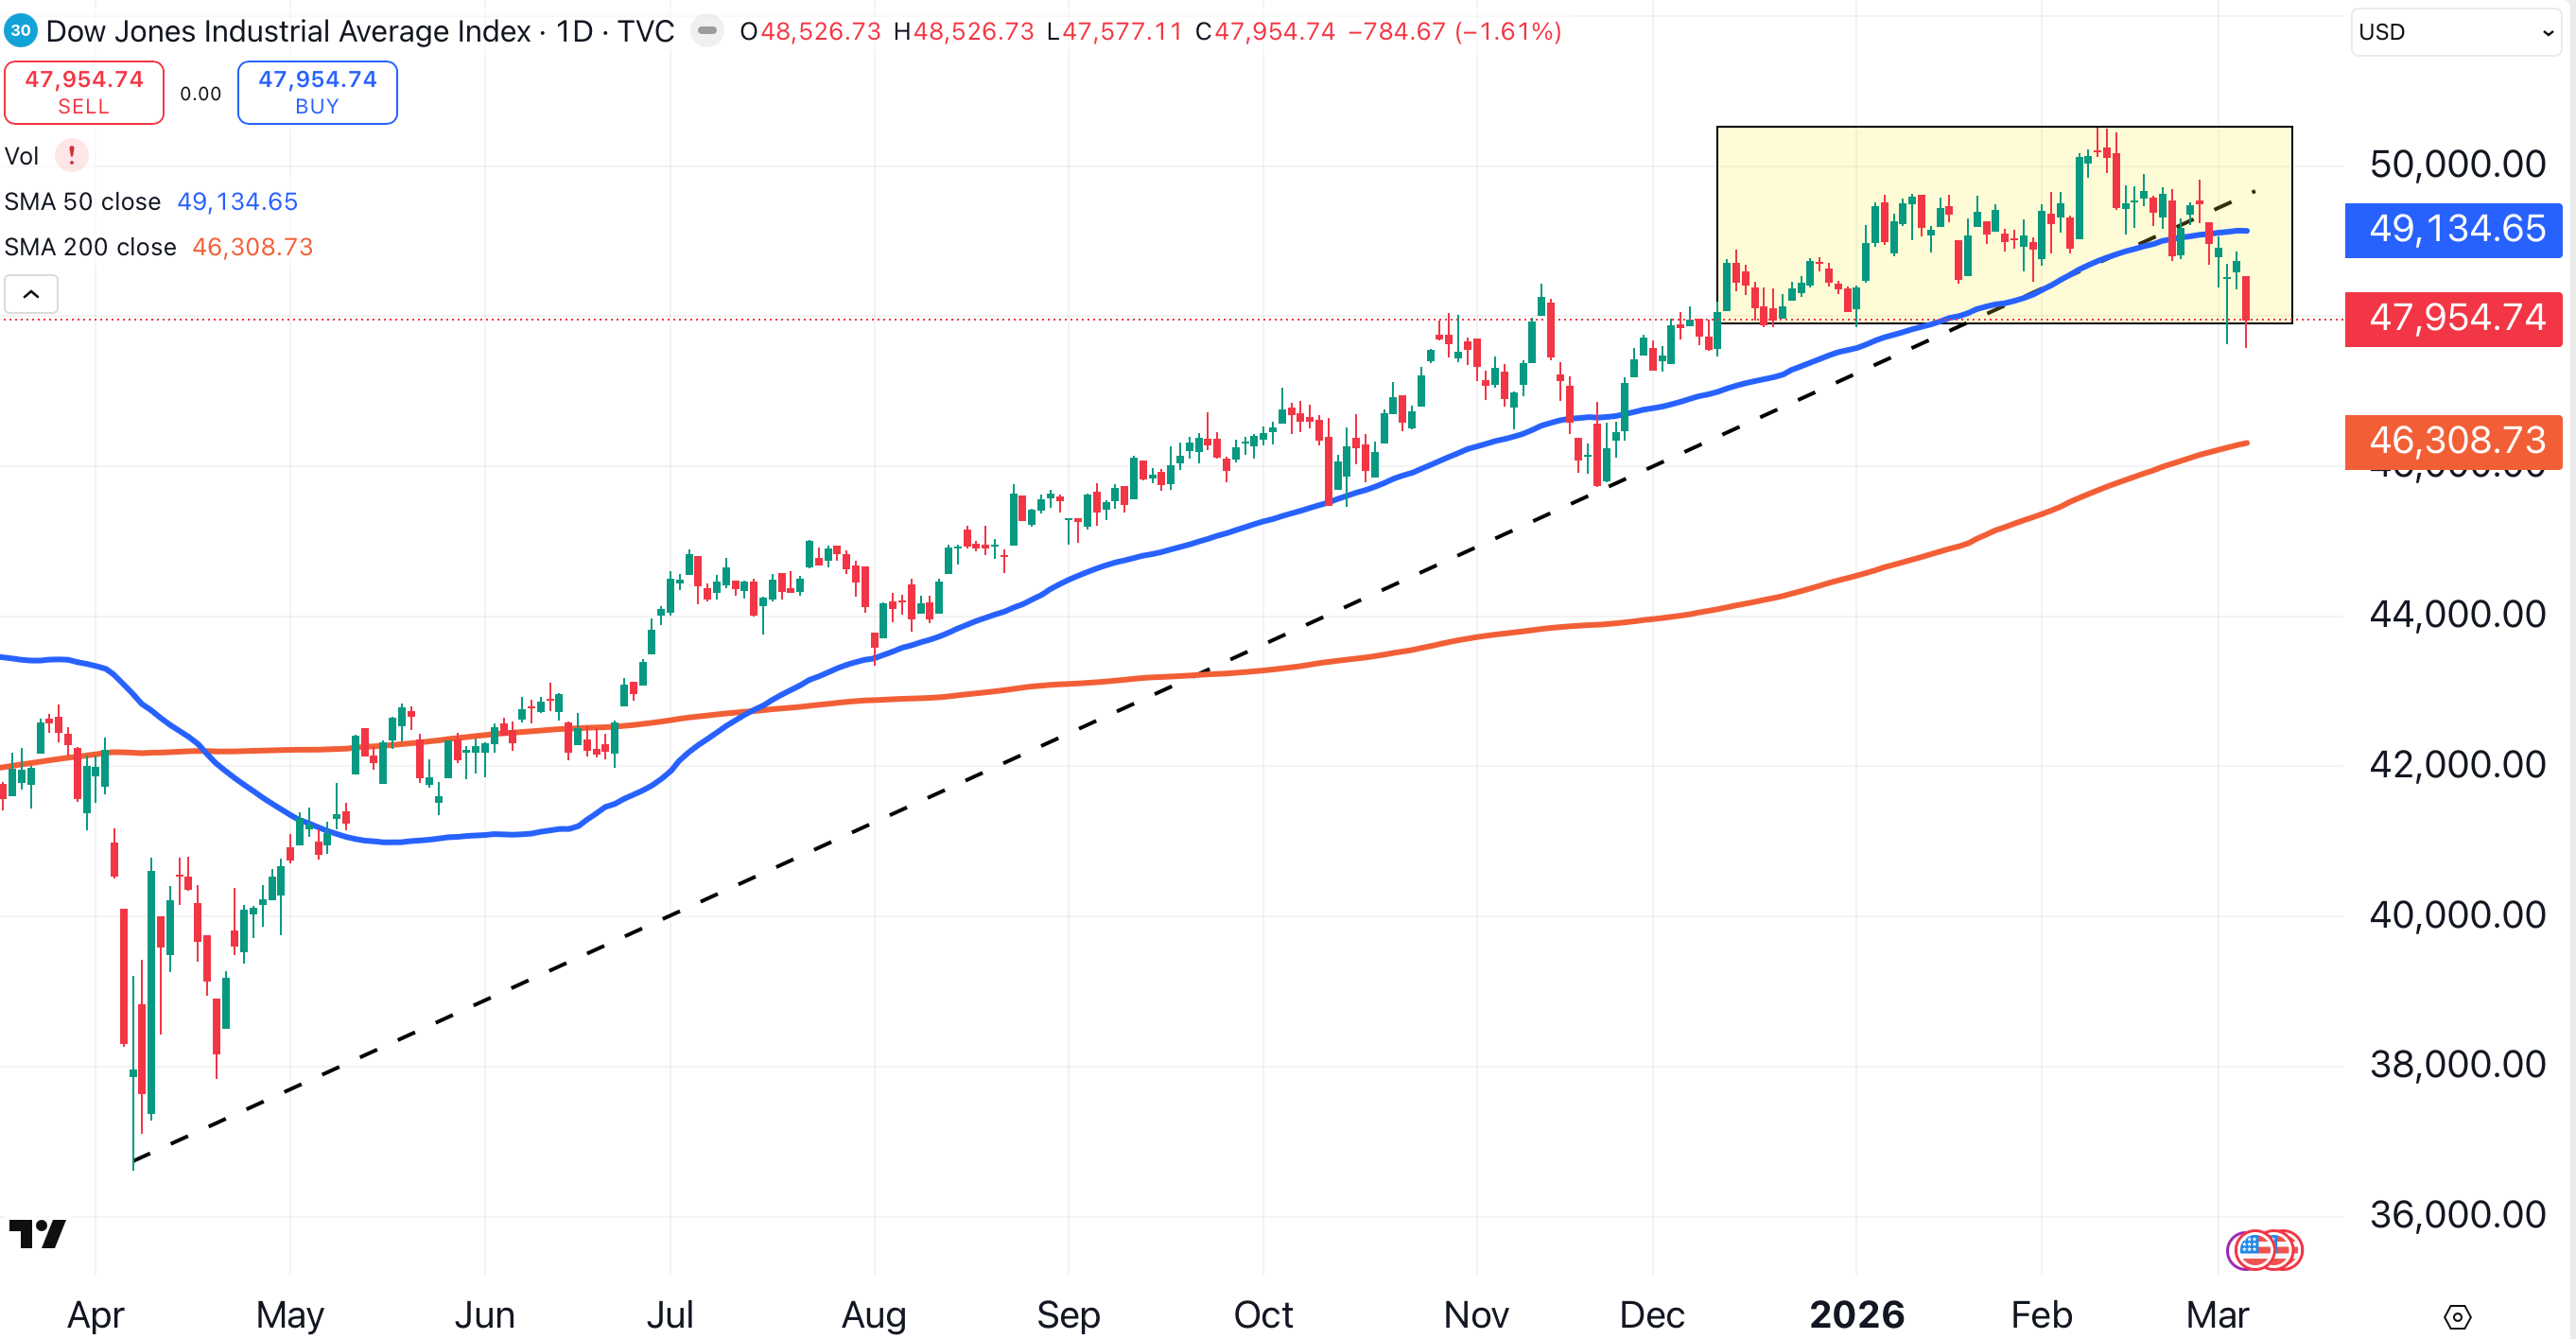
While the Russell currently has the best chart of the major indexes, the Dow Jones Industrial Average may have the worst.
The DJIA broke a major trendline that had been intact since April (black dotted line), and closed at a two-month low on Thursday. The Dow is also threatening to break down from its three-month long consolidation (shaded yellow).
The Muscle Is in the Russell
Why does the Russell 2000 have the best technicals of the Big 4 Indexes?
It’s not due to valuation. According to Dow Jones Market Data, based on 12-month trailing price-earnings ratio, the Russell 2000 is the most expensive of the four:
Russell 2000 Index: 36.89
Nasdaq 100 Index: 31.87
S&P 500 Index: 24.75
Dow Jones Industrial Average: 23.5
(As of February 27, 12-month trailing PE.)
Let's Get Small
If the stocks on the Russell aren’t cheap, why are investors putting money to work in that index?
Consider the following average market capitalization stats:
- Dow Jones Industrial Average: Average market cap = $763 billion
- Nasdaq 100: Average market cap = $268 billion
- S&P 500: Average market cap = $65.7 billion
- Russell 2000: Average market cap of $5 billion, and a median market cap of just $1 billion.
Advantages of Smaller, U.S.-Based Company
Texas Roadhouse (TXRH) is a component of the Russell 2000. Its market cap is $11.5 billion.
The steakhouse chain has 730 U.S. restaurants, along with 70 overseas locations. More than 90% of the company’s stores are in the U.S.
If Texas Roadhouse continues to grow, it’ll graduate from the Russell 2000. Eventually, the company will saturate the U.S., and then expand more aggressively overseas. It'll have all the benefits — and all the headaches — of a large, multinational corporation.
At that point, the company will have significant exposure to overseas economies. But for now, that company has little exposure to overseas markets.
That’s a good thing. According to the OECD, the U.S. is the fastest-growing of the G7 economies, both on a quarterly (Q4 2025) and an annual basis:
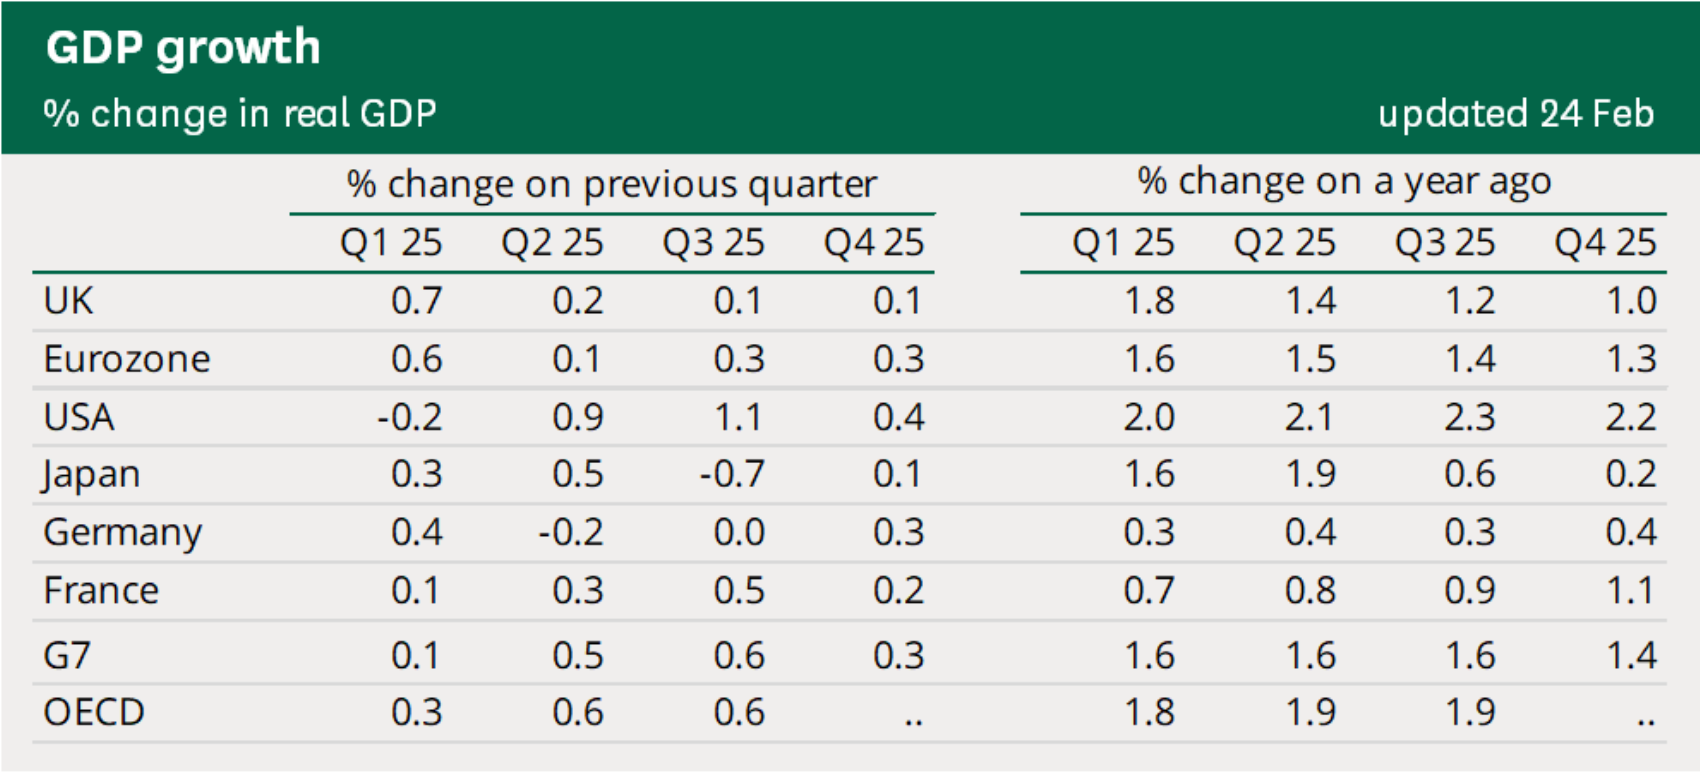
For U.S. companies listed on the Russell 2000, there’s no place like home.
Related: China Sets Historically Low Target Amid Iran Oil Disruption
