Are You Feeling the Complacency?
Let's check in on investor sentiment.
You've reached your free article limit
You've read 0 of 1 free Pro articles.
The Market
When it comes to sentiment, there are those who think everyone is too fearful (see the hysteria over CNN’s Fear and Green touching Fear last week) and those who think there is too much giddiness (see the non-stop bubble talk). That is why I say the sentiment is complacent. And I believe it has been that way for a while now.
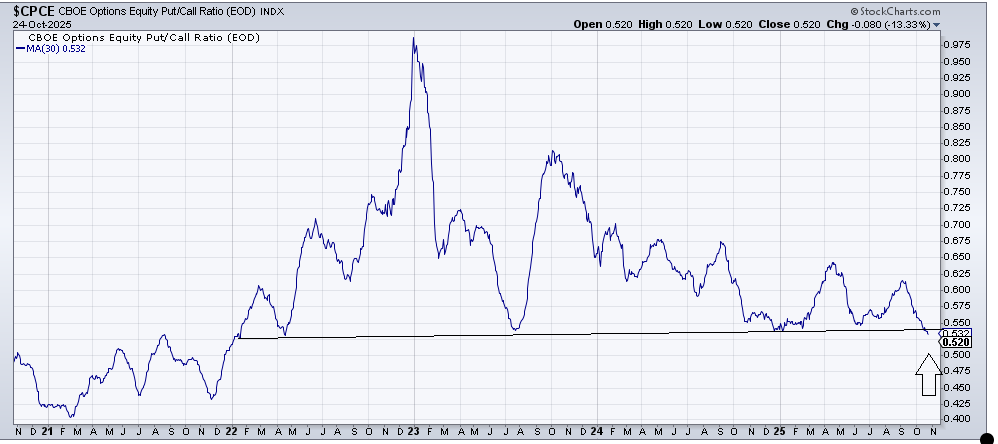
For example, the 30-day moving average of the equity put/call ratio slipped to the lowest level since 2021 (which was a giant outlier in terms of bullishness) last week. But it is not yet at the craziness we saw in 2021.
This tells me there is a lot of bullishness out there, but it’s hard to say folks are giddy.
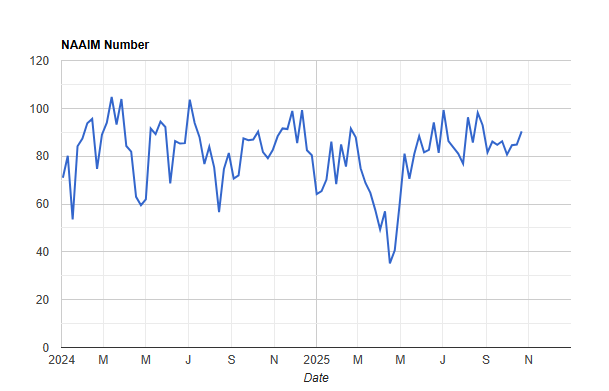
Last week, the folks at NAAIM pushed their exposure up to a smidge over 90, which is the highest it has been in two months. But it is not at 100 as it was last summer. Call this a move back toward too bullish.
We already know the Citi Panic/Euphoria is solidly in Euphoria. We know the Investors Intelligence bull/bear ratio got to 3.75 (over 4 is extreme), so those are leaning too bullish. We know the day traders at AAII stay invested near 65% but vote bearishly nearly every week (which is why I think this is a terrible indicator unless confirmed by others).
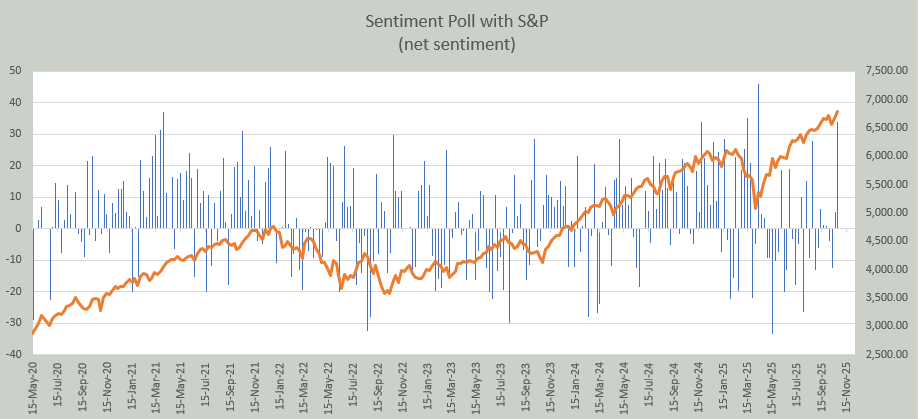
Then this past weekend, my Saturday Twitter Poll, where I ask where folks think the next 100 points in the S&P will go, shows 67% voting up. To put that in perspective, this poll, that is very unscientific but I have been doing every Saturday for the last five-plus years, rarely shows a net of over 30. My takeaway is that folks are quite bullish for the week.
So I looked back to see there have been seven times folks have gotten this bullish. As you can imagine, it’s split as to whether they were right or wrong (4 were right, 3 were wrong). What I find interesting is that prior to 2025, they were right three out of the four times. In 2025, they have only been correct one out of three.
It remains to be seen if they will be right or wrong, but my takeaway is that sentiment is still complacent, or maybe I’d call it very complacent. As we head into the week, we are short-term overbought and could use a pullback. One thing bulls do not want to see is a gap down, leaving Friday’s action as an island.
New Ideas
I am still struggling to find new ideas because I do prefer when there are bases or at least charts that have gone sideways, and there are just so few of them now.
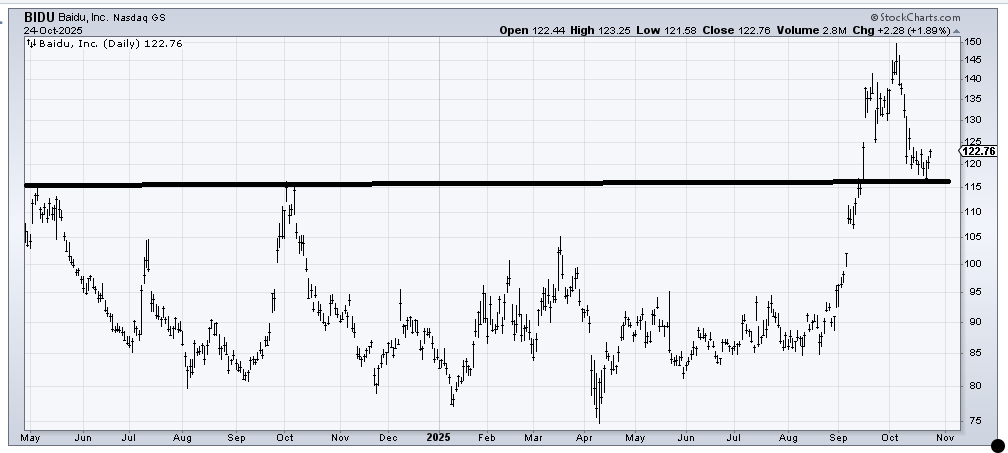
We had a nice trade in Baidu (BIDU) coming out of that base last summer. It has now come down to support. As long as it doesn’t break under 115 it should be okay. I think it could use some more work going sideways, but this is the area.
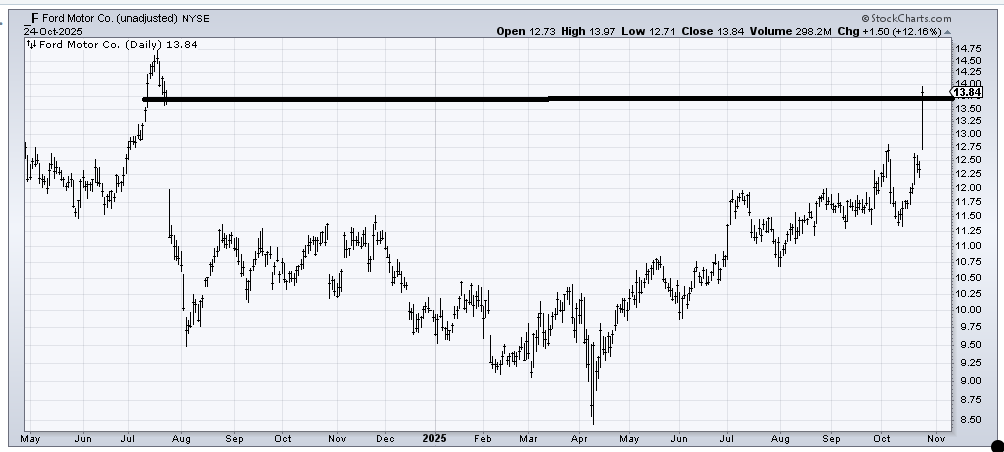
I recommended Ford (F) in June –again, coming out of the base—with an eye toward filling that gap from July 2024. On Friday it finally filled that gap. I suppose it can keep on going but my inclination is that on a short-term basis, this is where I’d take some profits.
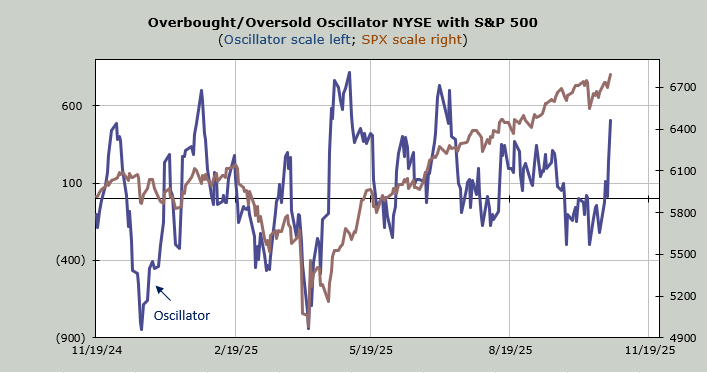
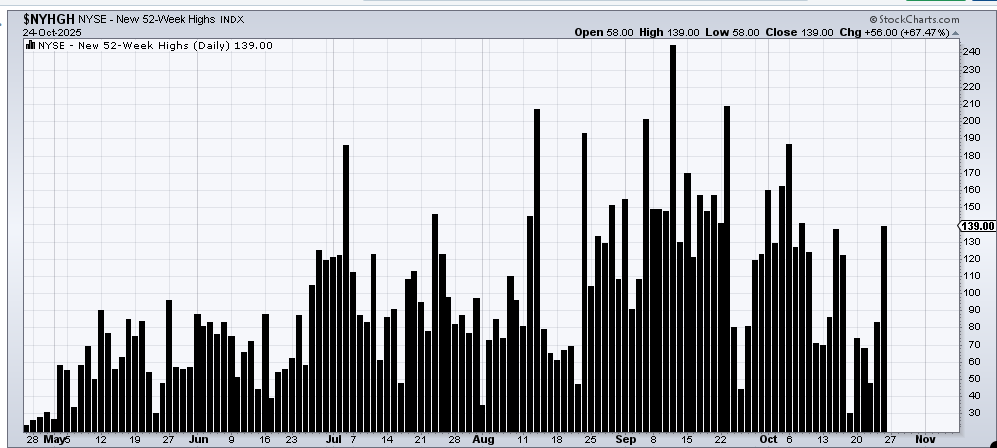
Today’s Indicator
The new highs continue to disappoint but new lows continue to be contained.
Q&A/Reader’s Feedback
Helene welcomes your questions about Top Stocks and her charting strategy and techniques. Please send an email directly to Helene with your questions. However, please remember that TheStreet.com Top Stocks is not intended to provide personalized investment advice. Email Helene here.
A reminder that many of these stocks will have earnings coming out shortly and I shy away from ‘playing’ earnings. Many times, stocks gap up or down on earnings.
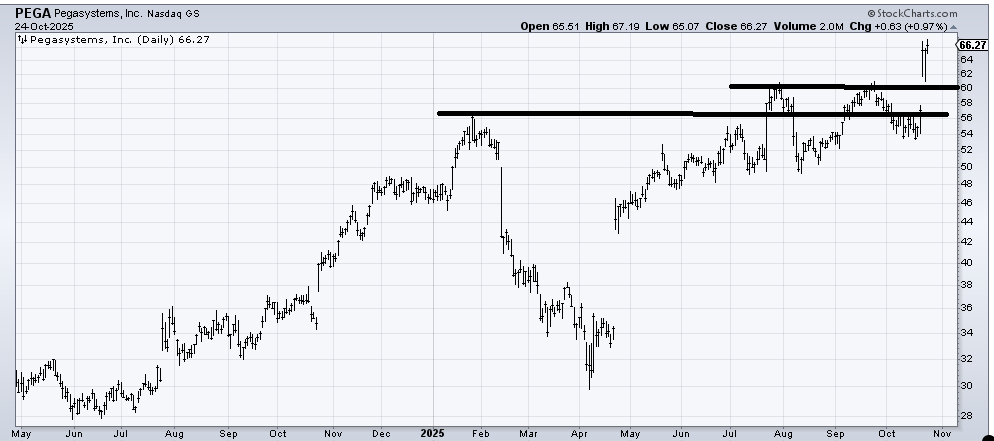
Pegasystems (PEGA) is not my kind of chart because it has gapped up and is near the highs however there is a next target around 70 and a longer term one in the mid 80s. I would not want to see the stock go much below 60 on a pullback.
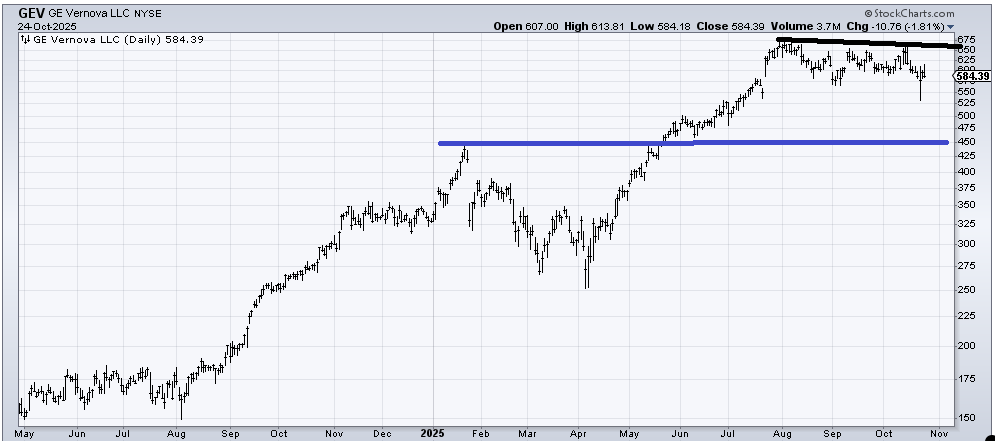
GE Vernova (GEV) had a measured target of 650 (from the breakout over the blue line). See the way it went into an extended correction? Last week’s spike down couldn’t really stick (so far). It looks to me as if the chart is potentially half-way through its sideways correction so as long as that spike down from last week holds it ought to start working the right side of the pattern (i.e. back and forth between say 570 and 650 to fill out the right side before heading upward again).
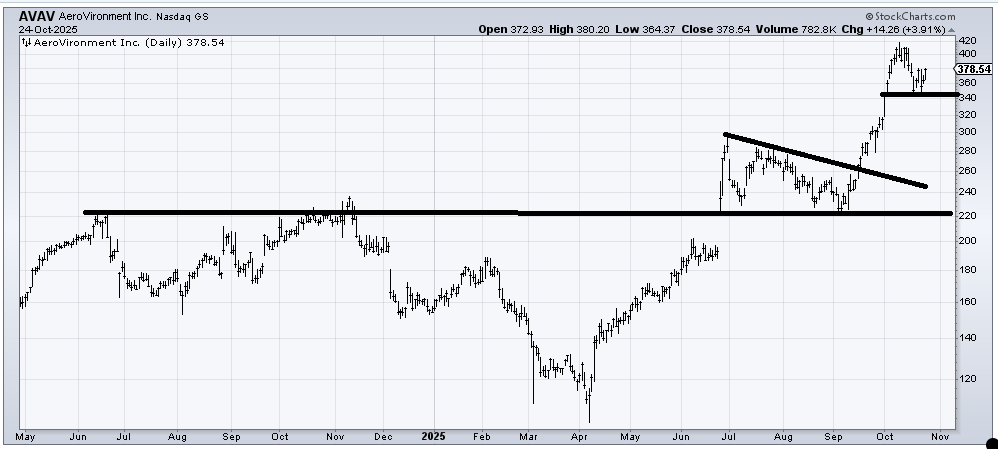
AeroVironment (AVAV) has gone beyond any measured targets I have, so I’d hang on with a stop under 340.
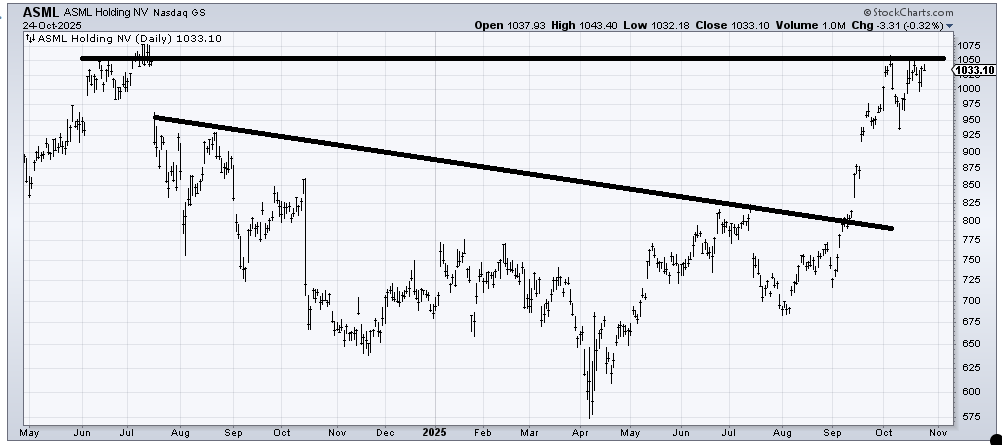
ASML (ASML) filled the gap at 1050. The stock has a measured target in the 1050-1100 area, so it’s hard for me to get excited over it. If it could do some sideways action (see GEV) it’s possible it would set up again.
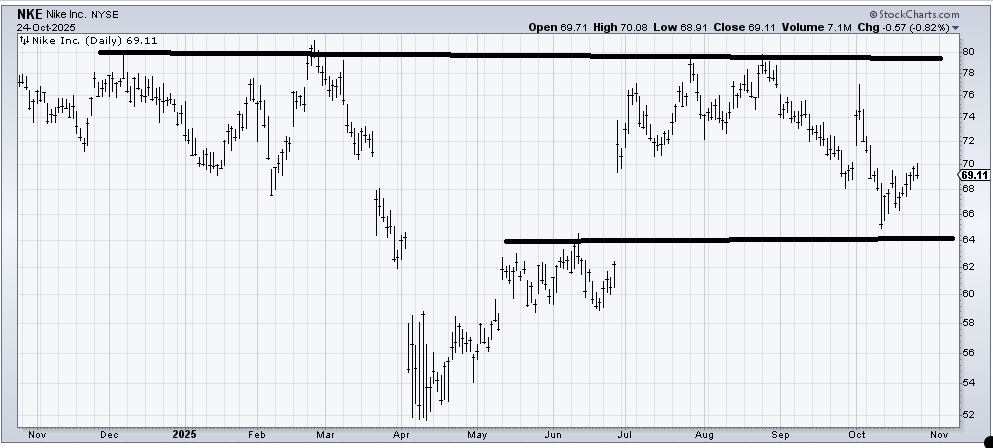
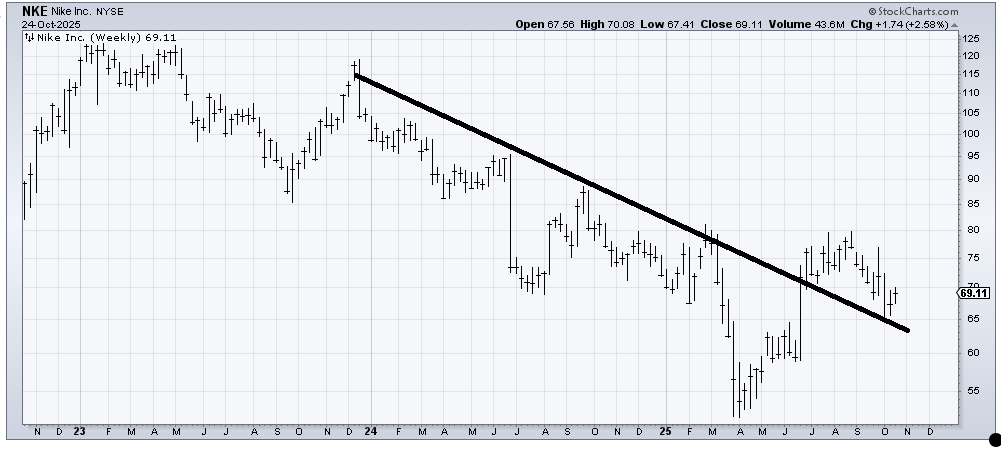
Nike (NKE) has a terrible chart. But hear me out. The stock has gone absolutely nowhere for years. Short term, I’d call it a coin flip because I would have loved to see it fill that gap at 62 on this last trip down. But look at the 3-year weekly chart. That looks like a bottom in the making. Or a potential one. My guess is you’ll need a lot of patience, but I’d lean positive on this chart.
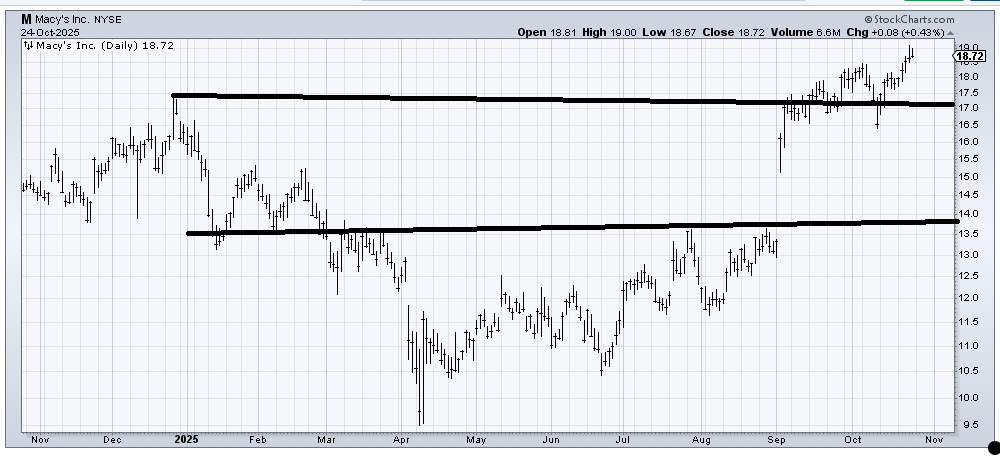
I waited forever for Macy’s (M) to make a move, and I finally got so tired of waiting I put the (hand drawn) chart in the discard pile earlier this year. It should have been a sign it was a buy!
I have a measured target in this general area (18-20), so it’s hard for me to get excited, but the stock hasn’t done a thing wrong so as long as it stays over 17, it’s fine.
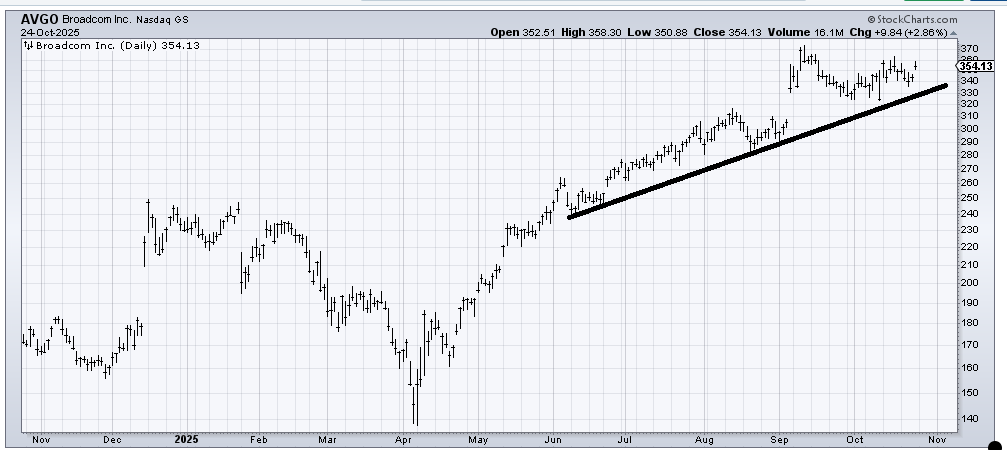
A few weeks ago, when Broadcom (AVGO) came down near 320, I liked the chart. Again, do you see how it had done some ‘work’? That’s all I ask! I would have liked to see it over 360 by now, but as long as it stays over that uptrend line, the chart is fine.
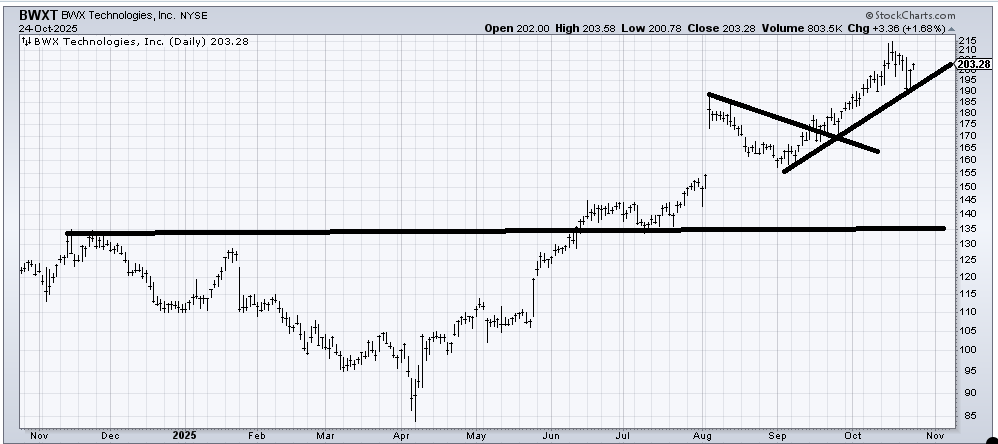
BWX Technologies (BWXT) is not my kind of chart because it is up so much without a pattern, and it has hit its target. As long as it stays over 190-ish, maybe it sets up another pattern (as it did in August and September).
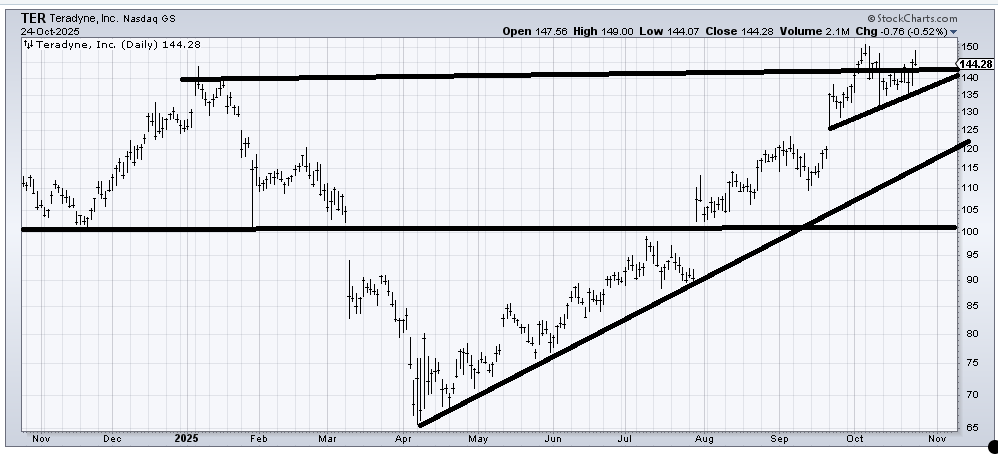
Teradyne (TER) could use some more sideways work for my taste. I would not want to see it trade back under 135 in the near term. Longer term, if it can fill that gap at 120, which would also tag the uptrend line, the chart would look okay to me.
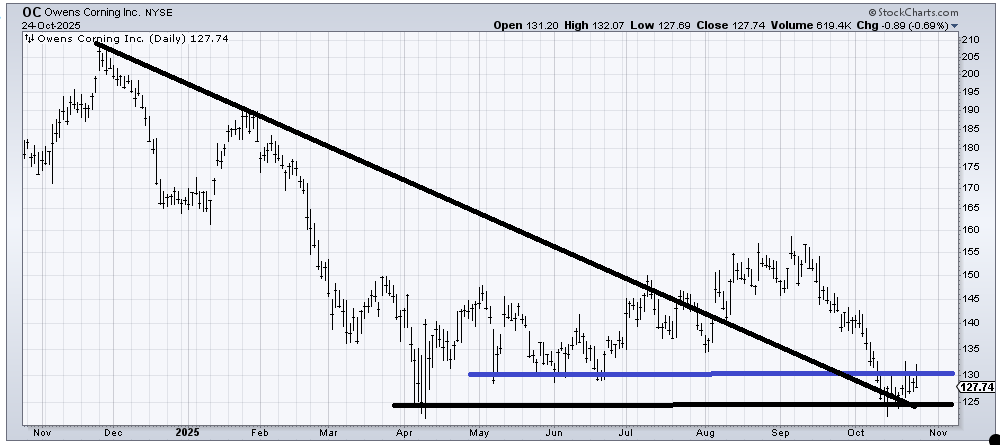
Owens Corning (OC) has my attention because it has come down to the April low, and for now, it has tested it. A stop under that recent low is where I’d start. But I would also like to see it get itself up and over 133 to show it has some oomph. There is resistance all the way up, though, so it will require a lot of patience.
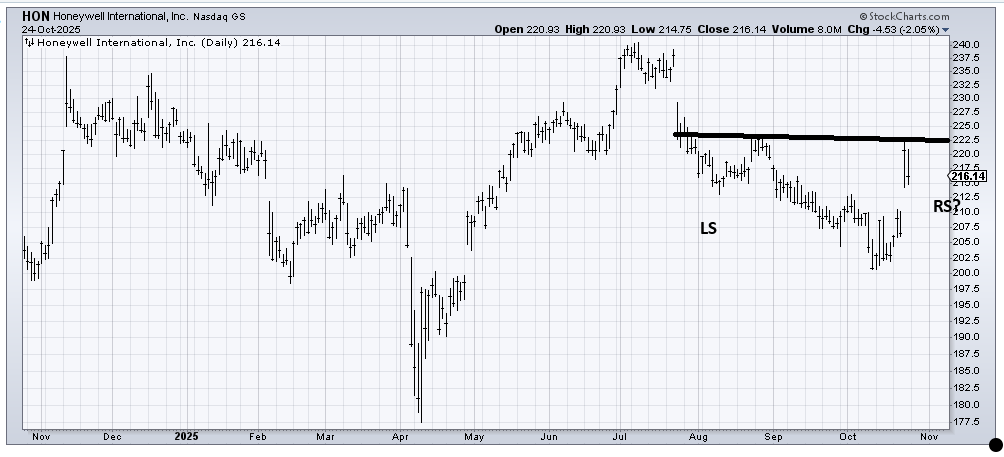
Honeywell (HON) gapped up on earnings and then couldn’t really hold it. There is so much of that going on. However, some sideways work now would build out the right side of the chart. I actually would prefer if it didn’t fill that gap.
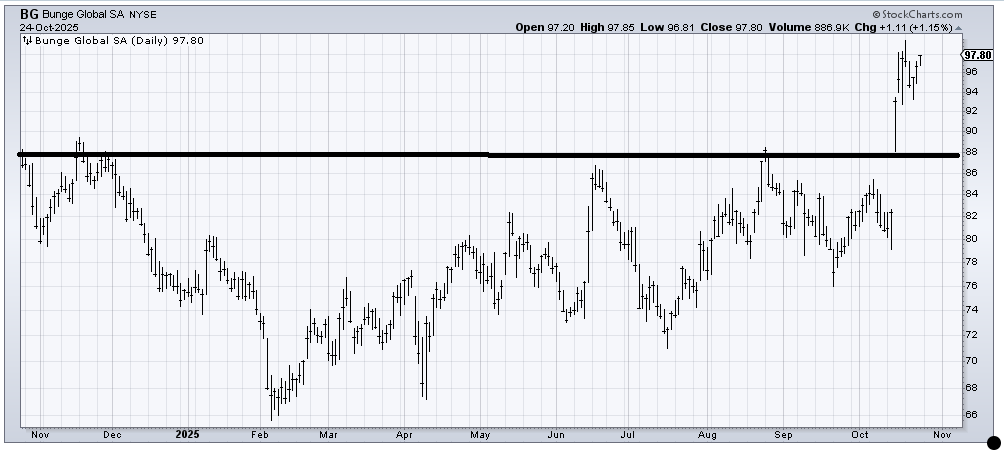
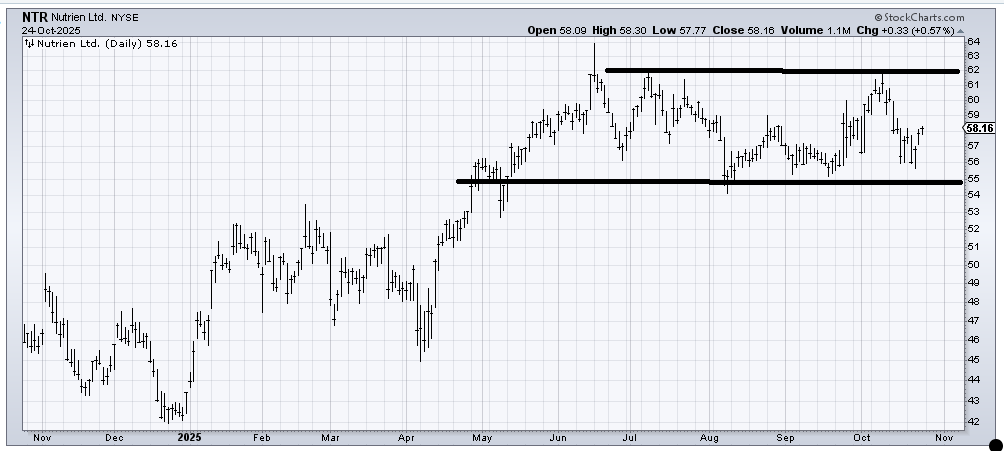
Bunge (BG) broke out of a big base and has a next measured target around 100. However, if you want to play the ‘ag’ space, I would remind you that the chart of Nutrien (NTR) is so slow and boring, but continues to build a base.
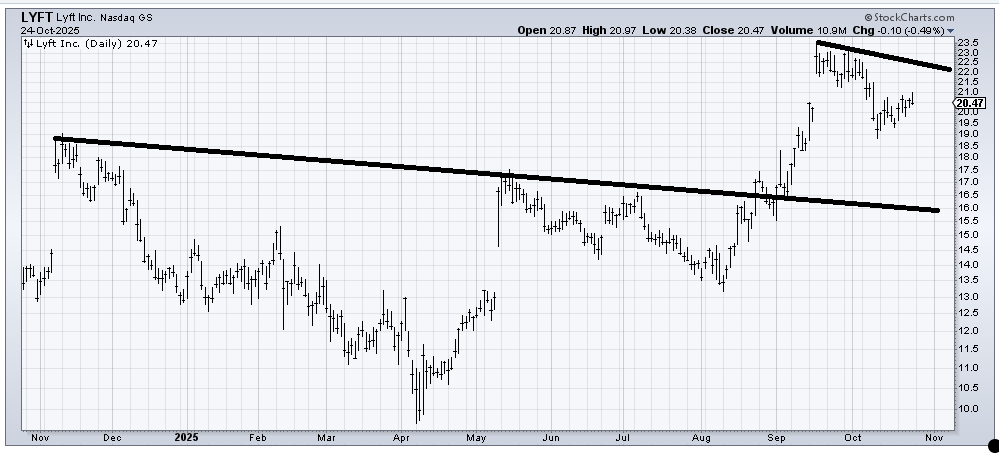
Lyft (LYFT) came close to meeting its measured target of 24 back in September, so if it can continue to do some sideways work up here, it’s possible it shapes up over the coming weeks. I tend not to like it when a stock gaps up and then leaks out so quickly. That usually means there is more work to be done. At least it probably shook out the weak holders.